
Embodied AI Market Size, Share, Trends and Growth

Embodied AI Market by Product Type [Robots (Humanoid Robots, Mobile Robots, Industrial Robots, Service Robots, Cobots), Exoskeletons, Autonomous Systems, Smart Appliances], Level of Embodiment (Level 1, Level 2, Level 3) - Global Forecast to 2030


OVERVIEW
Source: Secondary Research, Interviews with Experts, MarketsandMarkets Analysis
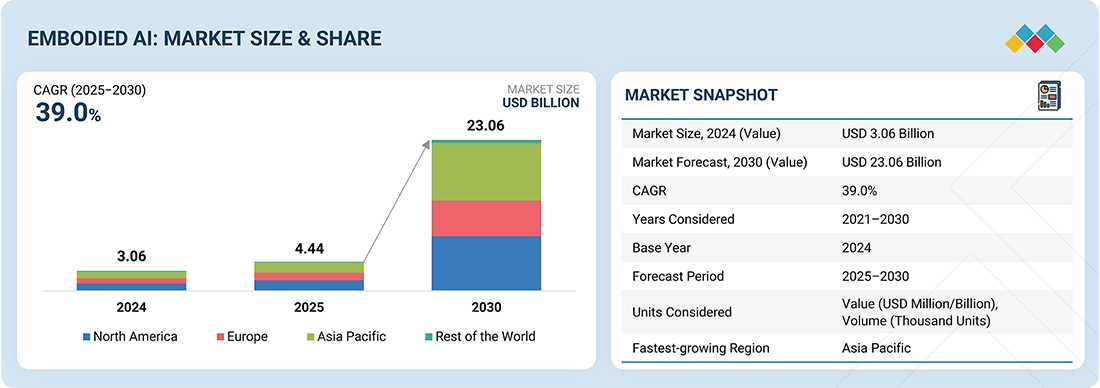
The embodied AI market is projected to reach USD 23.06 billion in 2030 from USD 4.44 billion in 2025, growing at a CAGR of 39.0%. Embodied AI refers to artificial intelligence systems integrated with a physical form, such as robots or autonomous machines, that can perceive, act, and learn through real-world interaction. The embodied AI market is witnessing rapid growth driven by advancements in multimodal learning, robotics hardware, and edge AI processing that enable machines to perform complex, human-like tasks. Increasing adoption across sectors such as manufacturing, healthcare, logistics, and defense is accelerating investment and commercialization of embodied intelligence solutions worldwide.
KEY TAKEAWAYS
- The North America embodied AI market accounted for a 36.9% revenue share in 2024.
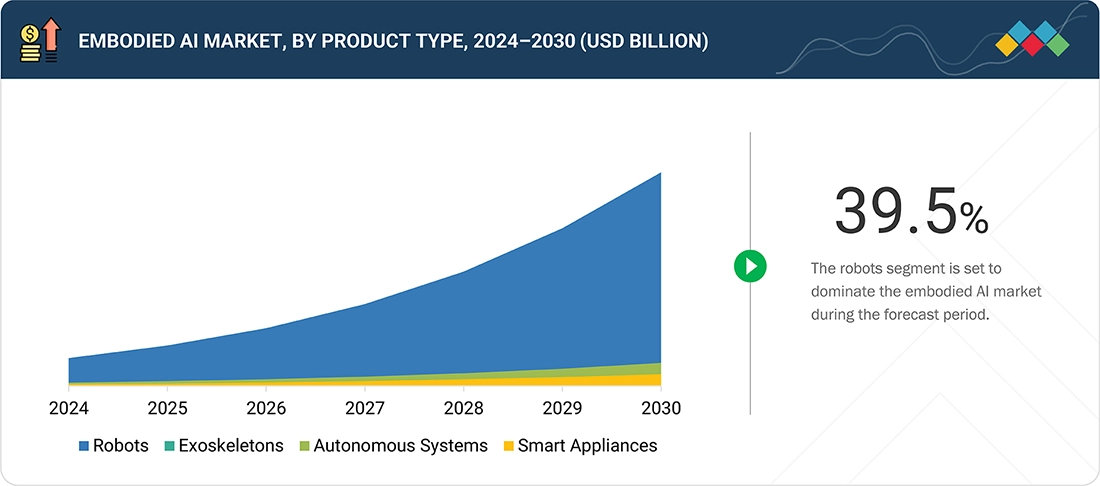
- By product type, the robots segment is expected to register the highest CAGR of 39.5%.
- By level of embodiment, the level 3: advanced embodiment segment is expected to dominate the market.
- By vertical, the logistics and supply chain segment is projected to grow at the fastest rate from 2025 to 2030.
- SoftBank Robotics Group, ABB, TOYOTA MOTOR CORPORATION were identified as some of the star players in the embodied AI market, given their strong market share and product footprint.
- ROBOTIS Co., Ltd., Agility Robotics, and Hanson Robotics Ltd. have distinguished themselves among startups and SMEs by securing strong footholds in specialized niche areas, underscoring their potential as emerging market leaders
The embodied AI market is experiencing robust growth, driven by advancements in robotics, machine learning, and sensor technologies that enhance the capabilities of autonomous systems across various industries. This expansion is particularly notable in sectors like healthcare, where robotic assistance and diagnostics are revolutionizing patient care, and in logistics, with the rise of autonomous delivery systems. With the market expected to grow steadily through the decade, innovations in Level 3 embodiment and human-robot collaboration are set to further propel this expansion.
TRENDS & DISRUPTIONS IMPACTING CUSTOMERS' CUSTOMERS
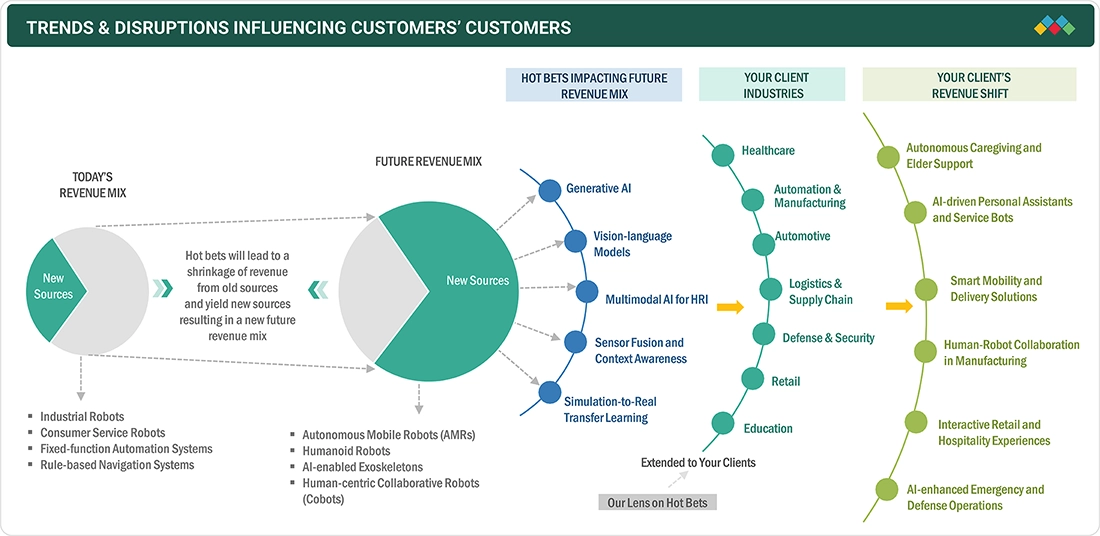
The embodied AI market is experiencing a transformative shift, driven by emerging technologies and evolving customer expectations across key industries. Traditional revenue sources such as industrial robots, fixed-function automation systems, and rule-based navigation are being replaced by next-generation platforms like autonomous mobile robots (AMRs), humanoid robots, AI-enabled exoskeletons, and collaborative robots (cobots). Disruptive trends such as generative AI, vision-language models, and multimodal AI for human-robot interaction (HRI) are reshaping the capabilities of intelligent machines.
Source: Secondary Research, Interviews with Experts, MarketsandMarkets Analysis
MARKET DYNAMICS
Level
-
Advancements in robotics and AI integration to enhance machine autonomy

-
Increasing demand for human-robot interaction

Level
-
Ethical dilemmas in human-robot interactions

-
Privacy concerns in public and private environments

Level
-
Expanding embodied AI applications in healthcare and elderly care

-
Transforming industrial automation with embodied AI and collaborative robots

Level
-
Data scarcity in collecting real-world training sets

-
Fragmentation in standardized platforms and protocols

Source: Secondary Research, Interviews with Experts, MarketsandMarkets Analysis
Driver: Advancements in robotics and AI integration to enhance machine autonomy
Integration of AI with robotics is transforming how machines function, enabling robots to handle complex tasks with minimal human input. AI algorithms like deep learning and reinforcement learning help robots process large amounts of data, understand diverse environments, and make real-time decisions. This change impacts industries by allowing robots to respond to unpredictable situations, optimize workflows, and perform tasks accurately.
Restraint: Ethical dilemmas in human-robot interactions
One of the main barriers to the widespread use of embodied AI technologies is growing concern about ethical issues in human-robot interactions. As embodied AI systems, such as social robots, healthcare assistants, and autonomous vehicles, begin to operate near humans and make decisions that impact human lives, questions about consent, autonomy, fairness, and trust become more complex. Embodied AI systems often lack full transparency in their decision-making processes, which reduces accountability in high-stakes situations like law enforcement or healthcare.
Opportunity: Expanding embodied AI applications in healthcare and elderly care
The healthcare and elderly care sectors are becoming key growth areas for the embodied AI market. With a global shortage of healthcare workers and an increasing elderly population, there is growing demand for AI-powered robots to support patient care. AI-enabled robots can help with tasks such as patient monitoring, medication reminders, movement assistance, and emotional support.
Challenge: Data scarcity in collecting real-world training sets
The lack of high-quality, diverse real-world data needed to train reliable AI systems is a significant obstacle for the embodied AI market. Embodied AI relies on data from real-world interactions, which depend on how a robot moves, senses, and responds in changing physical environments. Gathering such data is costly and time-consuming because it involves testing robots to collect sensor data and monitor actions in many conditions.
Embodied AI Market: COMMERCIAL USE CASES ACROSS INDUSTRIES
| COMPANY | USE CASE DESCRIPTION | BENEFITS |
|---|---|---|
 |
Developed an AI-driven collaborative robotics solution to automate infotainment system testing in Fiat 500 electric vehicles using the Racer5 COBOT mounted on an NJ-220 robot and MI.RA/Dexter software | 3× faster debugging process, consistent quality control, enhanced traceability and repeatability, reduced programming costs, and simplified operation without robotics expertise |
 |
Implemented an AI + 3D vision system using Mech-Eye PRO S camera, Mech-Vision, Mech-Viz, and Mech-DLK software integrated with a UR5e robot for halogen leak detection in air conditioner production | 100% detection accuracy, <4-second vision processing for four welding points, optimized cycle time with collision avoidance, increased productivity and safety, and reduced costs and downtime |
 |
Introduced the WILL mini welding cell featuring Panasonic’s TAWERS system and Genius WeldPro AI software for automated welding, enabling CAD-based weld path generation and offline DTPS programming | Reduced programming time, improved weld consistency and quality, enhanced flexibility for small batches, higher operational efficiency, and expanded market reach in transport manufacturing |
Logos and trademarks shown above are the property of their respective owners. Their use here is for informational and illustrative purposes only.
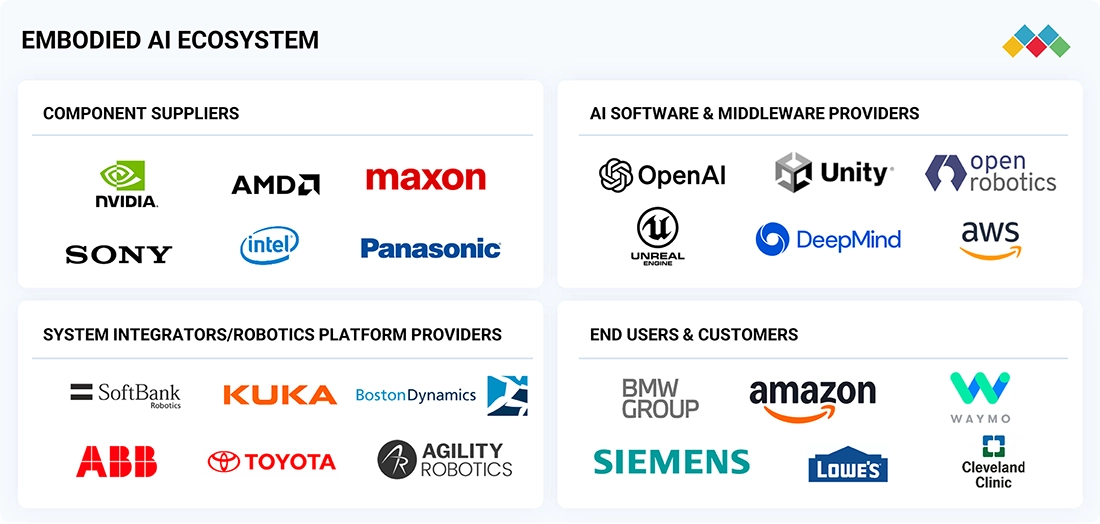
MARKET ECOSYSTEM
Companies in the market offer embodied AI suitable for various verticals, such as healthcare, industrial automation, automotive, logistics and supply chain, retail, defense and security, and education. Prominent embodied AI providers include SoftBank Robotics Group (Japan), ABB (Switzerland), TOYOTA MOTOR CORPORATION (Japan), KUKA AG (Germany), and Boston Dynamics (US).
Logos and trademarks shown above are the property of their respective owners. Their use here is for informational and illustrative purposes only.
MARKET SEGMENTS
Source: Secondary Research, Interviews with Experts, MarketsandMarkets Analysis
Embodied AI Market, by Product Type
The robots segment is expected to dominate the Embodied AI market during the forecast period, driven by rapid advancements in humanoid, service, and collaborative robotic systems. Increasing integration of embodied intelligence into industrial robots, mobile manipulators, and autonomous service units is enhancing adaptability and human-robot interaction across industries. The demand for robots that can perceive, learn, and act in unstructured environments is accelerating adoption in sectors such as manufacturing, logistics, and healthcare.
Embodied AI Market, by Level of Embodiment
The Level 3 (Advanced Embodiment) segment is projected to register the highest growth rate, supported by breakthroughs in multimodal learning, reinforcement learning, and large language model integration with robotics. These systems demonstrate complex reasoning, situational awareness, and adaptive interaction, enabling autonomous decision-making in dynamic environments. Increasing R&D investments from leading robotics firms and AI labs are propelling the development of embodied agents capable of contextual understanding and long-horizon task execution.
Embodied AI Market, by Vertical
The healthcare sector is estimated to be the largest segment in the embodied AI market, owing to the growing use of intelligent robotic systems for surgery, rehabilitation, diagnostics, and patient assistance. Embodied AI enables higher precision, consistency, and safety in medical procedures, while reducing strain on healthcare professionals. Rehabilitation robots and assistive systems are transforming post-surgical recovery and elderly care, particularly in aging populations.
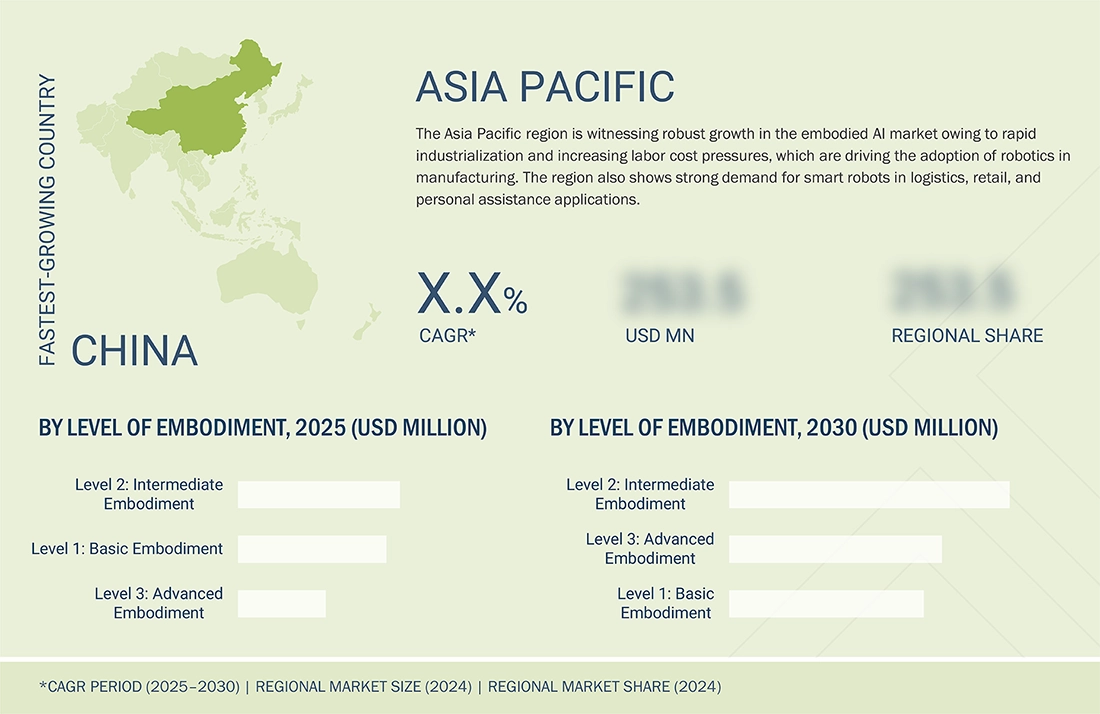
REGION
Asia Pacific to be the fastest-growing region in the global embodied AI market during the forecast period
The Asia Pacific region is projected to witness the fastest growth in the embodied AI market, driven by strong government initiatives, manufacturing automation, and rapid robotics adoption in countries such as China, Japan, and South Korea. The region’s expanding industrial base, coupled with increasing investment in humanoid and service robot development, positions it as a global hub for embodied intelligence innovation. Rising R&D expenditure, domestic robotics startups, and integration of AI-enabled systems in healthcare and logistics are further accelerating market expansion.
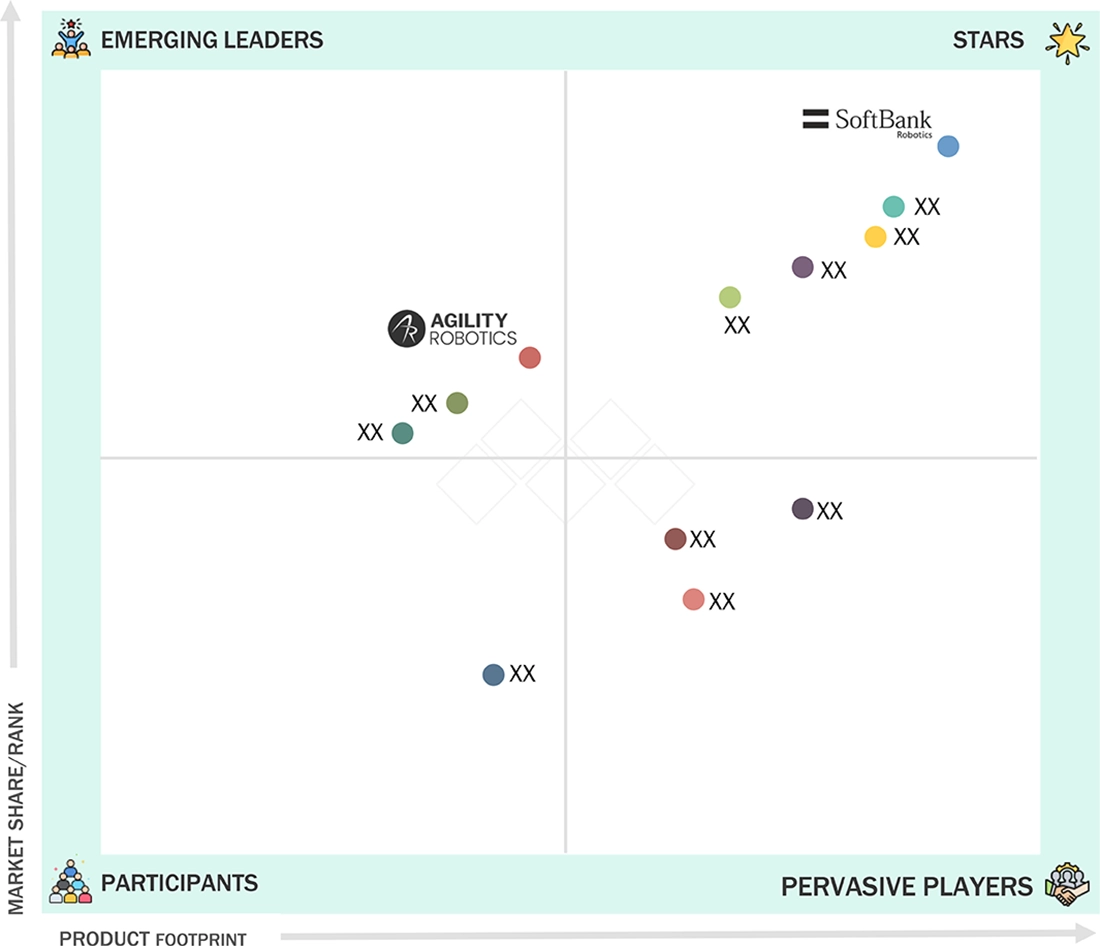
Embodied AI Market: COMPANY EVALUATION MATRIX
The company evaluation matrix for the embodied AI market highlights the positioning of key players based on their technological innovation, embodiment sophistication, and market expansion strategies. In the embodied AI market matrix, SoftBank Robotics leads with its extensive portfolio of humanoid and service robots, advanced human–robot interaction capabilities, and global presence across commercial and social applications. Agility Robotics, on the other hand, is rapidly gaining momentum with its cutting-edge bipedal robot Digit, designed for logistics and warehouse automation.
Source: Secondary Research, Interviews with Experts, MarketsandMarkets Analysis
KEY MARKET PLAYERS
MARKET SCOPE
| REPORT METRIC | DETAILS |
|---|---|
| Market Size, 2024 (Value) | USD 3.06 Billion |
| Market Forecast, 2030 (Value) | USD 23.06 Billion |
| Growth Rate | CAGR of 39.0% from 2025 to 2030 |
| Years Considered | 2021–2030 |
| Base Year | 2024 |
| Forecast Period | 2025–2030 |
| Units Considered | Value (USD Million/Billion), Volume (Thousand Units) |
| Report Coverage | Revenue Forecast, Company Ranking, Competitive Landscape, Growth Factors, and Trends |
| Segments Covered |
|
| Regional Scope | North America, Europe, Asia Pacific, Rest of the World (RoW) |
WHAT IS IN IT FOR YOU: Embodied AI Market REPORT CONTENT GUIDE
DELIVERED CUSTOMIZATIONS
We have successfully delivered the following deep-dive customizations:
| CLIENT REQUEST | CUSTOMIZATION DELIVERED | VALUE ADDS |
|---|---|---|
| Local Competitive Landscape | Profiles of key regional players in embodied AI, including market share, revenue, product portfolios, and strategic initiatives in robotics and autonomous systems | Facilitated competitive benchmarking and informed strategy development |
| Regional Market Entry Strategy | Country- or region-specific go-to-market strategies including barriers, regulations, and competitive landscape for humanoid and service robots | Minimized entry risk and accelerates market adoption |
| Local Risk & Opportunity Assessment | Identification of regional risks, barriers, and untapped opportunities by market or sector in embodied AI applications | Enabled proactive risk mitigation and strategic investments |
| Technology Adoption by Region | Insights on local adoption of key embodiment levels (basic, intermediate, advanced) and AI integration technologies | Guided R&D, product positioning, and investment decisions |
| Vertical-Specific Customization Strategies | Tailored analyses for sectors like healthcare and logistics, covering embodied AI use cases, integration challenges, and scalability | Enhanced sector-specific innovation and deployment efficiency |
RECENT DEVELOPMENTS
- May 2025 : Boston Dynamics (US) and DHL Group (Germany) signed a strategic MOU to globally deploy over 1,000 additional Stretch robots, following successful initial use in automating container unloading. The partnership also aims to expand robot applications to new use cases like case picking.
- April 2025 : Agility Robotics (US) enhanced its humanoid robot Digit, which was unveiled at the ProMat industry event. Developed with customer input, the upgrades include longer-lasting batteries with up to four hours of runtime, autonomous charging, improved manufacturing efficiency, and enhanced safety features such as a Category 1 stop and wireless E-stop systems.
- April 2025 : KUKA AG (Germany), through its KUKA Digital business division, partnered with Noux Node (Finland) to integrate Noux Node’s DevOps and AI-driven software capabilities into its automation ecosystem. This collaboration was expected to allow joint customers to effectively manage data, deploy software updates, and improve system performance in real production environments.
- January 2025 : SoftBank Robotics Australia (Australia) formed a strategic partnership with McLaren International Pty Ltd (Australia), a hospitality technology provider in the Asia Pacific region, to enhance facility management in the Australian hospitality sector through robotics and AI automation. This partnership focused on driving innovation and improving guest experiences by integrating SoftBank’s advanced cleaning robots, such as Whiz, Phantas, and Scrubber 50 Pro, into hospitality operations, delivering high-performance, reliable cleaning solutions tailored to industry standards.
- April 2024 : Boston Dynamics (US) unveiled the electric version of its Atlas humanoid robot, marking a major advancement in its robotics lineup. The new Atlas is stronger and more flexible than previous hydraulic versions, with enhanced motion capabilities and new gripper designs to handle diverse manipulation tasks in real-world industrial environments.
Table of Contents
 Exclusive indicates content/data unique to MarketsandMarkets and not available with any competitors.
Methodology
The study involved four major activities in estimating the current size of the embodied AI market. Exhaustive secondary research collected information on the market, peer, and parent markets. The next step was to validate these findings, assumptions, and sizing with industry experts across the value chain through primary research. Both top-down and bottom-up approaches were employed to estimate the complete market size. After that, market breakdown and data triangulation techniques were used to estimate the market size of segments and subsegments.
Secondary Research
The secondary research process has referred to various secondary sources to identify and collect necessary information for this study.
The secondary sources include annual reports, press releases, and investor presentations of companies; white papers; journals and certified publications; and articles from recognized authors, websites, directories, and databases. Secondary research was conducted to obtain critical information about the industry’s supply chain, the market’s value chain, the total pool of key players, market segmentation according to the industry trends (to the bottom-most level), regional markets, and key developments from market- and technology-oriented perspectives. The secondary data was collected and analyzed to determine the overall market size, further validated by primary research.
Primary Research
Extensive primary research was conducted after gaining knowledge about the current scenario of the embodied AI market through secondary research. Several primary interviews were conducted with experts from the demand and supply sides across four major regions: North America, Europe, the Asia Pacific, and the RoW. This primary data was collected through questionnaires, emails, and telephone interviews.

Note: Other designations include technology heads, media analysts, sales managers, marketing managers, and product managers.
The three tiers of the companies are based on their total revenues as of 2024 ? Tier 1: >USD 1 billion, Tier 2: USD 500 million–1 billion, and Tier 3: USD 500 million.
To know about the assumptions considered for the study, download the pdf brochure
Market Size Estimation
In the complete market engineering process, top-down and bottom-up approaches and several data triangulation methods were used to estimate and forecast the overall market segments and subsegments listed in this report. Key players in the market were identified through secondary research, and their market shares in the respective regions were determined through primary and secondary research. This entire procedure includes the study of annual and financial reports of the top market players and extensive interviews for key insights (quantitative and qualitative) with industry experts (CEOs, VPs, directors, and marketing executives).
All percentage shares, splits, and breakdowns were determined using secondary sources and verified through primary sources. All the parameters affecting the markets covered in this research study were accounted for, viewed in detail, verified through primary research, and analyzed to obtain the final quantitative and qualitative data. This data was consolidated and supplemented with detailed inputs and analysis from MarketsandMarkets and presented in this report.
Bottom-Up Approach
- Identifying key countries contributing to the majority share of the embodied AI market in the region
- Analyzing major manufacturers of embodied AI, studying their portfolios, and understanding different types
- Analyzing trends pertaining to the use of embodied AI in different kinds of verticals
- Identifying and evaluating percentage splits by vertical for each region
- Evaluating the spending on embodied AI offerings for each segment
- Tracking the ongoing and upcoming developments in the market, such as investments, R&D activities, product/service launches, collaborations, and partnerships, and forecasting the market based on these developments and other critical parameters
- Carrying out multiple discussions with key opinion leaders to understand different types of embodied AI trends in the market, thereby analyzing the breakup of the scope of work carried out by major companies
- All estimates at each stage were confirmed through discussions with key opinion leaders, including corporate executives (CXOs), directors, sales heads, and industry experts from MarketsandMarkets.
- Arriving at the market estimates by analyzing the revenues of companies generated and then combining them to get the market estimate
- Segmenting the overall market into various other market segments
- Verifying and cross-checking the estimate at every level, from discussions with key opinion leaders such as CXOs, directors, and operations managers, and finally with the domain experts at MarketsandMarkets
- Studying various paid and unpaid sources of information, such as annual reports, press releases, white papers, and databases
Top-Down Approach
- Focusing initially on the top-line investments and expenditures being made in the ecosystem of the embodied AI market, further splitting the key market areas based on product type, level of embodiment, vertical, and region, and listing the key developments
- Identifying all leading players in the embodied AI market based on product type, level of embodiment, and vertical through secondary research and fully verifying them through a brief discussion with industry experts
- Identifying the product offerings of each player and their contribution toward the embodied AI market
- Understanding the company’s business units offering embodied AI products considered under the study
- Aggregating companies’ revenue and extrapolating to the global embodied AI market size (USD Million)
- Discussing splits with industry experts to validate the information and identify key growth pockets across all key segments.
Embodied AI Market : Top-Down and Bottom-Up Approach

Data Triangulation
After arriving at the overall market size, the market was split into several segments and subsegments using the market size estimation processes explained above. Data triangulation and market breakdown procedures were employed to complete the entire market engineering process and determine the exact statistics of each market segment and subsegment. The data was triangulated by studying various factors and trends from the demand and supply sides in the embodied AI market.
Market Definition
Embodied AI is a segment of artificial intelligence where intelligent systems are embedded in physical entities, such as robots, autonomous vehicles, or assistive machines, allowing them to perform context-aware tasks through real-world interaction. The embodied AI market encompasses various product types, such as humanoid, mobile, industrial, service, and collaborative robots (cobots), exoskeletons, autonomous systems (including drones, vehicles, and AGVs), and smart appliances. These systems are categorized across three levels of embodiment based on their cognitive and interactive complexity, from basic rule-based machines to highly adaptive agents capable of complex reasoning and multi-modal interaction.
Key Stakeholders
- Government bodies and policymakers
- Industry organizations, forums, alliances, and associations
- Market research and consulting firms
- Raw material suppliers and distributors
- Research institutes and organizations
- Traders and suppliers
- Raw material suppliers
- Original equipment manufacturers (OEMS)
- OEM technology solution providers
- Technology, service, and solution providers
- Intellectual property (IP) core and licensing providers
- Suppliers and distributors
- Forums, alliances, and associations
- Technology investors
- Research institutes and organizations
- Analysts and strategic business planners
- Market research and consulting firms
Report Objectives
- To describe and forecast the embodied AI market by product type, level of embodiment, vertical, and region
- To forecast the embodied AI market by product type in terms of volume
- To provide the market size estimation for North America, Europe, the Asia Pacific, and the Rest of the World (RoW), along with their respective country-level market sizes, in terms of value
- To provide detailed information regarding drivers, restraints, opportunities, and challenges influencing market growth
- To analyze the value chain, ecosystem, case studies, patent scenario, trade scenario, technologies, and pricing; identify key conferences and events; study key stakeholders & buying criteria; conduct Porter’s Five Forces analysis on the market; determine the investment & funding scenario; study regulations affecting the market: and explore the impact of the 2025 US tariffs on embodied AI
- To strategically analyze micromarkets with regard to individual growth trends, prospects, and contributions to the total market
- To analyze opportunities for stakeholders by identifying high-growth segments of the market
- To strategically profile the key players, comprehensively analyze their market positions in terms of ranking and core competencies2, and provide a competitive market landscape
- To analyze strategic approaches, such as product launches, expansions, and partnerships, in the embodied AI market
- To analyze the impact of the macroeconomic outlook for each region
Available customizations:
With the given market data, MarketsandMarkets offers customizations according to the specific requirements of companies. The following customization options are available for the report:
Regional Analysis:
- Further country-wise breakdown for the embodied AI market
- Further breakdown of the embodied AI market in industry-specific segments
Company Information:
- Detailed analysis and profiling of additional market players (up to five)
Key Questions Addressed by the Report
Which are the major companies in the embodied AI market?
Major companies in the embodied AI market are SoftBank Robotics Group (Japan), ABB (Switzerland), TOYOTA MOTOR CORPORATION (Japan), KUKA AG (Germany), and Boston Dynamics (US).
Which end users in the embodied AI market are likely to exhibit a higher CAGR during the forecast period?
The logistics, supply chain, and healthcare verticals are expected to witness a higher CAGR due to increasing demand for automation, efficiency, and intelligent assistance.
Which robots in the embodied AI market will likely drive growth over the coming years?
Humanoid and mobile robots will likely drive market growth for embodied AI due to their versatility, mobility, and ability to interact naturally in human environments. Humanoid robots excel in customer service, healthcare, and education, and mobile robots enable dynamic navigation and task execution in logistics, manufacturing, and retail.
What are the drivers of and opportunities in the embodied AI market?
Advancing robotics and AI integration to enhance machine autonomy, driving adoption through increased demand for human-robot interaction (HRI), expanding embodied AI applications in healthcare and elderly care, and transforming industrial automation with embodied AI and collaborative robots are the major drivers and opportunities for the embodied AI market.
What are the restraints and challenges for the players in the embodied AI market?
Ethical dilemmas in human-robot interactions, privacy concerns in public and private environments, and data scarcity for real-world training are the key challenges faced by the market players.
Need a Tailored Report?
Customize this report to your needs
Get 10% FREE Customization
Customize This ReportPersonalize This Research
- Triangulate with your Own Data
- Get Data as per your Format and Definition
- Gain a Deeper Dive on a Specific Application, Geography, Customer or Competitor
- Any level of Personalization
Let Us Help You
- What are the Known and Unknown Adjacencies Impacting the Embodied AI Market
- What will your New Revenue Sources be?
- Who will be your Top Customer; what will make them switch?
- Defend your Market Share or Win Competitors
- Get a Scorecard for Target Partners

Custom Market Research Services
We Will Customise The Research For You, In Case The Report Listed Above Does Not Meet With Your Requirements
Get 10% Free Customisation


Growth opportunities and latent adjacency in Embodied AI Market