Electrophoresis Reagents Market by Product (Dyes (EtBr & SYBR) Gels (Polyacrylamide, Starch, & Agarose) Buffer (TBE & TAE)) by Application (Protein Analysis, DNA & RNA Analysis) by Technique (Gel & Capillary Electrophoresis) - Global Forecast to 2020


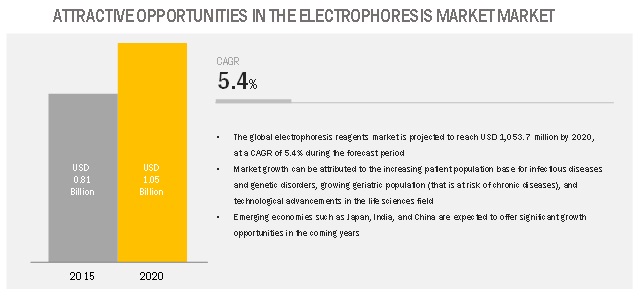
The global electrophoresis reagents market is projected to grow at a CAGR of 5.4%. Substantial growth and rapid technological advancement was experienced by the electrophoresis market in the past few years which had had a positive impact on the overall growth of the electrophoresis reagents market. The market has witnessed new transforming and innovative applications of the electrophoresis reagents market. The global electrophoresis reagents market is mainly driven by technological advancement; rapidly increasing geriatric population; increasing funding for genomics and proteomics research. However, time consuming operations and limited sample analysis through gel electrophoresis and presence of alternative technologies offering better efficiencies and results are restraining the growth of this market to a certain extent.
By product, gels segment is expected to be the largest contributor in the electrophoresis reagents market during the forecast period.
The report analyzes the global electrophoresis reagents market by product, application, technique, end user, and region. On the basis of product, the gels segment accounted for the largest share in 2015, owing to the increasing application of gels in protein analysis and DNA & RNA analysis.
Protein analysis segment is expected to dominate the electrophoresis reagents market through forecast period
Based on application, the electrophoresis reagents market is categorized into protein analysis and DNA & RNA analysis. In 2015, the protein analysis segment accounted for the largest share of this market. The growth in this segment is primarily driven by the rising focus on proteomics research by pharmaceutical and biotechnology companies.
Academic & research institutions end user segment to contribute the largest share during forecast period
Based on end user, the global electrophoresis reagents market is divided into academic & research institutes, pharmaceutical & biotechnology companies, hospitals & diagnostic laboratories, and others. Academic & research institutes form the largest end-user segment in 2015. The large share of this segment is mainly due to factors, such as rising R&D expenditure, large investments in emerging markets sucha as China and India, and wide application of electrophoresis reagents in academic and research institutions.
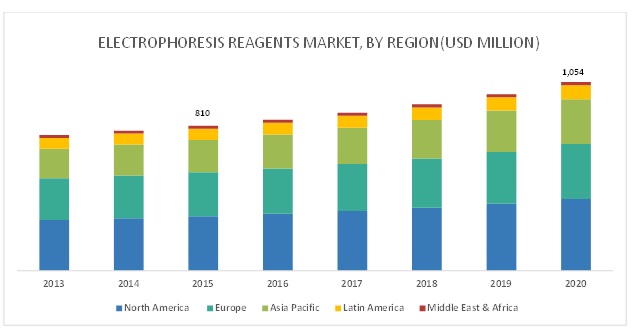
North America is expected to account for the largest share of electrophoresis reagents market during the forecast period
The global electrophoresis reagents market is divided into four major regions-North America, Europe, Asia- Pacific, and the Rest of the World (RoW). North America accounted for the largest share of global electrophoresis reagents market in 2015. North America has been among the frontrunners in terms of drug discovery research and the utilization of advanced diagnostics technologies. An increasing number of proteomic and genomic research projects in the U.S. and Canada and stringent regulatory requirements for the pharmaceutical sector in these countries are some of the major factors accounting for the greater demand for electrophoresis technologies and related consumables in North American region.
The prominent players in the global electrophoresis reagents market are Thermo Fisher Scientific (U.S.), Sigma-Aldrich Corporation (U.S.), Bio-Rad Laboratories, Inc. (U.S.), Lonza Group (Switzerland), QIAGEN N.V. (Netherlands), Merck Millipore (US), GE Healthcare (US), Agilent Technologies, Inc. (US), Lonza Group AG (Switzerland), Takara Bio, Inc. (Japan), Harvard Bioscience, Inc. (US), and Sebia Group (France)
Thermo Fisher Scientific, Inc. (U.S.) accounted for the largest share of the global electrophoresis reagents market in 2014. The company develops, manufactures, and provides analytical instruments, equipment, reagents & consumables, and software & services for research, manufacturing, analysis, discovery, and diagnostics. The company serves more than 400,000 customers, and has operations in 50 countries, including the U.S., Germany, the U.K., and China. Thermo Fisher Scientific primarily focuses on expansion and acquisition. Some of its prominent acquisitions in this market are Life Technologies (U.S.) in February 2014 and Alfa Aesar (U.S.) in September 2015. Moreover, the company has a large global network of resellers and distributors, in addition to an international network of warehouses, specialized product vaults, and warehouse management systems, which maintain inventory and coordinate product delivery. In addition, it has 12,600 sales and service personnel, including more than 1,000 highly skilled technical specialists who focus on meeting the technical needs of end users. The company is focusing on expanding its presence in the emerging markets of the Asia-Pacific region through heavy investments. In June 2013, the company invested USD 20 million to open a new factory in Suzhou (China) for the development of laboratory consumables and equipment.
|
Report Metric |
Details |
|
Market size available for years |
2016-2023 |
|
Base year considered |
2017 |
|
Forecast period |
2018-2023 |
|
Forecast units |
Value (USD) |
|
Segments covered |
Product, Application, Technique, End User, and Region |
|
Geographies covered |
North America, Europe, Asia Pacific, Latin America, and Middle East & Africa |
|
Companies covered |
Thermo Fisher Scientific (U.S.), Sigma-Aldrich Corporation (U.S.), Bio-Rad Laboratories, Inc. (U.S.), Lonza Group (Switzerland), QIAGEN N.V. (Netherlands), Merck Millipore (US), GE Healthcare (US), Agilent Technologies, Inc. (US), Lonza Group AG (Switzerland), Takara Bio, Inc. (Japan), Harvard Bioscience, Inc. (US), and Sebia Group (France) |
Electrophoresis Reagents Market
This research report categorizes the electrophoresis reagents market into the following segments:
-
Global Electrophoresis Reagents Market, by Techniques
- Gel Electrophoresis
- Capillary Electrophoresis
-
Global Electrophoresis Reagents Market, by Products
- Dyes
-
- EtBr
- SYBR
- Other Dyes
-
Gels
- Polyacrylamide Gels
- Agarose Gel
- Starch Gel
-
Buffers
- TBE Buffers
- TAE Buffers
- Other Buffers
- Other Reagents
-
Global Electrophoresis Reagents Market, by End Users
- Academic & Research Institutions
- Pharmaceutical & Biotech Companies
- Hospitals & Diagnostic Centers
- Other End Users
-
Global Electrophoresis Reagents Market, by Application
- Protein Analysis
- DNA & RNA Analysis
-
Global Electrophoresis Reagents Market, by Geography
- North America
-
-
- U.S.
- Canada
-
-
Europe
-
- Germany
- France
- U.K.
- Italy
- Spain
- Rest of Europe (RoE)
-
-
Asia-pacific (APAC)
-
- China
- Japan
- India
- Rest of APAC
-
-
Rest of the World (RoW)
-
- Latin America
- Middle East & Africa
-
Available Customizations
With the given market data, MarketsandMarkets offers customizations as per the company’s specific needs. The following customization options are available for the report:
Product Analysis
- Product matrix, which gives a detailed comparison of the product portfolios of each company
Geographic Analysis
- Further breakdown of the Rest of Asia-Pacific optical imaging market into South Korea, Australia, New Zealand, and others
- Further breakdown of the Latin American optical imaging market into Brazil, Argentina, and the Rest of Latin America
Company Information
- Detailed analysis and profiling of additional market players (up to 5)
Recent Developments
- In 2015, Merck Millipore (U.S.) completed the acquisition of Sigma-Aldrich (U.S.)
- In 2015, Agilent Technologies Inc. (U.S.) acquired Seahorse Bioscience (U.S.).
- In 2015, Bio-Rad Laboratories, Inc. (U.S.) launched the IH-500, a fully automated random access system, for blood typing and screening.
- In 2015, Agilent Technologies Inc. (U.S.) launched updated SurePrint gene expression microarrays for messenger RNA profiling applications for human, mouse, and rat models.
- In 2015, Thermo Fisher Scientific (U.S.) opened a state-of-the-art GMP Clinical Services Facility in Singapore. This new facility intensified the company’s supply capabilities in the Asia-Pacific market.
Key question addressed by the report
- Who are the top 10 players operating electrophoresis reagents market?
- What are the driving factors, restraints, opportunities, and challenges in electrophoresis reagents market?
- What are the industry trends and current scenario of the electrophoresis reagents market?
- What are the growth trends in electrophoresis reagents market at segmental and overall market levels?
To speak to our analyst for a discussion on the above findings, click Speak to Analyst
 Exclusive indicates content/data unique to MarketsandMarkets and not available with any competitors.
Table of Contents
1 Electrophoresis Reagents Market: Introduction (Page No. - 20)
1.1 Objectives of the Study
1.2 Market Definition
1.3 Market Scope
1.3.1 Markets Covered
1.3.2 Years Considered for the Study
1.4 Currency
1.5 Stakeholders
2 Electrophoresis Reagents Market: Research Methodology (Page No. - 23)
2.1 Research Data
2.1.1 Secondary Sources
2.1.1.1 Key Data From Secondary Sources
2.1.2 Primary Sources
2.1.2.1 Key Data From Primary Sources
2.1.2.2 Key Industry Insights
2.2 Market Size Estimation
2.3 Market Breakdown and Data Triangulation
2.4 Market Share Estimation
2.5 Assumption for the Study
2.6 Factor Analysis
2.6.1 Introduction
2.6.2 Demand-Side Analysis
2.6.2.1 Healthcare Expenditure Patterns
2.6.2.2 Rapid Growth of Aging Population
2.6.2.3 Incidence and Prevalence of Cancer
2.6.2.4 Burden of Infectious Diseases
2.6.2.5 Number of Clinical, Forensic, and Research Laboratories
2.6.3 Supply-Side Analysis
2.6.3.1 Number of New Product Launches: Electrophoresis Reagents vs Competitive Technologies
2.6.3.2 Parent Market Analysis: Electrophoresis Market
3 Electrophoresis Reagents Market: Executive Summary (Page No. - 41)
4 Electrophoresis Reagents Market: Premium Insights (Page No. - 47)
4.1 Market Overview
4.2 Market: Regional Mix
4.3 Geographical Snapshot of the Market
4.4 Asia-Pacific: Market, By Product
5 Electrophoresis Reagents Market: Overview (Page No. - 51)
5.1 Introduction
5.2 Market Segmentation
5.3 Market Dynamics
5.3.1 Market Drivers
5.3.1.1 Rising Incidences of Cancer, Infectious Diseases, and Genetic Disorders
5.3.1.2 Increasing Funding for Genomic and Proteomic Research
5.3.1.3 Growing Number of Industry–Academic Research Collaborations
5.3.1.4 Rapidly Increasing Geriatric Population
5.3.1.5 Technological Advancements
5.3.2 Key Market Restraints
5.3.2.1 Time-Consuming Operations and Limited Sample Analysis Through Gel Electrophoresis
5.3.2.2 Presence of Alternative Technologies Offering Better Efficiency and Results
5.3.3 Key Market Opportunities
5.3.3.1 Rapid Growth in Emerging Countries
5.3.3.2 Increasing Demand for Personalized Medicine
5.3.3.3 Shift From Plant-Derived to Genome-Based Drug Discovery
5.3.4 Key Market Challenges
5.3.4.1 Safety Concerns Associated With Mutagenic Nucleic Acid Dyes
6 Electrophoresis Reagents Market: Industry Insights (Page No. - 61)
6.1 Introduction
6.2 Value Chain Analysis
6.3 Industry Trends
6.3.1 Increasing Adoption of Capillary Electrophoresis
6.3.2 Growing Consolidation of the Life Science Reagents Market
6.4 Stakeholder Analysis
7 Global Electrophoresis Reagents Market, By Product (Page No. - 66)
7.1 Introduction
7.1.1 Gels
7.1.1.1 Polyacrylamide Gels
7.1.1.2 Agarose Gels
7.1.1.3 Starch Gels
7.1.2 Dyes
7.1.2.1 Ethidium Bromide (ETBR) Dyes
7.1.2.2 Sybr Dyes
7.1.2.3 Other Dyes
7.1.3 Buffers
7.1.3.2 Tris-Acetate-Edta (TAE) Buffers
7.1.3.3 Other Buffers
7.1.4 Other Electrophoresis Reagents
8 Global Electrophoresis Reagents Market, By Technique (Page No. - 85)
8.1 Introduction
8.2 Gel Electrophoresis
8.3 Capillary Electrophoresis
9 Global Electrophoresis Reagents Market, By Application (Page No. - 90)
9.1 Introduction
9.2 Protein Analysis
9.3 DNA & RNA Analysis
10 Global Electrophoresis Reagents Market, By End User (Page No. - 95)
10.1 Introduction
10.2 Academic & Research Institutions
10.3 Pharmaceutical & Biotechnology Companies
10.4 Hospitals & Diagnostic Laboratories
10.5 Other End Users
11 Global Electrophoresis Reagents Market, By Region (Page No. - 103)
11.1 Introduction
11.2 North America
11.2.1 U.S.
11.2.2 Canada
11.3 Europe
11.3.1 Germany
11.3.2 France
11.3.3 U.K.
11.3.4 Italy
11.3.5 Spain
11.3.6 Rest of Europe
11.4 Asia-Pacific
11.4.1 Japan
11.4.2 China
11.4.3 India
11.4.4 Rest of Asia-Pacific
11.5 Rest of the World (RoW)
11.5.1 Latin America
11.5.2 Middle East and Africa
12 Competitive Landscape (Page No. - 175)
12.1 Overview
12.2 Market Share Analysis
12.3 Competitive Situations and Trends
12.3.1 Agreements, Partnerships, and Collaborations
12.3.2 Acquisition
12.3.3 New Product Launches
12.3.4 Expansion
13 Company Profiles (Page No. - 183)
13.1 Introduction
13.2 Thermo Fisher Scientific
13.3 Sigma-Aldrich Corporation
13.4 Bio-Rad Laboratories, Inc.
13.5 Qiagen N.V.
13.6 Merck Millipore
13.7 GE Healthcare
13.8 Agilent Technologies, Inc.
13.9 Lonza Group, AG
13.10 Takara Bio, Inc.
13.11 Harvard Bioscience, Inc.
13.12 Sebia Group
*Details on Financials, Products & Services, Key Strategy, & Recent Developments Might Not Be Captured in Case of Unlisted Companies.
14 Appendix (Page No. - 216)
14.1 Insights of Industry Experts
14.2 Discussion Guide
14.3 Additional Developments, 2012–2015
14.4 Introducing RT: Real-Time Market Intelligence
14.5 Related Reports
List of Tables (166 Tables)
Table 1 Global Electrophoresis Reagents Market Snapshot
Table 2 Electrophoresis Reagents Major Acquisitions in the Market
Table 3 Global Market Size, By Product, 2013–2020 (USD Million)
Table 4 Global Market Size, By Country, 2013–2020 (USD Million)
Table 5 Global Electrophoresis Gels Market Size, By Type, 2013–2020 (USD Million)
Table 6 Global Electrophoresis Gels Market Size, By Country, 2013–2020 (USD Million)
Table 7 Global Electrophoresis Polyacrylamide Gels Market Size, By Country, 2013–2020 (USD Million)
Table 8 Global Electrophoresis Agarose Gels Market Size, By Country, 2013–2020 (USD Million)
Table 9 Global Electrophoresis Starch Gels Market Size, By Country, 2013–2020 (USD Million)
Table 10 Global Electrophoresis Dyes Market Size, By Type, 2013–2020 (USD Million)
Table 11 Global Electrophoresis Dyes Market Size, By Country, 2013–2020 (USD Million)
Table 12 Global Electrophoresis Etbr Dyes Market Size, By Country, 2013–2020 (USD Million)
Table 13 Global Electrophoresis Sybr Dyes Market Size, By Country, 2013–2020 (USD Million)
Table 14 Global Other Electrophoresis Dyes Market Size, By Country, 2013–2020 (USD Million)
Table 15 Global Electrophoresis Buffers Market Size, By Type, 2013–2020 (USD Million)
Table 16 Global Electrophoresis Buffers Market Size, By Country, 2013–2020 (USD Million)
Table 17 Global Electrophoresis TBE Buffers Market Size, By Country, 2013–2020 (USD Million)
Table 18 Global Electrophoresis TAE Buffers Market Size, By Country, 2013–2020 (USD Million)
Table 19 Global Other Electrophoresis Buffers Market Size, By Country, 2013–2020 (USD Million)
Table 20 Global Other Electrophoresis Reagents Market Size, By Country, 2013–2020 (USD Million)
Table 21 Global Market Size, By Technique, 2013–2020 (USD Million)
Table 22 Global Gel Electrophoresis Reagents Market Size, By Country, 2013–2020 (USD Million)
Table 23 Global Capillary Electrophoresis Reagents Market Size, By Country, 2013–2020 (USD Million)
Table 24 Global Market Size, By Application, 2013–2020 (USD Million)
Table 25 Global Market Size for Protein Analysis, By Country/Region, 2013–2020 (USD Million)
Table 26 Global Market Size for DNA & RNA Analysis, By Country/Region, 2013–2020 (USD Million)
Table 27 Global Market Size, By End User, 2013–2020 (USD Million)
Table 28 Global Market Size for Academic & Research Institutions, By Country/Region, 2013–2020 (USD Million)
Table 29 Global Market Size for Pharmaceutical & Biotechnology Companies, By Country/Region, 2013–2020 (USD Million)
Table 30 Global Market Size for Hospitals & Diagnostic Laboratories, By Country/Region, 2013–2020 (USD Million)
Table 31 Global Market Size for Other End Users, By Country/Region, 2013–2020 (USD Million)
Table 32 North America: Market Size, By Country, 2013–2020 (USD Million)
Table 33 North America: Electrophoresis Reagents Market Size, By Product, 2013–2020 (USD Million)
Table 34 North America: Electrophoresis Gels Market Size, By Product, 013–2020 (USD Million)
Table 35 North America: Electrophoresis Dyes Market Size, By Product, 2013–2020 (USD Million)
Table 36 North America: Electrophoresis Reagents Electrophoresis Buffers Market Size, By Product, 2013–2020 (USD Million)
Table 37 North America: Market Size, By Technique, 2013–2020 (USD Million)
Table 38 North America: Market Size, By Application, 2013–2020 (USD Million)
Table 39 North America: Market Size, By End User, 2013–2020 (USD Million)
Table 40 U.S.: Electrophoresis Reagents Market Size, By Product, 2013–2020 (USD Million)
Table 41 U.S.: Electrophoresis Gels Market Size, By Product, 2013–2020 (USD Million)
Table 42 U.S.: Electrophoresis Dyes Market Size, By Product, 2013–2020 (USD Million)
Table 43 U.S.: Electrophoresis Buffers Market Size, By Product, 2013–2020 (USD Million)
Table 44 U.S.: Market Size, By Technique, 2013–2020 (USD Million)
Table 45 U.S.: Market Size, By Application, 2013–2020 (USD Million)
Table 46 U.S.: Market Size, By End User, 2013–2020 (USD Million)
Table 47 Canada: Electrophoresis Reagents Market Size, By Product, 2013–2020 (USD Million)
Table 48 Canada: Electrophoresis Gels Market Size, By Product, 2013–2020 (USD Million)
Table 49 Canada: Electrophoresis Dyes Market Size, By Product, 2013–2020 (USD Million)
Table 50 Canada: Electrophoresis Buffers Market Size, By Product, 2013–2020 (USD Million)
Table 51 Canada: Market Size, By Technique, 2013–2020 (USD Million)
Table 52 Canada: Electrophoresis Reagents Market Size, By Application, 2013–2020 (USD Million)
Table 53 Canada: Market Size, By End User, 2013–2020 (USD Million)
Table 54 Europe: Market Size, By Country, 2013–2020 (USD Million)
Table 55 Europe: Electrophoresis Reagents Market Size, By Product, 2013–2020 (USD Million)
Table 56 Europe: Electrophoresis Gels Market Size, By Product, 2013–2020 (USD Million)
Table 57 Europe: Electrophoresis Dyes Market Size, By Product, 2013–2020 (USD Million)
Table 58 Europe: Electrophoresis Buffers Market Size, By Product, 2013–2020 (USD Million)
Table 59 Europe: Market Size, By Technique, 2013–2020 (USD Million)
Table 60 Europe: Market Size, By Application, 2013–2020 (USD Million)
Table 61 Europe: Market Size, By End User, 2013–2020 (USD Million)
Table 62 Germany: Electrophoresis Reagents Market Size, By Product, 2013–2020 (USD Million)
Table 63 Germany: Electrophoresis Gels Market Size, By Product, 2013–2020 (USD Million)
Table 64 Germany: Electrophoresis Dyes Market Size, By Product, 2013–2020 (USD Million)
Table 65 Germany: Electrophoresis Buffers Market Size, By Product, 2013–2020 (USD Million)
Table 66 Germany: Market Size, By Technique, 2013–2020 (USD Million)
Table 67 Germany: Market Size, By Application, 2013–2020 (USD Million)
Table 68 Germany: Market Size, By End User, 2013–2020 (USD Million)
Table 69 France: Electrophoresis Reagents Market Size, By Product, 2013–2020 (USD Million)
Table 70 France: Electrophoresis Gels Market Size, By Product, 2013–2020 (USD Million)
Table 71 France: Electrophoresis Dyes Market Size, By Product, 2013–2020 (USD Million)
Table 72 France: Electrophoresis Buffers Market Size, By Product, 2013–2020 (USD Million)
Table 73 France: Market Size, By Technique, 2013–2020 (USD Million)
Table 74 France: Market Size, By Application, 2013–2020 (USD Million)
Table 75 France: Market Size, By End User, 2013–2020 (USD Million)
Table 76 U.K.: Market Size, By Product, 2013–2020 (USD Million)
Table 77 U.K.: Electrophoresis Gels Market Size, By Product, 2013–2020 (USD Million)
Table 78 U.K.: Electrophoresis Dyes Market Size, By Product, 2013–2020 (USD Million)
Table 79 U.K.: Electrophoresis Buffers Market Size, By Product, 2013–2020 (USD Million)
Table 80 U.K.: Electrophoresis Reagents Market Size, By Technique, 2013–2020 (USD Million)
Table 81 U.K.: Market Size, By Application, 2013–2020 (USD Million)
Table 82 U.K.: Market Size, By End User, 2013–2020 (USD Million)
Table 83 Italy: Electrophoresis Reagents Market Size, By Product, 2013–2020 (USD Million)
Table 84 Italy: Electrophoresis Gels Market Size, By Product, 2013–2020 (USD Million)
Table 85 Italy: Electrophoresis Dyes Market Size, By Product, 2013–2020 (USD Million)
Table 86 Italy: Electrophoresis Buffers Market Size, By Product, 2013–2020 (USD Million)
Table 87 Italy: Market Size, By Technique, 2013–2020 (USD Million)
Table 88 Italy: Market Size, By Application, 2013–2020 (USD Million)
Table 89 Italy: Market Size, By End User, 2013–2020 (USD Million)
Table 90 Spain: Electrophoresis Reagents Market Size, By Product, 2013–2020 (USD Million)
Table 91 Spain: Electrophoresis Gels Market Size, By Product, 2013–2020 (USD Million)
Table 92 Spain: Electrophoresis Dyes Market Size, By Product, 2013–2020 (USD Million)
Table 93 Spain: Electrophoresis Buffers Market Size, By Product, 2013–2020 (USD Million)
Table 94 Spain: Market Size, By Technique, 2013–2020 (USD Million)
Table 95 Spain: Market Size, By Application, 2013–2020 (USD Million)
Table 96 Spain: Market Size, By End User, 2013–2020 (USD Million)
Table 97 Rest of Europe: Electrophoresis Reagents Market Size, By Product, 2013–2020 (USD Million)
Table 98 Rest of Europe: Electrophoresis Gels Market Size, By Product, 2013–2020 (USD Million)
Table 99 Rest of Europe: Electrophoresis Dyes Market Size, By Product, 2013–2020 (USD Million)
Table 100 Rest of Europe: Electrophoresis Buffers Market Size, By Product, 2013–2020 (USD Million)
Table 101 Rest of Europe: Market Size, By Technique, 2013–2020 (USD Million)
Table 102 Rest of Europe: Market Size, By Application, 2013–2020 (USD Million)
Table 103 Rest of Europe: Market Size, By End User, 2013–2020 (USD Million)
Table 104 Asia-Pacific: Electrophoresis Reagents Market Size, By Country, 2013–2020 (USD Million)
Table 105 Asia-Pacific: Market Size, By Product, 2013–2020 (USD Million)
Table 106 Asia-Pacific: Electrophoresis Gels Market Size, By Product, 2013–2020 (USD Million)
Table 107 Asia-Pacific: Electrophoresis Dyes Market Size, By Product, 2013–2020 (USD Million)
Table 108 Asia-Pacific: Electrophoresis Buffers Market Size, By Product, 2013–2020 (USD Million)
Table 109 Asia-Pacific: Market Size, By Technique, 2013–2020 (USD Million)
Table 110 Asia-Pacific: Market Size, By Application, 2013–2020 (USD Million)
Table 111 Asia-Pacific: Market Size, By End User, 2013–2020 (USD Million)
Table 112 Japan: Electrophoresis Reagents Market Size, By Product, 2013–2020 (USD Million)
Table 113 Japan: Electrophoresis Gels Market Size, By Product, 2013–2020 (USD Million)
Table 114 Japan: Electrophoresis Dyes Market Size, By Product, 2013–2020 (USD Million)
Table 115 Japan: Electrophoresis Buffers Market Size, By Product, 2013–2020 (USD Million)
Table 116 Japan: Market Size, By Technique, 2013–2020 (USD Million)
Table 117 Japan: Market Size, By Application, 2013–2020 (USD Million)
Table 118 Japan: Market Size, By End User, 2013–2020 (USD Million)
Table 119 China: Electrophoresis Reagents Market Size, By Product, 2013–2020 (USD Million)
Table 120 China: Electrophoresis Gels Market Size, By Product, 2013–2020 (USD Million)
Table 121 China: Electrophoresis Dyes Market Size, By Product, 2013–2020 (USD Million)
Table 122 China: Electrophoresis Buffers Market Size, By Product, 2013–2020 (USD Million)
Table 123 China: Market Size, By Technique, 2013–2020 (USD Million)
Table 124 China: Market Size, By Application, 2013–2020 (USD Million)
Table 125 China: Market Size, By End User, 2013–2020 (USD Million)
Table 126 India: Electrophoresis Reagents Market Size, By Product, 2013–2020 (USD Million)
Table 127 India: Electrophoresis Gels Market Size, By Product, 2013–2020 (USD Million)
Table 128 India: Electrophoresis Dyes Market Size, By Product, 2013–2020 (USD Million)
Table 129 India: Electrophoresis Buffers Market Size, By Product, 2013–2020 (USD Million)
Table 130 India: Market Size, By Technique, 2013–2020 (USD Million)
Table 131 India: Market Size, By Application, 2013–2020 (USD Million)
Table 132 India: Market Size, By End User, 2013–2020 (USD Million)
Table 133 Rest of Asia-Pacific: Electrophoresis Reagents Market Size, By Product, 2013–2020 (USD Million)
Table 134 Rest of Asia-Pacific: Electrophoresis Gels Market Size, By Product, 2013–2020 (USD Million)
Table 135 Rest of Asia-Pacific: Electrophoresis Dyes Market Size, By Product, 2013–2020 (USD Million)
Table 136 Rest of Asia-Pacific: Electrophoresis Buffers Market Size, By Product, 2013–2020 (USD Million)
Table 137 Rest of Asia-Pacific: Market Size, By Technique, 2013–2020 (USD Million)
Table 138 Rest of Asia-Pacific: Market Size, By Application, 2013–2020 (USD Million)
Table 139 Rest of Asia-Pacific: Market Size, By End User, 2013–2020 (USD Million)
Table 140 Rest of the World: Electrophoresis Reagents Market Size, By Region, 2013–2020 (USD Million)
Table 141 Rest of the World: Market Size, By Product, 2013–2020 (USD Million)
Table 142 Rest of the World: Electrophoresis Gels Market Size, By Product, 2013–2020 (USD Million)
Table 143 Rest of the World: Electrophoresis Dyes Market Size, By Product, 2013–2020 (USD Million)
Table 144 Rest of the World: Electrophoresis Buffers Market Size, By Product, 2013–2020 (USD Million)
Table 145 Rest of the World: Market Size, By Technique, 2013–2020 (USD Million)
Table 146 Rest of the World: Market Size, By Application, 2013–2020 (USD Million)
Table 147 Rest of the World: Market Size, By End User, 2013–2020 (USD Million)
Table 148 Latin America: Electrophoresis Reagents Market Size, By Product, 2013–2020 (USD Million)
Table 149 Latin America: Electrophoresis Gels Market Size, By Product, 2013–2020 (USD Million)
Table 150 Latin America: Electrophoresis Dyes Market Size, By Product, 2013–2020 (USD Million)
Table 151 Latin America: Electrophoresis Buffers Market Size, By Product, 2013–2020 (USD Million)
Table 152 Latin America: Market Size, By Technique, 2013–2020 (USD Million)
Table 153 Latin America: Market Size, By Application, 2013–2020 (USD Million)
Table 154 Latin America: Market Size, By End User, 2013–2020 (USD Million)
Table 155 Middle East and Africa: Electrophoresis Reagents Market Size, By Product, 2013–2020 (USD Million)
Table 156 Middle East and Africa: Electrophoresis Gels Market Size, By Product, 2013–2020 (USD Million)
Table 157 Middle East and Africa: Electrophoresis Dyes Market Size, By Product, 2013–2020 (USD Million)
Table 158 Middle East and Africa: Electrophoresis Buffers Market Size, By Product, 2013–2020 (USD Million)
Table 159 Middle East and Africa: Market Size, By Technique, 2013–2020 (USD Million)
Table 160 Middle East and Africa: Market Size, By Application, 2013–2020 (USD Million)
Table 161 Middle East and Africa: Market Size, By End User, 2013–2020 (USD Million)
Table 162 Growth Strategy Matrix (2012-2015)
Table 163 Agreements, Partnerships, and Collaborations, 2015
Table 164 Acquisitions, 2014–2015
Table 165 New Product Launches, 2014-2015
Table 166 Expansions, 2013-2015
List of Figures (50 Figures)
Figure 1 Electrophoresis Reagents Market: Research Design
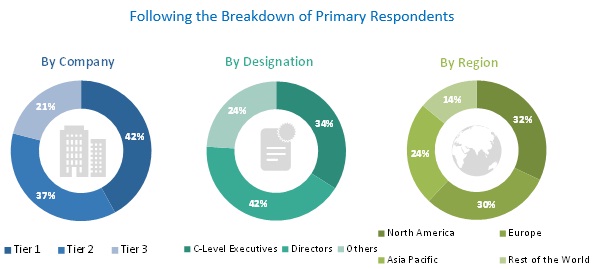
Figure 2 Market: Breakdown of Primary Interviews: By Company Type, Designation, and Region
Figure 3 Electrophoresis Reagents Market: Bottom-Up Approach
Figure 4 Market: Top-Down Approach
Figure 5 Electrophoresis Reagents Market: Data Triangulation Methodology
Figure 6 Healthcare Expenditure Across Key Markets, 2000 vs 2012
Figure 7 Healthcare Spending Matrix: Key Markets, 2013
Figure 8 Global Rise in Geriatric Population (2000–2013)
Figure 9 Increase in Aging Population, By Country, 2005 vs 2010
Figure 10 Rising Incidence of Cancer Across Key Regions, 2008 vs 2012
Figure 11 Prevalence of HIV Infections Across the Globe, By Region, 2013
Figure 12 Infectious Disease Outbreaks, 1980–2010
Figure 13 Reagents Segment Will Continue to Dominate the Market During the Forecast Period
Figure 14 Global Electrophoresis Reagents Market, By Product, 2015 vs 2020 (USD Million)
Figure 15 Market, By Technique, 2015 vs 2020 (USD Million)
Figure 16 Market, By End User, 2015 vs 2020 (USD Million)
Figure 17 Market, By Application, 2015 vs 2020 (USD Million)
Figure 18 Geographic Analysis: Global Electrophoresis Reagents Market
Figure 19 Increasing Patient Population Base for Infectious Diseases and Genetic Disorders—A Major Growth Driver for the Electrophoresis Reagents Market
Figure 20 North America to Dominate the Market During the Forecast Period
Figure 21 The U.S. Dominated the Global Electrophoresis Reagents Market in 2014
Figure 22 Gels Commanded the Largest Share of the Asia-Pacific Electrophoresis Reagents Market in 2014
Figure 23 Growing Preference for Genome-Based Disease Diagnosis to Drive the Growth of the Electrophoresis Reagents Market
Figure 24 Global Cancer Incidence, 2008–2025
Figure 25 Global Elderly Population, By Region
Figure 26 Cancer to Be Most Prominent Among the Geriatric Population By 2030
Figure 27 Value Chain Analysis
Figure 28 Electrophoresis Reagents Markets: Stakeholder Analysis (2015)
Figure 29 Global Market, By Product, 2015 vs 2020
Figure 30 Sybr Dyes to Witness Highest Growth Between 2015 and 2020
Figure 31 Gel Electrophoresis Reagents Segment to Dominate the Global Electrophoresis Reagents Market During the Forecast Period
Figure 32 Protein Analysis Application Segment to Dominate Market
Figure 33 Academic & Research Institutions, the Largest End-User Segment in the Global Electrophoresis Reagents Market
Figure 34 Geographic Snapshot (2015–2020)
Figure 35 North America Holds Lion’s Share in the Global Electrophoresis Reagents Market
Figure 36 Emerging Market Opportunities in the Developing APAC Countries
Figure 37 Agreements, Partnerships, and Collaborations: the Key Growth Strategy Adopted By Players During 2012–2015
Figure 38 Global Electrophoresis Reagents Market, By Key Player, 2014
Figure 39 Battle for Market Share: Agreements, Partnerships, and Collaborations Was the Key Strategy
Figure 40 Geographic Revenue Mix of Top Market Players
Figure 41 Thermo Fisher Scientific: Company Snapshot
Figure 42 Sigma-Aldrich Corporation: Company Snapshot
Figure 43 Bio-Rad Laboratories, Inc.: Company Snapshot
Figure 44 Qiagen N.V.: Company Snapshot
Figure 45 Merck Millipore: Company Snapshot
Figure 46 GE Healthcare: Company Snapshot
Figure 47 Agilent Technologies, Inc.: Company Snapshot
Figure 48 Lonza Group AG : Company Snapshot
Figure 49 Takara Bio, Inc.: Company Snapshot
Figure 50 Harvard Bioscience, Inc.: Company Snapshot
Secondary Research
In the secondary research process, various secondary sources such as Hoovers, Bloomberg BusinessWeek, and Dun & Bradstreet have been referred to, so as to identify and collect information for this study. These secondary sources included annual reports, press releases & investor presentations of companies, white papers, certified publications, articles by recognized authors, gold standard & silver standard websites, food safety organizations, regulatory bodies, trade directories, and databases.
Primary Research
The electrophoresis reagents market comprises several stakeholders such as raw material suppliers, processors, end-product manufacturers, distributors, and regulatory organizations in the supply chain. The demand side of this market is characterized by the development of the hospitals & clinics, diagnostic laboratories, home care, food & beverage, pharmaceutical, nutraceutical & biotechnology companies, and environmental testing industry. The supply side is characterized by advancements in technology and diverse application industries. Various primary sources from both, the supply and demand sides of the market were interviewed to obtain qualitative and quantitative information.
To know about the assumptions considered for the study, download the pdf brochure
Market Size Estimation
Both top-down and bottom-up approaches were used to estimate and validate the total size of the electrophoresis reagents market. These methods were also used extensively to estimate the size of various subsegments in the market. The research methodology used to estimate the market size includes the following:
- The key players in the industry and markets have been identified through extensive secondary research.
- The industry’s supply chain and market size, in terms of value, have been determined through primary and secondary research processes.
- All percentage shares, splits, and breakdowns have been determined using secondary sources and verified through primary sources.
Data Triangulation
After arriving at the overall market size-using the market size estimation processes as explained above—the market was split into several segments and subsegments. In order to complete the overall market engineering process and arrive at the exact statistics of each market segment and subsegment, the data triangulation and market breakdown procedures were employed, wherever applicable. The data was triangulated by studying various factors and trends from both, the demand and supply sides.
Objectives of the study:
- To define, describe, and forecast the global electrophoresis reagents market with respect to type of product, technique, end user, application, and region
- To provide detailed information regarding the major factors influencing the growth of the market (drivers, restraints, opportunities, and industry-specific challenges)
- To strategically analyze micromarkets1 with respect to individual growth trends, future prospects, and contributions to the overall market
- To analyze opportunities in the market for stakeholders and provide details of a competitive landscape for market leaders
- To forecast the size of the global electrophoresis reagents market, with respect to geography, in four main regions—North America, Europe, Asia-Pacific, and RoW
- To strategically profile the key players and comprehensively analyze their market shares and core competencies2
- To track and analyze competitive developments such as joint ventures; mergers and acquisitions; new product developments; and partnerships, agreements, and collaborations in the electrophoresis reagents market

 Generating Response ...


Growth opportunities and latent adjacency in Electrophoresis Reagents Market