Dielectric Material Market by Technology (OLED, LED, TFT-LCD, LED-LCD, Plasma, LCOS, DLP), Application (Conventional, 3D, Transparent, Flexible), Material (Metal Oxide, a-Silicon, LTPS, PET, PEN, Photonic Crystals) & by Geography - Global Forecast to 2013 - 2020


The market of consumer electronics display products is thriving, currently, and is expected to grow further, with the advancements in the display material technologies. Products such assmartphones, laptops, tablets, and TVs are garnering a very high demand from the consumers� perspective; this demand directly impacts the ever-increasing demand for the materials associated with these products. There are various materials that are incorporated into the display panels, which contribute to the diverse features of the display,such as defining the display�s resolution, feasibility, resistance to temperature and moisture, aspect ratio, thickness, and the likes. The report describes the materials with respect to the components that are used in the display panels. The dielectricmaterials that are used in the display panels can be stated as electrode materials, substrate materials, and encapsulation materials.
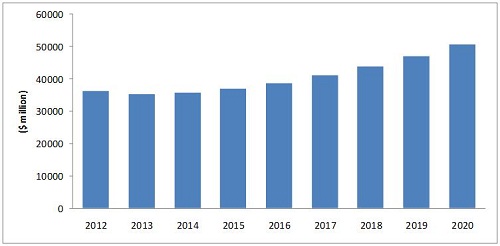
The analysis shows that the total dielectric material market is projectedto reach market revenue worth $50.63 billion by 2020. In terms of the technological segments, materials for TFT-LCD displays accounted for the largest market revenue,worth $25.00 billion, while materials for plasma displays accounted for the least market share, in 2012. Moreover, OLED dielectric material market is expected to grow at the highest CAGR from 2012 to 2020.In terms ofthe application segment, materials in conventional application sector accounted for the largest market revenue, while materials in the �transparent application� sector recorded the least market revenue, in 2012. The APAC region commanded the largest market share in terms of revenue. However,Asia-Pacificand ROWarelikely to grow atthehighest CAGR.
Key take-away
- Total revenue of the global dielectric material market is expected to grow at an estimated CAGR of 5.29% from 2012 to 2020.
- Impact analysis of the market dynamics; with factors currently driving and restraining the growth of the market, along with their impact in the short-, medium-, and long-term landscapes
- Analysis of the global market with a special focus on the high-growth applications in each vertical and the fast growing application market segments
- Detailed analysis of the mature and emerging marketsby application and by geography
- The key trends related to the materials, technology, prices, and the applications that shape and influence market
- Illustrative segmentation, analysis, and projection of the important geographical market to give an overall view of the global market
- Detailed competitive landscape with identification of the key players in the market with respect to each type of the material, in-depth market share analysis with individual revenue, market shares, and market share rankings
- Competitive intelligence from company profiles, key player strategies,and game-changing developments such as product launches, and acquisitions
- Identification of the emerging trends and analysis of the opportunities in the market, for the stakeholders, by identifying the high-growth segments of the dielectric material market
The dielectric material report, a culmination of extensive primary and secondary research, provides the current size of the global market in terms of revenue; and forecasts the same forthe duration from 2013 to 2020. The report analyzes the global market and presents detailed insights of the market by material, technology, application, and geography. Besides, a detailed analysis on the drivers, restraints, and opportunities of the market isalso presented.
The key trends which have emerged in the dielectric material market are; the increasing popularity of consumer electronics display products like TVs, laptops, smartphones, tablets and the likes; technological innovations within the materials, for the introduction of different display products that exhibit the flexibility, fold-ability, and roll-abilityproperties. One of the factors that is adversely affecting the growth of the materials market is the difficulty facedin the manufacturing and fabrication process of the new emerging display technologies. The dielectric material market is growing, globally; this increasing thrust on the display materials presents vast opportunities for players across the value chain. The market has been segmented as discussed below:
Market by technology � The display materials market by technology includes OLED, TFT-LCD, LCD, LED-LCD, plasma, DLP, LCoS, and the likes. The OLED materials market is expected to grow atthe highest CAGR from 2012 to 2020.
Market by material � The dielectric material market is segmented into materials, with respect to the components used in the display panels. The report describes the materials used in electrode like indium- tin-oxide (ITO), indium-gallium-zinc-oxide (IGZO) and others; materials in the substrates like a-silicon, LTPS, PEN, PET, and the likes; and the materials like liquid crystals, photonic crystals that are majorly used in LCD, LED-LCD, and TFT-LCD display panels.
Market by application � The application market is segmented into application of materials in flexible displays, transparent displays, conventional displays, 3D displays, and the likes.
Market by geography � The report discusses the dielectric material market under four geographical heads; namely North America, Europe, APAC, and ROW.
Dielectric Material Market Value, 2012 - 2020 ($ Million)
Source: MarketsandMarkets Analysis
 Exclusive indicates content/data unique to MarketsandMarkets and not available with any competitors.
Table Of Contents
1 Introduction (Page No. - 18)
1.1 Key Take-Aways
1.2 Report Description
1.3 Markets Covered
1.4 Stakeholders
1.5 Report Assumptions
1.5.1 Assumptions
1.6 Research Methodology
1.6.1 Market Size Estimation
1.6.2 Market Crackdown & Data Triangulation
2 Executive Summary (Page No. - 32)
3 Market Overview (Page No. - 35)
3.1introduction
3.2 Market Definition
3.3 Flexible Display Life Cycle
3.4 industry Trends
3.5 Market Dynamics
3.5.1 Drivers
3.5.1.1 Rapidly Growing Consumer Electronics industry
3.5.1.2 Distinctive Features of Emerging Displays
3.5.2 Restraints
3.5.2.1 Technology for Manufacturing and Fabricating Is At the Nascent Stage
3.5.3 Opportunities
3.5.3.1 Military
3.5.3.2 Digital Signage
3.6 Burning Issues
3.6.1 Cannibalization of Display Technologies
3.7 Winning Imperatives
3.8 Value Chain Analysis
4 Market By Material (Page No. - 48)
4.1 introduction
4.2 Metal Oxides
4.2.1 Amorphous IGZO
4.3 Materials for Substrates
4.3.1 Glass Substrate
4.3.1.1 A-Silicon
4.3.1.2 LTPS
4.3.2 Plastic Substrate
4.3.2.1 Pet
4.3.2.2 Pen
4.4 Liquid Crystals
4.5 Photonic Crystals
4.6 Others
5 Dielectric Market By Technology (Page No. - 63)
5.1 introduction
5.2 E-ink Display
5.2.1 Major Companies offering E-Link Display
5.3 TFT-LCD Displays
5.3.1 Market Segmentation � LCD Display
5.3.2 Market Segmentation- TFT LCD Display
5.4 LED Displays
5.4.1 Major Companies offering LED Displays
5.4.2 Conventional LED Displays
5.4.2.1 Major Companies offering Conventional LED Displays
5.4.3 Surface Mounted Devices
5.4.3.1 Major Companies offering Surface Mounted Devices (SMD)
5.4.4 LED Display Application Market
5.4.4.1 Backlighting
5.4.4.2 Signage
5.5 Oled Displays
5.5.1 Major Companies offering Oled Materials
5.6 Oled Manufacturing
5.6.1.1 Electrode Materials
5.6.1.1.1 Anode
5.6.1.1.2 Cathode
5.6.1.2 Emissive Layer (EML) Materials
5.6.1.3 Hole Transport Layer (HTL) Materials
5.6.1.4 Electron Transport Layer (ETL) Materials
5.6.1.5 Substrates
5.6.1.5.1 Glass Substrates
5.6.1.5.2 Plastic Substrates
5.6.1.5.3 Metal Foil
5.7 Oled Advantages & Disadvantages
5.8 Types of Oleds
5.8.1.1 Small Molecule Organic Light Emitting Diodes (SMOLED)
5.8.1.2 Passive Matrix Oled (PMOLED)
5.8.1.3 Active Matrix Oled (AMOLED)
5.8.1.4 Polymer Organic Light Emitting Diodes (PLED)
5.8.1.5 Phosphorescent Oled (PHOLED)
5.9 LCOS Displays
5.9.1 LCOS Technology Assessment
5.9.2 Comparing LCOS With Competing Display Technologies
5.9.3 Nematics LCOS (Nlc)
5.9.4 Ferroelectrics LCOS (Flcos)
5.10 Plasma Displays
5.10.1 Advanatges & Disadvantages of Plasma Displays
5.11 DLP (Digital Light Processor)
5.11.1 Advantages/Disadvantages
6 Dielectric Material Market By Application (Page No. - 113)
6.1 introduction
6.2 Coventional Display
6.2.1 Slowdown Coming
6.2.2 Going for Growth
6.3 Flexible Display
6.4 Transparent Display
6.5 3d Display
6.5.1 Need for 3d Technology
6.5.2 Types of 3d Displaying Technology
6.5.2.1 Stereoscopy
6.5.2.2 Auto-Stereoscopy
6.5.2.3 Volumetric
6.5.3 Future Advancements in 3d Technology
6.5.4 3d Display Market
7 Dielectric Material Market By Geography (Page No. - 121)
7.1 Introduction
7.2 North America
7.3 Europe
7.4 Asia Pacific
7.5 Rest of World
8 Competitive Landscape (Page No. - 139)
8.1 Market Player Analysis
8.2 New Product Launches
8.3 New Product Developments
8.4 Partnerships, Agreements, Collaborations and Strategic Cooperations
8.5 Others
9 Company Profiles (Page No. - 151)
9.1 Kent Displays
9.1.1 Introduction
9.1.2 Products & Services
9.1.3 Strategies& Insights
9.1.4 Developments
9.1.5 MNM View
9.2 LG Display
9.2.1 Introduction
9.2.2 Products & Services
9.2.3 Strategies& Insights
9.2.4 Developments
9.2.5 MNM View
9.3 NEC Display Solutions
9.3.1 Introduction
9.3.2 Products & Services
9.3.3 Strategies& Insights
9.3.4 Developments
9.3.5 MNM View
9.4 Samsung Display
9.4.1 Introduction
9.4.2 Products & Services
9.4.3 Strategies& Insights
9.4.4 Developments
9.4.5 MNM View
9.5 Samsung Corning Precision Materials
9.5.1 Introduction
9.5.2 Products & Services
9.5.3 Strategies& Insights
9.5.4 MNM View
9.6 NKT Photonics
9.6.1 Introduction
9.6.2 Products & Services
9.6.3 Strategies& Insights
9.6.4 Developments
9.6.5 MNM View
9.7 Schott AG
9.7.1 Introduction
9.7.2 Products & Services
9.7.3 Strategies& Insights
9.7.4 Developments
9.7.5 MNM View
9.8 Kolon Industries
9.8.1 Introduction
9.8.2 Products & Services
9.8.3 Strategy &Insights
9.8.4 MNM View
9.9 Honeywell Electronics Materials
9.9.1 Introduction
9.9.2 Products & Services
9.9.3 Strategies& Insights
9.9.4 Developments
9.9.5 MNM View
9.10 Polyera Corporation
9.10.1 Introduction
9.10.2 Products & Services
9.10.3 Strategies& Insights
9.10.4 Developments
9.10.5 MNM View
9.11 Plextronics
9.11.1 Introduction
9.11.2 Products & Services
9.11.3 Strategies & Insights
9.11.4 Developments
9.11.5 MNM View
9.12 Plastic Logic
9.12.1 Introduction
9.12.2 Products & Services
9.12.3 Strategies& Insights
9.12.4 Developments
9.12.5 MNM View
9.13 Merck Performance Materials
9.13.1 Introduction
9.13.2 Products & Services
9.13.3 Strategies& Insights
9.13.4 Developments
9.13.5 MNM View
9.14 Tecnisco
9.14.1 Introduction
9.14.2 Products & Services
9.14.3 Strategies & Insights
9.14.4 Developments
9.14.5 MNM View
9.15 BASF
9.15.1 Introduction
9.15.2 Products & Services
9.15.3 Strategies& Insights
9.15.4 Developments
9.15.5 MNM View
9.16 Corning Incorporated
9.16.1 Introduction
9.16.2 Products & Services
9.16.3 Strategies & Insights
9.16.4 Developments
9.17 Dupont Display
9.17.1 Introduction
9.17.2 Products & Services
9.17.3 Strategies & Insights
9.17.4 Developments
9.18 Materion Corporation
9.18.1 Introduction
9.18.2 Products & Services
9.18.3 Strategies & Insights
9.18.4 Developments
9.19 Novaled AG
9.19.1 Introduction
9.19.2 Product & Services
9.19.3 Strategies & Insights
9.19.4 Developments
9.20 Toppan Co. Ltd
9.20.1 Introduction
9.20.2 Products & Services
9.20.3 Strategies & Insights
9.20.4 Developments
9.21 Universal Display Corporation
9.21.1 Introduction
9.21.2 Products & Services
9.21.3 Strategies & Insights
9.21.4 Developments
List of Tables (44 Tables)
Table 1 Dielectric Material Market: Assumption & Description
Table 2 Global Metal Oxides Market Value, By Technology, 2012-2020 ($Million)
Table 3 Global A-IGZO Market Value, By Technology, 2012-2020 ($Million)
Table 4 Global A-Silicon Market Value, By Technology, 2012-2020 ($Million)
Table 5 Global LTPS Market Value, By Technology, 2012-2020 ($Million)
Table 6 Properties of Various Plastic Substrates
Table 7 Global Liquid Crystals Market Value, By Technology, 2012-2020 ($Million)
Table 8 Global Photonic Crystals Market Value, By Technology, 2012-2020 ($Million)
Table 9 Global Dielectric Material Market Value, By Technology, 2012-2020 ($Million)
Table 10 Global E-Ink Display Materials Market Value, 2012-2020 ($Million)
Table 11 Global E-Ink Display Materials Market Value, By Geography, 2012-2020 ($Million)
Table 12 Global TFT-LCD Display Materials Market Value, 2012-2020 ($Million)
Table 13 Global TFT-LCD Display Materials Market Value, By Geography, 2012-2020 ($Million)
Table 14 Global LED Display Materials Market Value, 2012-2020 ($Million)
Table 15 Global LED Display Materials Market Value, By Geography, 2012-2020 ($Million)
Table 16 Global LED-LCD Display Materials Market Value, 2012-2020 ($Million)
Table 17 Global LED-LCD Display Materials Market Value, By Geography, 2012-2020 ($Million)
Table 18 Global Oled Display Materials Market Value, 2012-2020 ($Million)
Table 19 Advantages of Oled Technology
Table 20 Disadvantages of Oled Technology
Table 21 Global Oled Display Materials Market Value, By Geography, 2012-2020 ($Million)
Table 22 Comparision Between Amoled & Pmoled
Table 23 Global LCOS Display Materials Market Value, 2012-2020 ($Million)
Table 24 Display Technology Assessment
Table 25 Global LCOS Display Materials Market Value, By Geography, 2012-2020 ($Million)
Table 26 Global Plasma Display Materials Market Value, 2012-2020 ($Million)
Table 27 Plasma Display Materials Market Value, By Geography, 2012-2020 ($Million)
Table 28 Global DLP Display Materials Market Value, 2012-2020 ($Million)
Table 29 Advantages and Disadvantages of DLP Technology
Table 30 Global DLP Display Materials Market Value, By Geography, 2012-2020 ($Million)
Table 31 Global Dielectric Material Market Value, By Application, 2012-2020 ($Million)
Table 32 Global Market Value, By Geography, 2012-2020 ($Million)
Table 33 North America Dielectric Material Market Value, By Application, 2012-2020 ($Million)
Table 34 North America Market Value, By Technology, 2012-2020 ($Million)
Table 35 Europe Dielectric Material Market Value, By Application, 2012-2020 ($Million)
Table 36 Europe Market Value, By Technology, 2012-2020 ($Million)
Table 37 APAC Dielectric Material Market Value, By Application, 2012-2020 ($Million)
Table 38 APAC Market Value, By Technology, 2012-2020 ($Million)
Table 39 ROW Dielectric Material Market Value, By Application, 2012-2020 ($Million)
Table 40 ROW Market Value, By Technology, 2012-2020 ($Million)
Table 41 Global Dielectric Material Market: New Product Developments and Product Announcements, 2010 � 2013
Table 42 Global Market: Partnership, Agreements, Collaborations, and Strategic Cooperation, 2011 � 2013
Table 43 Global Market: Other Developments, 2011 � 2013
Table 44 Corning:Products& Services
List of Figures (51 Figures)
Figure 1 Market Segmentation of Dielectric Material Market
Figure 2 Research Methodology
Figure 3 Market Size Estimation
Figure 4 Data Triangulation Methodology
Figure 5 Dielectric Material Market Value, By Geography, 2012-2020 ($Million)
Figure 6 Life Cycle of Flexible Displays
Figure 7 Smart Phones Shipments (Million Units)
Figure 8 Impact Analysis of the Drivers
Figure 9 Impact Analysis of Restraints
Figure 10 Value Chain Analysis of Dielectric Material Market
Figure 11 Dielectric Material Market Value, 2012-2020 ($Million)
Figure 12 LCD Structure
Figure 13 LCOS Structur
Figure 14 Plasma Display Structure
Figure 15 DLP Structure
Figure 16 Global Display Materials Market Share, By Growth Strategies, 2010 �2013
Figure 17 Kent Displays: SWOT Analysis
Figure 18 LG Display: Products & Services 156
Figure 19 LG Display: SWOT Analysis
Figure 20 NEC Display Solutions: Products & Services
Figure 21 NEC Display Solutions: SWOT Analysis
Figure 22 Samsung Display: Products & Services
Figure 23 Samsung Display: SWOT Analysis
Figure 24 Samsung Corning Precision Materials: Products & Services
Figure 25 Samsung Corning Precision Materials: SWOT Analysis
Figure 26 NKT Photonics: Products & Services
Figure 27 NKT Photonics: SWOT Analysis
Figure 28 Scott AG�s: Products & Services
Figure 29 Schott AG: SWOT Analysis
Figure 30 Kolon Industries: Products & Services
Figure 31 Kolon Industries: SWOT Analysis
Figure 32 Honeywell Electronics Materials: Products & Services
Figure 33 Honeywell Electronics Materials: SWOT Analysis
Figure 34 Polyera Corporation: SWOT Analysis
Figure 35 Plextronics: Products & Services
Figure 36 Plextronics: SWOT Analysis
Figure 37 Plastic Logic: SWOT Analysis
Figure 38 Merck Performance Materials: Products & Services
Figure 39 Merck Performance Materials: SWOT Analysis
Figure 40 Tecnisco: Products & Services
Figure 41 Tecnisco: SWOT Analysis
Figure 42 BASF: Company Snapshot
Figure 43 BASF: Products & Services
Figure 44 BASF: SWOT Analysis
Figure 45 Corning Inc.: Company Snapshot
Figure 46 Dupont: Company Snapshot
Figure 47 Materion Corporation: Company Snapshot
Figure 48 Novaled AG: Product Portfolio
Figure 49 Toppan: Company Snapshot
Figure 50 Toppan: Business Segments
Figure 51 Uiversal Display Corporation


Growth opportunities and latent adjacency in Dielectric Material Market