Depth Filtration Market by Media Type (Cellulose, Activated Carbon), Product (Capsule, Sheet, Module), Application (Final Product Processing (Biologics), Cell Clarification, Viral Clearance, Operation Scale (Manufacturing, Lab) - Global Forecasts to 2024


Market Growth Outlook Summary
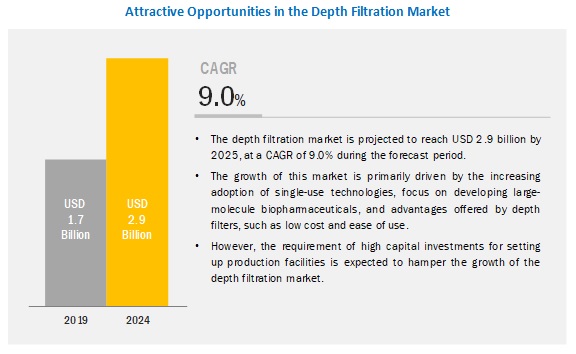
The global depth filtration market forecasted to transform from $1.7 billion in 2019 to $2.9 billion by 2024, driven by a CAGR of 9.0%. The growth of this market is majorly driven by factors such as the growing adoption of disposable filters and benefits such as ease of use and low cost of media and filters. However, factors such as the requirement of high capital investments for setting up production facilities are expected to restrain the growth of this market during the forecast period.
Small molecules segment to account for the largest share of the depth filtration market, by final product processing, in 2019
Based on the product, the depth filtration market is segmented into final product processing, cell clarification, raw material filtration, diagnostics, and viral clearance. The final product processing segment is further categorized as small-molecule processing and biologics processing. The raw material filtration market is further segmented into media & buffer filtration and bioburden testing. The small molecules segment accounted for the largest share in the final product processing market owing to the need for purity in the production of API and formulation.
Manufacturing scale segment accounted for the largest share of the depth filtration market, by operation scale, in 2019
Based on the scale of operation, the depth filtration market is segmented into manufacturing-scale, pilot-scale, and lab-scale depth filtration. The manufacturing-scale segment is the largest and fastest-growing segment of the depth filtration market. This can be attributed to the increasing R&D activities for the production of biologics.
Cartridge filters are the largest product segment in the depth filtration market
Based on the product, the depth filtration market is segmented into cartridge filters, capsule filters, filter modules, filter sheets, plate and frame filters, accessories, and other products (includes caps, pads, pods, syringes, bags, and discs). This can be attributed to the high dirt-holding capacity and long service life of these products, which ultimately helps in reducing labor costs by decreasing the filter change-out frequency.
Diatomaceous earth was the most significant media type of depth filtration market in 2019
Based on media, the depth filtration market is broadly segmented into diatomaceous earth (DE), activated carbon, cellulose, perlite, and other media (glass fibers, quartz, borosilicate, and resin binders). The DE filters segment accounted for the largest share of the global depth filtration market in 2019 owing to its wide range of applications in the pharmaceutical and biopharmaceutical industry.
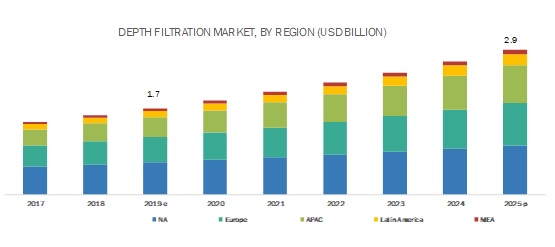
North America accounted for the largest share of the global depth filtration market in 2019
The global depth filtration market is segmented into four major regions, namely, North America, Europe, the Asia Pacific, Latin America, and Middle-East & Africa. In 2019, North America accounted for the largest share of 38.0% of the global depth filtration market, followed by Europe, with a share of 29.2%. The large share of the North American region can be attributed to a large number of pharmaceutical and biotechnology companies in the region and the presence of a well-established healthcare market. The Asia Pacific market, on the other hand, is expected to register the highest growth during the forecast period. Factors such as increasing research and development by pharmaceutical companies in China, India, and Japan are likely to support the growth of this market.
Depth Filtration Market Key Players
The major companies operating in the global depth filtration market include Merck KGaA (Germany), Danaher Corporation (US), Sartorius AG (Germany), GE Healthcare (US), 3M (US), Parker Hannifin Corporation (US), Porvair Filtration Group (UK), ErtelAlsop (US), Amazon Filters Ltd. (UK), Meissner Filtration Products, Inc. (US), Donaldson Comany, Inc. (US), Eaton Corporation (Ireland), Saint-Gobain Performance Plastics (France), Clariance Technique (Australia), Repligen Corporation (US), Microfilt India Pvt. Ltd. (India), Graver Technologies (US), Gusmer Enterprises (US), Filtrox AG (Switzerland), Pure Process (UK), Membrane Solutions (US), Allied Filter Systems Ltd. (UK), Pentair (US), Membracon (UK), and Phenomenex (US)
Danaher (US) held the leading position in this market primarily due to its strong portfolio of depth filtration including filters and media. In addition, the company has strengthened its market position through the expansion of its product portfolio by collaboration and agreement and expansion.
Scope of the Depth Filtration Industry
|
Report Metric |
Details |
|
Market Revenue Size in 2019 |
$1.7 billion |
|
Projected Revenue Size by 2024 |
$2.9 billion |
|
Industry Growth Rate |
Poised to Grow at a CAGR of 9.0% |
|
Market Driver |
Increasing adoption of single-use technologies |
|
Market Opportunity |
Emerging markets |
The research report categorizes the global depth filtration market to forecast revenue and analyze trends in each of the following submarkets:
By Product
- Cartridge Filters
- Capsule Filters
- Filter Modules
- Filter Sheets
- Plates & Frames
- Accessories
- Others Products
By Media Type
- Diatomaceous Earth
- Cellulose
- Activated Carbon
- Perlite
- Others
By Application
-
Final Product Processing
- Small molecules
- Biologics
- Cell Clarification
-
Raw material
- Media & Buffer
- Bioburden Testing
- Diagnostics
- Viral Clearance
By Operation Scale
- Manufacturing Scale
- Pilot Scale
- Lab Scale
By Region
-
North America
- US
- Canada
-
Europe
- Germany
- UK
- France
- RoE
-
Asia Pacific
- Japan
- China
- RoAPAC
- Latin America
- Middle-East & Africa
Recent Developments:
- In 2019, Sartorius opened manufacturing operations in Yauco, Puerto Rico, to increase its production capacity and deliver a wider array of products to its American customers directly.
- In 2019, Merck expanded its distribution capacity in Gillingham, UK.
- In 2019, Parker Bioscience Filtration, a part of Parker Hannifin, expanded its facilities at Birtley, UK
Key questions addressed by the report:
- Who are the major players in the depth filtration market?
- What are the regional growth trends and the largest revenue-generating regions in the depth filtration market?
- What are the major drivers and current trends in the depth filtration market?
- What are the major product segments in the depth filtration market?
- What are the major application of depth filtration product?
Frequently Asked Questions (FAQ):
Which is the largest revenue generating depth product market?
The depth filtration market is segmented into cartridge filters, capsule filters, filter modules, filter sheets, plate and frame filters, accessories, and other products (includes caps, pads, pods, syringes, bags, and discs). The cartridge filter segment commanded largest share in the product segment. This can be attributed to the high dirt-holding capacity and long service life of these products, which ultimately helps in reducing labor costs by decreasing the filter change-out frequency.
Which is the fastest growing media type used in depth filtration?
The depth filtration market is broadly segmented into diatomaceous earth (DE), activated carbon, cellulose, perlite, and other media (glass fibers, quartz, borosilicate, and resin binders). The DE filters segment accounted for the largest share of the global depth filtration market in 2019 owing to its wide range of applications in the pharmaceutical and biopharmaceutical industry.
What are the major applications for depth filtration?
The depth filtration market is segmented into final product processing, cell clarification, raw material filtration, diagnostics, and viral clearance. The final product processing segment is further categorized as small-molecule processing and biologics processing. The raw material filtration market is further segmented into media & buffer filtration and bioburden testing.
What are the major drivers and current trends in depth filtration market?
The depth filtration market is growing at a growth rate of 9.0% during forecast period. The growth of this market is majorly driven by factors such as the growing adoption of disposable filters and benefits such as ease of use and low cost of media and filters. However, factors such as the requirement of high capital investments for setting up production facilities are expected to restrain the growth of this market during the forecast period.
To speak to our analyst for a discussion on the above findings, click Speak to Analyst
 Exclusive indicates content/data unique to MarketsandMarkets and not available with any competitors.
TABLE OF CONTENTS
1 INTRODUCTION (Page No. - 18)
1.1 OBJECTIVES OF THE STUDY
1.2 MARKET DEFINITION
1.2.1 INCLUSIONS & EXCLUSIONS
1.3 MARKET SCOPE
1.3.1 MARKETS COVERED
1.3.2 YEARS CONSIDERED FOR THE STUDY
1.4 CURRENCY
1.5 LIMITATIONS
1.6 STAKEHOLDERS
2 RESEARCH METHODOLOGY (Page No. - 23)
2.1 RESEARCH DATA
2.1.1 SECONDARY DATA
2.1.2 PRIMARY DATA
2.1.3 MARKET DATA ESTIMATION & TRIANGULATION
2.1.4 DATA TRIANGULATION
2.2 MARKET ESTIMATION METHODOLOGY
2.3 MARKET GROWTH RATE PROJECTIONS
2.4 RESEARCH ASSUMPTIONS
3 EXECUTIVE SUMMARY (Page No. - 30)
4 PREMIUM INSIGHTS (Page No. - 34)
4.1 DEPTH FILTRATION MARKET OVERVIEW
4.2 ASIA PACIFIC: DEPTH FILTRATION MARKET SHARE, BY OPERATION SCALE & COUNTRY (2018)
4.3 DEPTH FILTRATION MARKET, BY PRODUCT
4.4 DEPTH FILTRATION MARKET SHARE, BY APPLICATION, 2019 VS. 2025
4.5 DEPTH FILTRATION MARKET, BY MEDIA, 2019 VS. 2025 (USD MILLION)
5 MARKET OVERVIEW (Page No. - 38)
5.1 INTRODUCTION
5.2 MARKET DYNAMICS
5.2.1 MARKET DRIVERS
5.2.1.1 Increasing adoption of single-use technologies
5.2.1.2 Focus on developing large-molecule biopharmaceuticals
5.2.1.3 Advantages such as low cost and ease of use are driving the uptake of depth filters
5.2.2 OPPORTUNITIES
5.2.2.1 Emerging markets
5.2.3 CHALLENGES
5.2.3.1 Requirement of high capital investments for setting-up production facilities
5.2.4 MARKET TRENDS
5.2.4.1 Increased preference of synthetic depth media over naturally derived media
6 DEPTH FILTRATION MARKET, BY MEDIA (Page No. - 41)
6.1 INTRODUCTION
6.2 DIATOMACEOUS EARTH
6.2.1 DE IS OFTEN USED IN DEPTH FILTERS IN THE BIOTECHNOLOGY INDUSTRY
6.3 CELLULOSE
6.3.1 CELLULOSE-BASED DEPTH FILTERS ARE COST EFFECTIVE
6.4 ACTIVATED CARBON
6.4.1 ACTIVATED CARBON IS ECONOMICAL FOR TRADITIONAL PHARMACEUTICAL MANUFACTURING OPERATIONS
6.5 PERLITE
6.5.1 PERLITE PROVIDES MORE PURITY AS COMPARED TO DIATOMACEOUS EARTH
6.6 OTHER MEDIA
7 DEPTH FILTRATION MARKET, BY PRODUCT (Page No. - 50)
7.1 INTRODUCTION
7.2 CARTRIDGE FILTERS
7.2.1 HIGH DIRT HOLDING CAPACITY & WIDE APPLICATIONS IN MICROBIAL FILTRATION ARE DRIVING THE GROWTH OF THIS SEGMENT
7.3 CAPSULE FILTERS
7.3.1 CAPSULE FILTERS ARE USED IN A WIDE RANGE OF APPLICATIONS
7.4 FILTER MODULES
7.4.1 FILTER MODULES ARE BETTER AND ECONOMIC ALTERNATIVES TO CARTRIDGE FILTERS
7.5 FILTER SHEETS
7.5.1 FILTER SHEETS ARE USED IN LABORATORIES AND RESEARCH CENTERS
7.6 PLATE & FRAME FILTERS
7.6.1 PLATE & FRAME FILTERS ARE MAJORLY USED IN THE PLASMA FRACTIONATION PROCESS
7.7 ACCESSORIES
7.8 OTHER PRODUCTS
8 DEPTH FILTRATION MARKET, BY APPLICATION (Page No. - 63)
8.1 INTRODUCTION
8.2 FINAL PRODUCT PROCESSING
8.2.1 SMALL-MOLECULE PROCESSING
8.2.1.1 Need for purity in API production to support market growth
8.2.2 BIOLOGICS PROCESSING
8.2.2.1 Need for continuous monitoring of raw materials for bioburden to support market growth
8.3 CELL CLARIFICATION
8.3.1 LOW INITIAL COST & MAJOR ROLE IN PRIMARY CELL CLARIFICATION ARE SUPPORTING THE GROWTH OF THIS SEGMENT
8.4 RAW MATERIAL FILTRATION
8.4.1 MEDIA & BUFFER FILTRATION
8.4.1.1 The use of depth filters in diafiltration to process buffers is supporting the growth of this segment
8.4.2 BIOBURDEN TESTING
8.4.2.1 Need for microbial removal during plasma fractionation & vaccine production to support market growth
8.5 DIAGNOSTICS
8.5.1 DEPTH FILTERS PLAY A MAJOR ROLE IN BLOOD SEPARATION
8.6 VIRAL CLEARANCE
8.6.1 CHARGED DEPTH FILTERS ARE IMPLEMENTED FOR VIRUS REMOVAL DURING MABS PRODUCTION
9 DEPTH FILTRATION MARKET, BY OPERATION SCALE (Page No. - 76)
9.1 INTRODUCTION
9.2 MANUFACTURING SCALE
9.2.1 MANUFACTURING SCALE OFFERS A LARGE SCOPE FOR THE INSTALLATION OF ADVANCED FILTERS
9.3 PILOT SCALE
9.3.1 PILOT-SCALE PLANTS ARE CONSIDERABLY LESS EXPENSIVE TO BUILD AS COMPARED TO FULL-SCALE PLANTS
9.4 LAB SCALE
9.4.1 LAB-SCALE OPERATIONS REDUCE THE RISK OF FINANCIAL LOSSES AND ASSURE THE OPTIMAL USE OF RESOURCES
10 DEPTH FILTRATION MARKET, BY REGION (Page No. - 79)
10.1 INTRODUCTION
10.2 NORTH AMERICA
10.2.1 US
10.2.1.1 Increasing number of R&D investments to drive the demand for depth filtration products in the US
10.2.2 CANADA
10.2.2.1 Government funding to support market growth in Canada
10.3 EUROPE
10.3.1 GERMANY
10.3.1.1 Focus on improving the quality of filtration products has resulted in the greater adoption of depth filters in Germany
10.3.2 UK
10.3.2.1 Increasing demand for economical and efficient separation and purification solutions to drive the demand for depth filtration products in the UK
10.3.3 FRANCE
10.3.3.1 Increasing funding and initiatives from private and public organizations to drive market growth
10.3.4 REST OF EUROPE
10.4 ASIA PACIFIC
10.4.1 CHINA
10.4.1.1 China is the largest market for depth filtration products in the APAC
10.4.2 JAPAN
10.4.2.1 Need for safety and efficacy in drug manufacturing processes to drive market growth in Japan
10.4.3 REST OF ASIA PACIFIC
10.5 LATIN AMERICA
10.5.1 BRAZIL IS A MAJOR CONTRIBUTOR TO THE LATIN AMERICAN DEPTH FILTRATION MARKET
10.6 MIDDLE EAST & AFRICA
10.6.1 GROWTH IN THE PHARMACEUTICALS MARKET IN THIS REGION TO SUPPORT MARKET GROWTH
11 COMPETITIVE LANDSCAPE (Page No. - 116)
11.1 INTRODUCTION
11.2 MARKET RANKING ANALYSIS
11.3 COMPETITIVE LEADERSHIP MAPPING
11.3.1 VISIONARY LEADERS
11.3.2 DYNAMIC DIFFERENTIATORS
11.3.3 INNOVATORS
11.3.4 EMERGING COMPANIES
11.4 COMPETITIVE SCENARIO
11.4.1 KEY PRODUCT LAUNCHES
11.4.2 KEY EXPANSIONS
11.4.3 KEY PARTNERSHIPS & COLLABORATIONS
12 COMPANY PROFILES (Page No. - 120)
(Business Overview, Products Offered, Recent Developments, MnM View)*
12.1 DANAHER CORPORATION
12.2 MERCK KGAA
12.3 SARTORIUS AG
12.4 GE HEALTHCARE
12.5 3M
12.6 PARKER HANNIFIN CORPORATION
12.7 PORVAIR FILTRATION GROUP (A PART OF PORVAIR PLC)
12.8 ERTELAISOP
12.9 MEISSNER FILTRATION PRODUCTS, INC.
12.10 DONALDSON COMPANY, INC.
12.11 GRAVER TECHNOLOGIES
12.12 EATON CORPORATION
12.13 REPLIGEN CORPORATION
12.14 SAINT-GOBAIN PERFORMANCE PLASTICS
12.15 FILTROX AG
12.16 PURE PROCESS
12.17 AMAZON FILTERS LTD.
12.18 CLARIANCE TECHNIQUE
12.19 MICROFILT INDIA PVT. LTD.
12.20 GUSMER ENTERPRISES
*Business Overview, Products Offered, Recent Developments, MnM View might not be captured in case of unlisted companies.
13 APPENDIX (Page No. - 151)
13.1 DISCUSSION GUIDE
13.2 KNOWLEDGE STORE: MARKETSANDMARKETS’ SUBSCRIPTION PORTAL
13.3 AVAILABLE CUSTOMIZATIONS
13.4 RELATED REPORTS
13.5 AUTHOR DETAILS
LIST OF TABLES (170 Tables)
TABLE 1 DEPTH FILTRATION MARKET, BY MEDIA, 2017–2025 (USD MILLION)
TABLE 2 DIATOMACEOUS EARTH FILTERS MARKET, BY REGION, 2017–2025 (USD MILLION)
TABLE 3 NORTH AMERICA: DIATOMACEOUS EARTH FILTERS MARKET, BY COUNTRY, 2017–2025 (USD MILLION)
TABLE 4 EUROPE: DIATOMACEOUS EARTH FILTERS MARKET, BY COUNTRY, 2017–2025 (USD MILLION)
TABLE 5 APAC: DIATOMACEOUS EARTH FILTERS MARKET, BY COUNTRY, 2017–2025 (USD MILLION)
TABLE 6 CELLULOSE FILTERS MARKET, BY REGION, 2017–2025 (USD MILLION)
TABLE 7 NORTH AMERICA: CELLULOSE FILTERS MARKET, BY COUNTRY, 2017–2025 (USD MILLION)
TABLE 8 EUROPE: CELLULOSE FILTERS MARKET, BY COUNTRY, 2017–2025 (USD MILLION)
TABLE 9 APAC: CELLULOSE FILTERS MARKET, BY COUNTRY, 2017–2025 (USD MILLION)
TABLE 10 ACTIVATED CARBON FILTERS MARKET, BY REGION, 2017–2025 (USD MILLION)
TABLE 11 NORTH AMERICA: ACTIVATED CARBON FILTERS MARKET, BY COUNTRY, 2017–2025 (USD MILLION)
TABLE 12 EUROPE: ACTIVATED CARBON FILTERS MARKET, BY COUNTRY, 2017–2025 (USD MILLION)
TABLE 13 APAC: ACTIVATED CARBON FILTERS MARKET, BY COUNTRY, 2017–2025 (USD MILLION)
TABLE 14 PERLITE FILTERS MARKET, BY REGION, 2017–2025 (USD MILLION)
TABLE 15 NORTH AMERICA: PERLITE FILTERS MARKET, BY COUNTRY, 2017–2025 (USD MILLION)
TABLE 16 EUROPE: PERLITE FILTERS MARKET, BY COUNTRY, 2017–2025 (USD MILLION)
TABLE 17 APAC: PERLITE FILTERS MARKET, BY COUNTRY, 2017–2025 (USD MILLION)
TABLE 18 DEPTH FILTRATION MARKET FOR OTHER MEDIA, BY REGION, 2017–2025 (USD MILLION)
TABLE 19 NORTH AMERICA: DEPTH FILTRATION MARKET FOR OTHER MEDIA, BY COUNTRY, 2017–2025 (USD MILLION)
TABLE 20 EUROPE: DEPTH FILTRATION MARKET FOR OTHER MEDIA, BY COUNTRY, 2017–2025 (USD MILLION)
TABLE 21 APAC: DEPTH FILTRATION MARKET FOR OTHER MEDIA, BY COUNTRY, 2017–2025 (USD MILLION)
TABLE 22 DEPTH FILTRATION MARKET, BY PRODUCT, 2017–2025 (USD MILLION)
TABLE 23 DEPTH FILTRATION MARKET, BY PRODUCT, 2017–2025 (UNITS)
TABLE 24 CARTRIDGE FILTERS MARKET, BY REGION, 2017–2025 (USD MILLION)
TABLE 25 NORTH AMERICA: CARTRIDGE FILTERS MARKET, BY COUNTRY, 2017–2025 (USD MILLION)
TABLE 26 EUROPE: CARTRIDGE FILTERS MARKET, BY COUNTRY, 2017–2025 (USD MILLION)
TABLE 27 APAC: CARTRIDGE FILTERS MARKET, BY COUNTRY, 2017–2025 (USD MILLION)
TABLE 28 CAPSULE FILTERS MARKET, BY REGION, 2017–2025 (USD MILLION)
TABLE 29 NORTH AMERICA: CAPSULE FILTERS MARKET, BY COUNTRY, 2017–2025 (USD MILLION)
TABLE 30 EUROPE: CAPSULE FILTERS MARKET, BY COUNTRY, 2017–2025 (USD MILLION)
TABLE 31 APAC: CAPSULE FILTERS MARKET, BY COUNTRY, 2017–2025 (USD MILLION)
TABLE 32 FILTER MODULES MARKET, BY REGION, 2017–2025 (USD MILLION)
TABLE 33 NORTH AMERICA: FILTER MODULES MARKET, BY COUNTRY, 2017–2025 (USD MILLION)
TABLE 34 EUROPE: FILTER MODULES MARKET, BY COUNTRY, 2017–2025 (USD MILLION)
TABLE 35 APAC: FILTER MODULES MARKET, BY COUNTRY, 2017–2025 (USD MILLION)
TABLE 36 FILTER SHEETS MARKET, BY REGION, 2017–2025 (USD MILLION)
TABLE 37 NORTH AMERICA: FILTER SHEETS MARKET, BY COUNTRY, 2017–2025 (USD MILLION)
TABLE 38 EUROPE: FILTER SHEETS MARKET, BY COUNTRY, 2017–2025 (USD MILLION)
TABLE 39 APAC: FILTER SHEETS MARKET, BY COUNTRY, 2017–2025 (USD MILLION)
TABLE 40 PLATE & FRAME FILTERS MARKET, BY REGION, 2017–2025 (USD MILLION)
TABLE 41 NORTH AMERICA: PLATE & FRAME FILTERS MARKET, BY COUNTRY, 2017–2025 (USD MILLION)
TABLE 42 EUROPE: PLATE & FRAME FILTERS MARKET, BY COUNTRY, 2017–2025 (USD MILLION)
TABLE 43 APAC: PLATE & FRAME FILTERS MARKET, BY COUNTRY, 2017–2025 (USD MILLION)
TABLE 44 FILTER ACCESSORIES MARKET, BY REGION, 2017–2025 (USD MILLION)
TABLE 45 NORTH AMERICA: FILTER ACCESSORIES MARKET, BY COUNTRY, 2017–2025 (USD MILLION)
TABLE 46 EUROPE: FILTER ACCESSORIES MARKET, BY COUNTRY, 2017–2025 (USD MILLION)
TABLE 47 APAC: FILTER ACCESSORIES MARKET, BY COUNTRY, 2017–2025 (USD MILLION)
TABLE 48 DEPTH FILTRATION MARKET FOR OTHER PRODUCTS, BY REGION, 2017–2025 (USD MILLION)
TABLE 49 NORTH AMERICA: DEPTH FILTRATION MARKET FOR OTHER PRODUCTS, BY COUNTRY, 2017–2025 (USD MILLION)
TABLE 50 EUROPE: DEPTH FILTRATION MARKET FOR OTHER PRODUCTS, BY COUNTRY, 2017–2025 (USD MILLION)
TABLE 51 APAC: DEPTH FILTRATION MARKET FOR OTHER PRODUCTS, BY COUNTRY, 2017–2025 (USD MILLION)
TABLE 52 DEPTH FILTRATION MARKET, BY APPLICATION, 2017–2025 (USD MILLION)
TABLE 53 DEPTH FILTRATION MARKET FOR FINAL PRODUCT PROCESSING, BY TYPE, 2017–2025 (USD MILLION)
TABLE 54 DEPTH FILTRATION MARKET FOR FINAL PRODUCT PROCESSING, BY REGION, 2017–2025 (USD MILLION)
TABLE 55 NORTH AMERICA: DEPTH FILTRATION MARKET FOR FINAL PRODUCT PROCESSING, BY COUNTRY, 2017–2025 (USD MILLION)
TABLE 56 EUROPE: DEPTH FILTRATION MARKET FOR FINAL PRODUCT PROCESSING, BY COUNTRY, 2017–2025 (USD MILLION)
TABLE 57 APAC: DEPTH FILTRATION MARKET FOR FINAL PRODUCT PROCESSING, BY COUNTRY, 2017–2025 (USD MILLION)
TABLE 58 DEPTH FILTRATION MARKET FOR SMALL-MOLECULE PROCESSING, BY REGION, 2017–2025 (USD MILLION)
TABLE 59 DEPTH FILTRATION MARKET FOR BIOLOGICS PROCESSING, BY REGION, 2017–2025 (USD MILLION)
TABLE 60 DEPTH FILTRATION MARKET FOR CELL CLARIFICATION, BY REGION, 2017–2025 (USD MILLION)
TABLE 61 NORTH AMERICA: DEPTH FILTRATION MARKET FOR CELL CLARIFICATION, BY COUNTRY, 2017–2025 (USD MILLION)
TABLE 62 EUROPE: DEPTH FILTRATION MARKET FOR CELL CLARIFICATION, BY COUNTRY, 2017–2025 (USD MILLION)
TABLE 63 APAC: DEPTH FILTRATION MARKET FOR CELL CLARIFICATION, BY COUNTRY, 2017–2025 (USD MILLION)
TABLE 64 DEPTH FILTRATION MARKET FOR RAW MATERIAL FILTRATION, BY TYPE, 2017–2025 (USD MILLION)
TABLE 65 DEPTH FILTRATION MARKET FOR RAW MATERIAL FILTRATION, BY REGION, 2017–2025 (USD MILLION)
TABLE 66 NORTH AMERICA: DEPTH FILTRATION MARKET FOR RAW MATERIAL FILTRATION, BY COUNTRY, 2017–2025 (USD MILLION)
TABLE 67 EUROPE: DEPTH FILTRATION MARKET FOR RAW MATERIAL FILTRATION, BY COUNTRY, 2017–2025 (USD MILLION)
TABLE 68 APAC: DEPTH FILTRATION MARKET FOR RAW MATERIAL FILTRATION, BY COUNTRY, 2017–2025 (USD MILLION)
TABLE 69 DEPTH FILTRATION MARKET FOR MEDIA & BUFFER FILTRATION, BY REGION, 2017–2025 (USD MILLION)
TABLE 70 DEPTH FILTRATION MARKET FOR BIOBURDEN TESTING, BY REGION, 2017–2025 (USD MILLION)
TABLE 71 DEPTH FILTRATION MARKET FOR DIAGNOSTICS, BY REGION, 2017–2025 (USD MILLION)
TABLE 72 NORTH AMERICA: DEPTH FILTRATION MARKET FOR DIAGNOSTICS, BY COUNTRY, 2017–2025 (USD MILLION)
TABLE 73 EUROPE: DEPTH FILTRATION MARKET FOR DIAGNOSTICS, BY COUNTRY, 2017–2025 (USD MILLION)
TABLE 74 APAC: DEPTH FILTRATION MARKET FOR DIAGNOSTICS, BY COUNTRY, 2017–2025 (USD MILLION)
TABLE 75 DEPTH FILTRATION MARKET FOR VIRAL CLEARANCE, BY REGION, 2017–2025 (USD MILLION)
TABLE 76 NORTH AMERICA: DEPTH FILTRATION MARKET FOR VIRAL CLEARANCE, BY COUNTRY, 2017–2025 (USD MILLION)
TABLE 77 EUROPE: DEPTH FILTRATION MARKET FOR VIRAL CLEARANCE, BY COUNTRY, 2017–2025 (USD MILLION)
TABLE 78 APAC: DEPTH FILTRATION MARKET FOR VIRAL CLEARANCE, BY COUNTRY, 2017–2025 (USD MILLION)
TABLE 79 DEPTH FILTRATION MARKET, BY OPERATION SCALE, 2017–2025 (USD MILLION)
TABLE 80 MANUFACTURING-SCALE DEPTH FILTRATION MARKET, BY REGION, 2017–2025 (USD MILLION)
TABLE 81 PILOT-SCALE DEPTH FILTRATION MARKET, BY REGION, 2017–2025 (USD MILLION)
TABLE 82 LAB-SCALE DEPTH FILTRATION MARKET, BY REGION, 2017–2025 (USD MILLION)
TABLE 83 DEPTH FILTRATION MARKET, BY REGION, 2017–2025 (USD MILLION)
TABLE 84 NORTH AMERICA: DEPTH FILTRATION MARKET, BY COUNTRY, 2017–2025 (USD MILLION)
TABLE 85 NORTH AMERICA: DEPTH FILTRATION MARKET, BY PRODUCT, 2017–2025 (USD MILLION)
TABLE 86 NORTH AMERICA: DEPTH FILTRATION MARKET, BY MEDIA, 2017–2025 (USD MILLION)
TABLE 87 NORTH AMERICA: DEPTH FILTRATION MARKET, BY OPERATION SCALE, 2017–2025 (USD MILLION)
TABLE 88 NORTH AMERICA: DEPTH FILTRATION MARKET, BY APPLICATION, 2017–2025 (USD MILLION)
TABLE 89 NORTH AMERICA: DEPTH FILTRATION MARKET FOR FINAL PRODUCT PROCESSING, BY TYPE, 2017–2025 (USD MILLION)
TABLE 90 NORTH AMERICA: DEPTH FILTRATION MARKET FOR RAW MATERIAL FILTRATION, BY TYPE, 2017–2025 (USD MILLION)
TABLE 91 US: DEPTH FILTRATION MARKET, BY PRODUCT, 2017–2025 (USD MILLION)
TABLE 92 US: DEPTH FILTRATION MARKET, BY MEDIA, 2017–2025 (USD MILLION)
TABLE 93 US: DEPTH FILTRATION MARKET, BY OPERATION SCALE, 2017–2025 (USD MILLION)
TABLE 94 US: DEPTH FILTRATION MARKET, BY APPLICATION, 2017–2025 (USD MILLION)
TABLE 95 US: DEPTH FILTRATION MARKET FOR FINAL PRODUCT PROCESSING, BY TYPE, 2017–2025 (USD MILLION)
TABLE 96 US: DEPTH FILTRATION MARKET FOR RAW MATERIAL FILTRATION, BY TYPE, 2017–2025 (USD MILLION)
TABLE 97 CANADA: DEPTH FILTRATION MARKET, BY PRODUCT, 2017–2025 (USD MILLION)
TABLE 98 CANADA: DEPTH FILTRATION MARKET, BY MEDIA, 2017–2025 (USD MILLION)
TABLE 99 CANADA: DEPTH FILTRATION MARKET, BY OPERATION SCALE, 2017–2025 (USD MILLION)
TABLE 100 CANADA: DEPTH FILTRATION MARKET, BY APPLICATION, 2017–2025 (USD MILLION)
TABLE 101 CANADA: DEPTH FILTRATION MARKET FOR FINAL PRODUCT PROCESSING, BY TYPE, 2017–2025 (USD MILLION)
TABLE 102 CANADA: DEPTH FILTRATION MARKET FOR RAW MATERIAL FILTRATION, BY TYPE, 2017–2025 (USD MILLION)
TABLE 103 EUROPE: DEPTH FILTRATION MARKET, BY COUNTRY/REGION, 2017–2025 (USD MILLION)
TABLE 104 EUROPE: DEPTH FILTRATION MARKET, BY PRODUCT, 2017–2025 (USD MILLION)
TABLE 105 EUROPE: DEPTH FILTRATION MARKET, BY MEDIA, 2017–2025 (USD MILLION)
TABLE 106 EUROPE: DEPTH FILTRATION MARKET, BY OPERATION SCALE, 2017–2025 (USD MILLION)
TABLE 107 EUROPE: DEPTH FILTRATION MARKET, BY APPLICATION, 2017–2025 (USD MILLION)
TABLE 108 EUROPE: DEPTH FILTRATION MARKET FOR FINAL PRODUCT PROCESSING, BY TYPE, 2017–2025 (USD MILLION)
TABLE 109 EUROPE: DEPTH FILTRATION MARKET FOR RAW MATERIAL FILTRATION, BY TYPE, 2017–2025 (USD MILLION)
TABLE 110 GERMANY: DEPTH FILTRATION MARKET, BY PRODUCT, 2017–2025 (USD MILLION)
TABLE 111 GERMANY: DEPTH FILTRATION MARKET, BY MEDIA, 2017–2025 (USD MILLION)
TABLE 112 GERMANY: DEPTH FILTRATION MARKET, BY OPERATION SCALE, 2017–2025 (USD MILLION)
TABLE 113 GERMANY: DEPTH FILTRATION MARKET, BY APPLICATION, 2017–2025 (USD MILLION)
TABLE 114 GERMANY: DEPTH FILTRATION MARKET FOR FINAL PRODUCT PROCESSING, BY TYPE, 2017–2025 (USD MILLION)
TABLE 115 GERMANY: DEPTH FILTRATION MARKET FOR RAW MATERIAL FILTRATION, BY TYPE, 2017–2025 (USD MILLION)
TABLE 116 UK: DEPTH FILTRATION MARKET, BY PRODUCT, 2017–2025 (USD MILLION)
TABLE 117 UK: DEPTH FILTRATION MARKET, BY MEDIA, 2017–2025 (USD MILLION)
TABLE 118 UK: DEPTH FILTRATION MARKET, BY OPERATION SCALE, 2017–2025 (USD MILLION)
TABLE 119 UK: DEPTH FILTRATION MARKET, BY APPLICATION, 2017–2025 (USD MILLION)
TABLE 120 UK: DEPTH FILTRATION MARKET FOR FINAL PRODUCT PROCESSING, BY TYPE, 2017–2025 (USD MILLION)
TABLE 121 UK: DEPTH FILTRATION MARKET FOR RAW MATERIAL FILTRATION, BY TYPE, 2017–2025 (USD MILLION)
TABLE 122 FRANCE: DEPTH FILTRATION MARKET, BY PRODUCT, 2017–2025 (USD MILLION)
TABLE 123 FRANCE: DEPTH FILTRATION MARKET, BY MEDIA, 2017–2025 (USD MILLION)
TABLE 124 FRANCE: DEPTH FILTRATION MARKET, BY OPERATION SCALE, 2017–2025 (USD MILLION)
TABLE 125 FRANCE: DEPTH FILTRATION MARKET, BY APPLICATION, 2017–2025 (USD MILLION)
TABLE 126 FRANCE: DEPTH FILTRATION MARKET FOR FINAL PRODUCT PROCESSING, BY TYPE, 2017–2025 (USD MILLION)
TABLE 127 FRANCE: DEPTH FILTRATION MARKET FOR RAW MATERIAL FILTRATION, BY TYPE, 2017–2025 (USD MILLION)
TABLE 128 ROE: DEPTH FILTRATION MARKET, BY PRODUCT, 2017–2025 (USD MILLION)
TABLE 129 ROE: DEPTH FILTRATION MARKET, BY MEDIA, 2017–2025 (USD MILLION)
TABLE 130 ROE: DEPTH FILTRATION MARKET, BY OPERATION SCALE, 2017–2025 (USD MILLION)
TABLE 131 ROE: DEPTH FILTRATION MARKET, BY APPLICATION, 2017–2025 (USD MILLION)
TABLE 132 ROE: DEPTH FILTRATION MARKET FOR FINAL PRODUCT PROCESSING, BY TYPE, 2017–2025 (USD MILLION)
TABLE 133 ROE: DEPTH FILTRATION MARKET FOR RAW MATERIAL FILTRATION, BY TYPE, 2017–2025 (USD MILLION)
TABLE 134 APAC: DEPTH FILTRATION MARKET, BY COUNTRY, 2017–2025 (USD MILLION)
TABLE 135 APAC: DEPTH FILTRATION MARKET, BY PRODUCT, 2017–2025 (USD MILLION)
TABLE 136 APAC: DEPTH FILTRATION MARKET, BY MEDIA, 2017–2025 (USD MILLION)
TABLE 137 APAC: DEPTH FILTRATION MARKET, BY OPERATION SCALE, 2017–2025 (USD MILLION)
TABLE 138 APAC: DEPTH FILTRATION MARKET, BY APPLICATION, 2017–2025 (USD MILLION)
TABLE 139 APAC: DEPTH FILTRATION MARKET FOR FINAL PRODUCT PROCESSING, BY TYPE, 2017–2025 (USD MILLION)
TABLE 140 APAC: DEPTH FILTRATION MARKET FOR RAW MATERIAL FILTRATION, BY TYPE, 2017–2025 (USD MILLION)
TABLE 141 CHINA: DEPTH FILTRATION MARKET, BY PRODUCT, 2017–2025 (USD MILLION
TABLE 142 CHINA: DEPTH FILTRATION MARKET, BY MEDIA, 2017–2025 (USD MILLION)
TABLE 143 CHINA: DEPTH FILTRATION MARKET, BY OPERATION SCALE, 2017–2025 (USD MILLION)
TABLE 144 CHINA: DEPTH FILTRATION MARKET, BY APPLICATION, 2017–2025 (USD MILLION)
TABLE 145 CHINA: DEPTH FILTRATION MARKET FOR FINAL PRODUCT PROCESSING, BY TYPE, 2017–2025 (USD MILLION)
TABLE 146 CHINA: DEPTH FILTRATION MARKET FOR RAW MATERIAL FILTRATION, BY TYPE, 2017–2025 (USD MILLION)
TABLE 147 JAPAN: DEPTH FILTRATION MARKET, BY PRODUCT, 2017–2025 (USD MILLION)
TABLE 148 JAPAN: DEPTH FILTRATION MARKET, BY MEDIA, 2017–2025 (USD MILLION)
TABLE 149 JAPAN: DEPTH FILTRATION MARKET, BY OPERATION SCALE, 2017–2025 (USD MILLION)
TABLE 150 JAPAN: DEPTH FILTRATION MARKET, BY APPLICATION, 2017–2025 (USD MILLION)
TABLE 151 JAPAN: DEPTH FILTRATION MARKET FOR FINAL PRODUCT PROCESSING, BY TYPE, 2017–2025 (USD MILLION)
TABLE 152 JAPAN: DEPTH FILTRATION MARKET FOR RAW MATERIAL FILTRATION, BY TYPE, 2017–2025 (USD MILLION)
TABLE 153 ROAPAC: DEPTH FILTRATION MARKET, BY PRODUCT, 2017–2025 (USD MILLION)
TABLE 154 ROAPAC: DEPTH FILTRATION MARKET, BY MEDIA, 2017–2025 (USD MILLION)
TABLE 155 ROAPAC: DEPTH FILTRATION MARKET, BY OPERATION SCALE, 2017–2025 (USD MILLION)
TABLE 156 ROAPAC: DEPTH FILTRATION MARKET, BY APPLICATION, 2017–2025 (USD MILLION)
TABLE 157 ROAPAC: DEPTH FILTRATION MARKET FOR FINAL PRODUCT PROCESSING, BY TYPE, 2017–2025 (USD MILLION)
TABLE 158 ROAPAC: DEPTH FILTRATION MARKET FOR RAW MATERIAL FILTRATION, BY TYPE, 2017–2025 (USD MILLION)
TABLE 159 LATAM: DEPTH FILTRATION MARKET, BY PRODUCT, 2017–2025 (USD MILLION)
TABLE 160 LATAM: DEPTH FILTRATION MARKET, BY MEDIA, 2017–2025 (USD MILLION)
TABLE 161 LATAM: DEPTH FILTRATION MARKET, BY OPERATION SCALE, 2017–2025 (USD MILLION)
TABLE 162 LATAM: DEPTH FILTRATION MARKET, BY APPLICATION, 2017–2025 (USD MILLION)
TABLE 163 LATAM: DEPTH FILTRATION MARKET FOR FINAL PRODUCT PROCESSING, BY TYPE, 2017–2025 (USD MILLION)
TABLE 164 LATAM: DEPTH FILTRATION MARKET FOR RAW MATERIAL FILTRATION, BY TYPE, 2017–2025 (USD MILLION)
TABLE 165 MEA: DEPTH FILTRATION MARKET, BY PRODUCT, 2017–2025 (USD MILLION)
TABLE 166 MEA: DEPTH FILTRATION MARKET, BY MEDIA, 2017–2025 (USD MILLION)
TABLE 167 MEA: DEPTH FILTRATION MARKET, BY OPERATION SCALE, 2017–2025 (USD MILLION)
TABLE 168 MEA: DEPTH FILTRATION MARKET, BY APPLICATION, 2017–2025 (USD MILLION)
TABLE 169 MEA: DEPTH FILTRATION MARKET FOR FINAL PRODUCT PROCESSING, BY TYPE, 2017–2025 (USD MILLION)
TABLE 170 MEA: DEPTH FILTRATION MARKET FOR RAW MATERIAL FILTRATION, BY TYPE, 2017–2025 (USD MILLION)
LIST OF FIGURES (31 Figures)
FIGURE 1 BREAKDOWN OF PRIMARIES: DEPTH FILTRATION MARKET
FIGURE 2 DATA TRIANGULATION METHODOLOGY
FIGURE 3 MARKET SIZE ESTIMATION: APPROACH 1 (REVENUE-BASED ESTIMATION)
FIGURE 4 MARKET SIZE ESTIMATION: APPROACH 2 (TOP-DOWN APPROACH)
FIGURE 5 DEPTH FILTRATION MARKET SIZE (USD BILLION)
FIGURE 6 DEPTH FILTRATION MARKET CAGR PROJECTIONS (COMPANY GROWTH RATE)
FIGURE 7 DEPTH FILTRATION MARKET: FINAL CAGR PROJECTIONS (2019−2025)
FIGURE 8 DEPTH FILTRATION MARKET CAGR PROJECTIONS FROM THE ANALYSIS OF DEMAND-SIDE DRIVERS, OPPORTUNITIES, & CHALLENGES
FIGURE 9 DEPTH FILTRATION MARKET SHARE, BY PRODUCT, 2018
FIGURE 10 DEPTH FILTRATION MARKET SHARE, BY APPLICATION, 2018
FIGURE 11 DEPTH FILTRATION MARKET, BY MEDIA, 2019 VS. 2025
FIGURE 12 GEOGRAPHICAL SNAPSHOT OF THE DEPTH FILTRATION MARKET
FIGURE 13 FOCUS ON DEVELOPING LARGE-MOLECULE BIOPHARMACEUTICALS TO DRIVE MARKET GROWTH
FIGURE 14 MANUFACTURING-SCALE SEGMENT ACCOUNTED FOR THE LARGEST SHARE OF THE ASIA PACIFIC DEPTH FILTRATION MARKET IN 2018
FIGURE 15 CARTRIDGE FILTERS SEGMENT WILL CONTINUE TO DOMINATE THE DEPTH FILTRATION MARKET IN THE FORECAST PERIOD
FIGURE 16 FINAL PRODUCT PROCESSING IS THE LARGEST APPLICATION SEGMENT OF THE DEPTH FILTRATION MARKET
FIGURE 17 DIATOMACEOUS EARTH SEGMENT DOMINATES THE DEPTH FILTRATION MARKETIN 2025
FIGURE 18 NORTH AMERICA: DEPTH FILTRATION MARKET SNAPSHOT
FIGURE 19 APAC: DEPTH FILTRATION MARKET SNAPSHOT
FIGURE 20 COMPANY RANKING IN THE DEPTH FILTRATION MARKET, 2018
FIGURE 21 DEPTH FILTRATION MARKET (GLOBAL) COMPETITIVE LEADERSHIP MAPPING, 2018
FIGURE 22 DANAHER CORPORATION: COMPANY SNAPSHOT (2018)
FIGURE 23 MERCK KGAA: COMPANY SNAPSHOT (2018)
FIGURE 24 SARTORIUS: COMPANY SNAPSHOT (2019)
FIGURE 25 GE HEALTHCARE: COMPANY SNAPSHOT (2018)
FIGURE 26 3M COMPANY: COMPANY SNAPSHOT (2018)
FIGURE 27 PARKER HANNIFIN: COMPANY SNAPSHOT (2019)
FIGURE 28 PORVAIR PLC: COMPANY SNAPSHOT (2018)
FIGURE 29 DONALDSON COMPANY, INC.: COMPANY SNAPSHOT (2019)
FIGURE 30 EATON CORPORATION: COMPANY SNAPSHOT (2018)
FIGURE 31 REPLIGEN CORPORATION: COMPANY SNAPSHOT (2018)
The study involved two major activities in estimating the current size of the depth filtration market. Exhaustive research was conducted to collect information on the market as well as its peer and parent markets. The next step was to validate these findings, assumptions, and sizing with industry experts across the value chain through primary research. Both top-down and bottom-up approaches were employed to estimate the complete market size. After that, market breakdown and data triangulation were used to estimate the size of segments and sub-segments.
Secondary Research
In the secondary research process, various sources, such as Hoovers, Bloomberg BusinessWeek, Forbes, and Dun & Bradstreet, were referred to for identifying and collecting information useful for this study. Some of the secondary sources used for this study include annual reports, press releases, investor presentations of companies, World Bank, International Society for Pharmaceutical Engineering (ISPE), Bio-Process Systems Alliance (BPSA), US Food and Drug Administration (US FDA), American Filtration and Separations Society (AFS), American Membrane Technology Association,(AMTA), Indian Pharmaceutical Association, Parenteral Drug Association (PDA). Secondary research was mainly used to obtain vital information about the industry’s supply chain, the total pool of key players, and market classification and segmentation according to industry trends to the bottom-most level. It was also used to obtain information about the key developments from a market-oriented perspective.
Primary Research
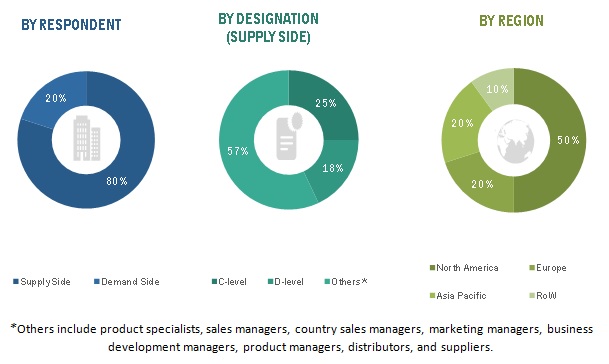
The depth filtration market comprises several stakeholders, such as raw material suppliers; manufacturers of depth filters, media, vendors and distributors, and regulatory organizations in the supply chain. Various primary sources from both the supply and demand sides of the market were interviewed to obtain qualitative and quantitative information. The primary respondents from the demand side included purchase managers in biotechnology & pharmaceutical companies, CROs.CMOS among other end users. The primary sources from the supply side included industry experts such as CEOs, vice presidents, marketing directors, technology and innovation directors, and related key executives from various key companies and organizations operating in the market. Following is the profile breakup of primary respondents:
To know about the assumptions considered for the study, download the pdf brochure
Market Size Estimation
- For the calculation of the global market value, the segmental revenue was arrived at based on the revenue mapping of major players active in the protein engineering market. This process involved the following steps:
- Generating a list of the major global players operating in the depth filtration market
- Mapping the annual revenue generated by major global players from their depth filtration business (or the nearest reported business unit/product category)
- Mapping the revenue of major players to cover 70-80% of the global market as of 2018
- Extrapolating the value to 100% to arrive at the global market size
Data Triangulation
After arriving at the overall market size-using the market size estimation process explained above-the market was split into several segments and subsegments. To complete the overall market engineering process and arrive at the exact statistics of each market segment and subsegment, data triangulation, and market breakdown procedures were employed, wherever applicable. The data was triangulated by studying various factors and trends from both the demand and supply sides of the protein engineering market.
Report Objectives
- To define, describe, and forecast the global protein engineering market, by product, media type, application, operation scale, and region
- To provide detailed information regarding the major factors influencing the growth of the depth filtration market (drivers, restraints, and opportunities)
- To analyze micro markets with respect to individual growth trends, prospects, and contributions to the overall depth filtration market
- To analyze opportunities in the market for stakeholders and provide details of a competitive landscape for market leaders
- To forecast the size (by value) of market segments concerning four major regions (along with countries)—North America, Europe, the Asia Pacific, and Latin America, Middle-East and Africa.
- To profile key players and comprehensively analyze their core competencies in terms of key market developments and growth strategies
- To track and analyze competitive developments such as product launches, acquisitions, agreements, and expansions in the depth filtration market
Available Customizations
With the given market data, MarketsandMarkets offers customizations as per the client’s specific needs. The following customization options are available for the report:
Product Analysis
- Product matrix, which gives a detailed comparison of the product portfolios of the top five companies
Geographic Analysis
- Further breakdown of the RoAPAC market
- Further breakdown of the RoE depth filtration market into Spain and Italy
Company Information
- Detailed analysis and profiling of additional market players (up to 5)

 Generating Response ...


Growth opportunities and latent adjacency in Depth Filtration Market