Data Center Rack Server Market by Form Factor (1U, 2U, and 4U), Service, Tier Type (Tier 1, Tier 2, Tier 3, and Tier 4), Data Center Type (Mid-Sized, Enterprise, and Large Data Centers), Industry, and Region - Global Forecast to 2024


Data Center Rack Server Market Size & Forecast
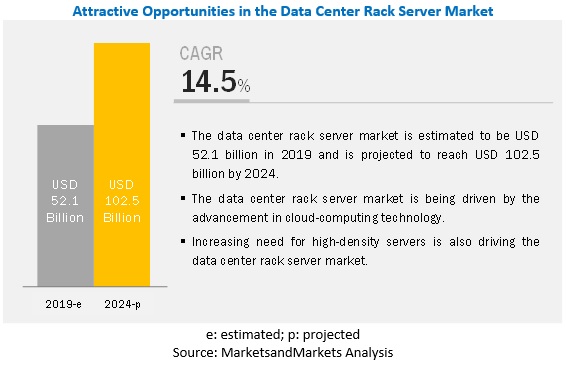
The global Data Center Rack Server Market size was valued at USD 52.1 billion in 2019 and is expected to grow at a CAGR of 14.5% from 2019 to 2024. The revenue forecast for 2024 is projected to reach $102.5 billion. The base year for estimation is 2018, and the historical data spans from 2019 to 2024. Factors that drive the growth of the market are the need for scalable data centers and high-density computing. Moreover, advancements in emerging technologies, such as edge computing, IoT, and cloud computing, are expected to create ample opportunities for data center rack server vendors.
2U form factor segment to hold the largest market size during the forecast period
The 2U form factor segment is estimated to hold the largest market size during the forecast period. This is mainly because it facilitates easy adoption inSMEs. The servers require normal coolers and hence are economical. Moreover, 2U rack server solutions enable a low-cost deployment for a variety of data center needs. These benefits fuel the demand for data center rack servers in the market.
Mid-sized data centers segment to record the fastest growth rate during the forecast period
The adoption of data center rack servers among mid-sized data centers is projected to grow at the highest CAGR during the forecast period. Rack servers used in mid-sized data centers provide a facility for storing and computing information at a lower cost, which helps organizations in their personal or private usage. Organizations are rapidly adopting these solutions as they provide increased scalability and easy migration from traditional technologies. Vendors can develop specific solutions targeted toward mid-sized data centers to improve their position in the data center rack server market. Furthermore, rising technological proficiency among the mid-sized data centers further compels mid-sized data centers to adopt data center rack servers.
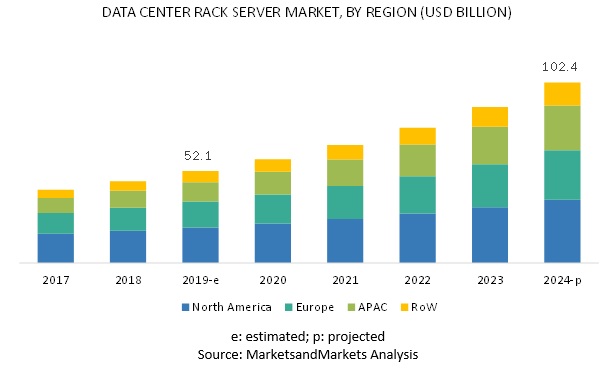
North America to account for the largest market size during the forecast period
The global data center rack server market by region covers 4 major geographic regions, namely, North America, Asia Pacific (APAC), Europe, and the Rest of the World (RoW). North America is expected to account for the largest market size during the forecast period due to increasing technology adoption among North American enterprises and the presence of a large number of data center rack server vendors.
Key Market Players
The major players in the data center rack server market are Hewlett Packard Enterprise (US), Lenovo (China), Dell (US), Cisco Systems (US), Huawei (China), Oracle (US), Fujitsu (Japan), NEC (Japan), Rittal (Germany), Vertiv (US), Schneider Electric (France), Asus (China), Inspur Systems (China), Iron Systems (US), Black Box Corporation (US), and Quanta Computer, (China).
The study includes an in-depth competitive analysis of these key players in the data center rack server market with their company profiles, recent developments, and key market strategies.
Scope of the report
|
Report Metric |
Details |
|
Market size available for years |
2017–2024 |
|
Base year considered |
2018 |
|
Forecast period |
2019–2024 |
|
Forecast units |
Billion (USD) |
|
Segments covered |
Form Factor, Service, Tier Type, Data Center Type, Vertical, And Region |
|
Geographies covered |
North America, APAC, Europe, and the Rest of the World (RoW) |
|
Companies covered |
Hewlett Packard Enterprise (US), Lenovo (China), Dell (US), Cisco Systems (US), Huawei (China), Oracle (US), Fujitsu (Japan), NEC (Japan), Rittal (Germany), Vertiv (US), Schneider Electric (France), Asus (China), Inspur Systems. (China), Iron Systems (US), Black Box Corporation (US), and Quanta Computer (China), Tripp Lite (US), Supermicro (US), Chatsworth Products (US), Belden (US). |
This research report categorizes the data center rack server market based on form factors, services, tier types, data center types, verticals, and regions.
Based on Form Factors:
- 1U
- 2U
- 4U
- Others
Based on Services:
- Design and Consulting
- Installation and Deployment
- Support and Maintenance
Based on Tier Types:
- Tier 1
- Tier 2
- Tier 3
- Tier 4
Based on Data Center Types:
- Mid-sized Data Centers
- Enterprise Data Centers
- Large Data Centers
Based on Verticals:
- Banking, Financial Services and Insurance
- IT and Telecom
- Government and Defense
- Healthcare and Life Sciences
- Research and Academic
- Retail and eCommerce
- Media and Entertainment
- Energy and Utilities
- Others (Manufacturing, and Transport and Logistics)
Based on Regions:
-
North America
- US
- Canada
-
Europe
- UK
- Rest of Europe
-
APAC
- China
- Rest of APAC
-
Rest Of the World
- MEA
- Latin America
Recent Developments
- In November 2019, Hewlett Packard Enterprise (HPE) collaborated with National Renewable Energy Laboratory (NREL) to help automate and improve the operational efficiency of data centers by leveraging Artificial Intelligence (AI) and Machine Learning (ML). This collaboration is an approach to reduce energy consumption and lower the operating costs.
- In April 2019, Huawei launched FusionServer Pro Intelligent Servers. The transformation to intelligent servers, help improve application speed and efficiency. These servers are provided with fault management and full liquid-cooling cabinet. This new product helps increase efficiency and performance.
Key questions addressed by the report
- What are the opportunities in the data center rack server market?
- What is the competitive landscape in the market?
- What are the data regulations that will impact the market?
- What are the primary growth factors for the data center rack server market in North America?
- What are the dynamics of the market?
Frequently Asked Questions (FAQ):
How big is the data center rack server market?
The global data center rack server market size was estimated at USD 52.1 billion in 2019 and is expected to reach USD 102.5 billion by 2024.
What is the data center rack server market growth?
The global data center rack server market is expected to grow at a compound annual growth rate of 14.5 % from 2019 to 2024 to reach USD 102.5 billion by 2024.
Which region has the highest market size in the data center rack server market?
North America region has the highest market size during the forecast period due to increasing technology adoption among North American enterprises and the presence of a large number of data center rack server vendors.
What are the different form factors and data center segments in the data center rack server market?
Following are the different form factors and data center segments in the data center rack server market:
-
Form Factors:
- 1U
- 2U
- 4U
- Others
-
Data Center Segments:
- Mid-sized Data Centers
- Enterprise Data Centers
- Large Data Centers
Who are the major vendors in the data center rack server market?
The major vendors in the data center rack server market are Hewlett Packard Enterprise (US), Lenovo (China), Dell (US), Cisco Systems (US), Huawei (China), Oracle (US), Fujitsu (Japan), NEC (Japan), Rittal (Germany), Vertiv (US), Schneider Electric (France), Asus (China), Inspur Systems (China), Iron Systems (US), Black Box Corporation (US), and Quanta Computer, (China).
What are some of the latest trends in the data center rack server market?
Following are the current trends in the data center rack server market:
Driving Factors for the Data Center Rack Server Market:
- Need for scalable data centers
- High-density computing
Opportunities for the Data Center Rack Server Market:
- Advancements in the emerging technologies such as IoT and Cloud Computing
To speak to our analyst for a discussion on the above findings, click Speak to Analyst
 Exclusive indicates content/data unique to MarketsandMarkets and not available with any competitors.
Table of Contents
1 Introduction (Page No. - 15)
1.1 Objectives of the Study
1.2 Market Definition
1.2.1 Inclusions and Exclusions
1.3 Market Scope
1.3.1 Market Segmentation
1.3.2 Regions Covered
1.4 Years Considered for the Study
1.5 Currency Considered
1.6 Stakeholders
2 Research Methodology (Page No. - 19)
2.1 Research Data
2.1.1 Secondary Data
2.1.2 Primary Data
2.2 Market Breakup and Data Triangulation
2.3 Market Size Estimation
2.3.1 Top-Down Approach
2.3.2 Bottom-Up Approach
2.4 Market Forecast
2.5 Competitive Leadership Mapping Research Methodology
2.6 Assumptions for the Study
2.7 Limitations of the Study
3 Executive Summary (Page No. - 26)
4 Premium Insights (Page No. - 29)
4.1 Attractive Opportunities in the Global Data Center Rack Server Market
4.2 Market By Tier Type, 2019 Vs. 2024
4.3 Market By Vertical, 2024
4.4 Market Investment Scenario (2019–2024)
5 Market Overview and Industry Trends (Page No. - 31)
5.1 Introduction
5.2 Market Dynamics
5.2.1 Drivers
5.2.1.1 Increasing Need for High-Density Servers
5.2.1.2 Lower Operating Cost
5.2.1.3 Advancement in Cloud-Computing Technology
5.2.2 Restraints
5.2.2.1 High Requirements for Supporting Equipment and Maintenance
5.2.2.2 Poor Cable Management
5.2.3 Opportunities
5.2.3.1 Growth in the Number of Data Centers
5.2.3.2 Hyperscale Transformation
5.2.4 Challenges
5.2.4.1 Maintaining Availability and Uptime
5.2.4.2 Challenges With Performance and HVAC
5.3 Industry Trends
5.3.1 Use Case 1: Improved Management Systems Through High-Performance Server
5.3.2 Use Case 2: Virtualized Server for Lower Cost and Improved Performance
5.3.3 Use Case 3: Deployment of Workstations With Servers to Support High-Performance Graphics Processor System
5.3.4 Use Case 4: Reliable Server Technology to Meet the Client’s Service Level Agreement
5.4 Future of Data Center and Its Impact on Rack Servers
5.4.1 Emergence of Internet of Things (IoT) and Its Impact on Data Center Rack Servers
5.4.2 Impact of Edge Computing on Data Center Rack Servers
6 Data Center Rack Server Market By Form Factor (Page No. - 38)
6.1 Introduction
6.2 1U
6.3 2U
6.4 4U
6.5 Others
7 Data Center Rack Server Market By Service (Page No. - 43)
7.1 Introduction
7.2 Design and Consulting
7.3 Installation and Deployment
7.4 Support and Maintenance
8 Data Center Rack Server Market By Tier Type (Page No. - 47)
8.1 Introduction
8.2 Tier 1
8.3 Tier 2
8.4 Tier 3
8.5 Tier 4
9 Data Center Rack Server Market By Data Center Type (Page No. - 52)
9.1 Introduction
9.2 Mid-Sized Data Centers
9.3 Enterprise Data Centers
9.4 Large Data Centers
10 Data Center Rack Server Market By Vertical (Page No. - 56)
10.1 Introduction
10.2 Government and Defense
10.3 Banking, Financial Services, and Insurance
10.4 IT and Telecom
10.5 Healthcare and Life Sciences
10.6 Research and Academia
10.7 Media and Entertainment
10.8 Retail and Ecommerce
10.9 Energy and Utilities
10.10 Others
11 Data Center Rack Server Market By Region (Page No. - 65)
11.1 Introduction
11.2 North America
11.2.1 United States
11.2.2 Canada
11.3 Europe
11.3.1 United Kingdom
11.3.2 Rest of Europe
11.4 Asia Pacific
11.4.1 China
11.4.2 Rest of Asia Pacific
11.5 Rest of the World
12 Competitive Landscape (Page No. - 96)
12.1 Competitive Leadership Mapping
12.1.1 Visionary Leaders
12.1.2 Dynamic Differentiators
12.1.3 Innovators
12.1.4 Emerging Companies
13 Company Profiles (Page No. - 98)
13.1 Introduction
(Business Overview, Products and Solutions Offered, Recent Developments & SWOT Analysis)*
13.2 HPE
13.3 Lenovo
13.4 Dell
13.5 Cisco Systems
13.6 Huawei
13.7 Oracle
13.8 Fujitsu
13.9 NEC Corporation
13.10 Rittal
13.11 Vertiv
13.12 Iron Systems
13.13 Quanta Computer Inc.
13.14 Black Box Corporation
13.15 Schneider Electric
13.16 Tripp Lite
13.17 Supermicro
13.18 Chatsworth Products
13.19 Belden Inc.
13.20 Asus
13.21 Inspur Systems Inc.
13.22 IBM
*Details on Business Overview, Products and Solutions Offered, Recent Developments & SWOT Analysis Might Not be Captured in Case of Unlisted Companies.
14 Appendix (Page No. - 127)
14.1 Discussion Guide
14.2 Knowledge Store: Marketsandmarkets’ Subscription Portal
14.3 Available Customizations
14.4 Related Reports
14.5 Author Details
List of Tables (85 Tables)
Table 1 United States Dollar Exchange Rate, 2016–2018
Table 2 Factor Analysis
Table 3 Data Center Rack Server Market Size, By Form Factor, 2017–2024 (USD Billion)
Table 4 1U Form Factor: Market Size By Region, 2017–2024 (USD Billion)
Table 5 2U Form Factor: Market Size By Region, 2017–2024 (USD Billion)
Table 6 4U Form Factor: Market Size By Region, 2017–2024 (USD Billion)
Table 7 Others: Market Size By Region, 2017–2024 (USD Billion)
Table 8 Data Center Rack Server Market Size, By Service, 2017–2024 (USD Billion)
Table 9 Design and Consulting: Market Size By Region, 2017–2024 (USD Billion)
Table 10 Installation and Deployment: Market Size By Region, 2017–2024 (USD Billion)
Table 11 Support and Maintenance: Market Size By Region, 2017–2024 (USD Billion)
Table 12 Data Center Rack Server Market Size, By Tier Type, 2017–2024 (USD Billion)
Table 13 Tier 1: Market Size By Region, 2017–2024 (USD Billion)
Table 14 Tier 2: Market Size By Region, 2017–2024 (USD Billion)
Table 15 Tier 3: Market Size By Region, 2017–2024 (USD Billion)
Table 16 Tier 4: Market Size By Region, 2017–2024 (USD Billion)
Table 17 Data Center Rack Server Market Size, By Data Center Type, 2017–2024 (USD Million)
Table 18 Mid-Sized Data Centers: Market Size By Region, 2017–2024 (USD Billion)
Table 19 Enterprise Data Centers: Market Size By Region, 2017–2024 (USD Billion)
Table 20 Large Data Centers: Market Size By Region, 2017–2024 (USD Billion)
Table 21 Global Data Center Rack Server Market Size, By Vertical, 2017–2024 (USD Billion)
Table 22 Government and Defense: Market Size By Region, 2017–2024 (USD Billion)
Table 23 Banking, Financial Services, and Insurance: Market Size By Region, 2017–2024 (USD Billion)
Table 24 IT and Telecom: Market Size By Region, 2017–2024 (USD Billion)
Table 25 Healthcare and Life Sciences: Market Size By Region, 2017–2024 (USD Billion)
Table 26 Research and Academia: Market Size By Region, 2017–2024 (USD Billion)
Table 27 Media and Entertainment: Market Size By Region, 2017–2024 (USD Billion)
Table 28 Retail and Ecommerce: Market Size By Region, 2017–2024 (USD Billion)
Table 29 Energy and Utilities: Market Size By Region, 2017–2024 (USD Billion)
Table 30 Others: Market Size By Region, 2017–2024 (USD Billion)
Table 31 Data Center Rack Server Market Size, By Region, 2017–2024 (USD Billion)
Table 32 North America: Market Size By Form Factor, 2017–2024 (USD Billion)
Table 33 North America: Market Size By Service, 2017–2024 (USD Billion)
Table 34 North America: Market Size By Tier Type, 2017–2024 (USD Billion)
Table 35 North America: Market Size By Data Center Type, 2017–2024 (USD Billion)
Table 36 North America: Market Size By Vertical, 2017–2024 (USD Billion)
Table 37 North America: Market Size By Country, 2017–2024 (USD Billion)
Table 38 United States: Data Center Rack Server Market Size, By Form Factor, 2017–2024 (USD Billion)
Table 39 United States: Market Size By Service, 2017–2024 (USD Billion)
Table 40 United States: Market Size By Tier Type, 2017–2024 (USD Billion)
Table 41 United States: Market Size By Data Center Type, 2017–2024 (USD Billion)
Table 42 United States: Market Size By Vertical, 2017–2024 (USD Billion)
Table 43 Canada: Data Center Rack Server Market Size, By Form Factor, 2017–2024 (USD Billion)
Table 44 Canada: Market Size By Service, 2017–2024 (USD Billion)
Table 45 Canada: Market Size By Tier Type, 2017–2024 (USD Billion)
Table 46 Canada: Market Size By Data Center Type, 2017–2024 (USD Billion)
Table 47 Canada: Market Size By Vertical, 2017–2024 (USD Billion)
Table 48 Europe: Data Center Rack Server Market Size, By Form Factor, 2017–2024 (USD Billion)
Table 49 Europe: Market Size By Service, 2017–2024 (USD Billion)
Table 50 Europe: Market Size By Tier Type, 2017–2024 (USD Billion)
Table 51 Europe: Market Size By Data Center Type, 2017–2024 (USD Billion)
Table 52 Europe: Market Size By Vertical, 2017–2024 (USD Billion)
Table 53 Europe: Market Size By Country, 2017–2024 (USD Billion)
Table 54 United Kingdom: Data Center Rack Server Market Size, By Form Factor, 2017–2024 (USD Billion)
Table 55 United Kingdom: Market Size By Service, 2017–2024 (USD Billion)
Table 56 United Kingdom: Market Size By Tier Type, 2017–2024 (USD Billion)
Table 57 United Kingdom: Market Size By Data Center Type, 2017–2024 (USD Billion)
Table 58 United Kingdom: Market Size By Vertical, 2017–2024 (USD Billion)
Table 59 Rest of Europe: Data Center Rack Server Market Size, By Form Factor, 2017–2024 (USD Billion)
Table 60 Rest of Europe: Market Size By Service, 2017–2024 (USD Billion)
Table 61 Rest of Europe: Market Size By Tier Type, 2017–2024 (USD Billion)
Table 62 Rest of Europe: Market Size By Data Center Type, 2017–2024 (USD Billion)
Table 63 Rest of Europe: Market Size By Vertical, 2017–2024 (USD Billion)
Table 64 Asia Pacific: Data Center Rack Server Market Size, By Form Factor, 2017–2024 (USD Billion)
Table 65 Asia Pacific: Market Size By Service, 2017–2024 (USD Billion)
Table 66 Asia Pacific: Market Size By Tier Type, 2017–2024 (USD Billion)
Table 67 Asia Pacific: Market Size By Data Center Type, 2017–2024 (USD Billion)
Table 68 Asia Pacific: Market Size By Vertical, 2017–2024 (USD Billion)
Table 69 Asia Pacific: Market Size By Country, 2017–2024 (USD Billion)
Table 70 China: Data Center Rack Server Market Size, By Form Factor, 2017–2024 (USD Billion)
Table 71 China: Market Size By Service, 2017–2024 (USD Billion)
Table 72 China: Market Size By Tier Type, 2017–2024 (USD Billion)
Table 73 China: Market Size By Data Center Type, 2017–2024 (USD Billion)
Table 74 China: Market Size By Vertical, 2017–2024 (USD Billion)
Table 75 Rest of Asia Pacific: Data Center Rack Server Market Size, By Form Factor, 2017–2024 (USD Billion)
Table 76 Rest of Asia Pacific: Market Size By Service, 2017–2024 (USD Billion)
Table 77 Rest of Asia Pacific: Market Size By Tier Type, 2017–2024 (USD Billion)
Table 78 Rest of Asia Pacific: Market Size By Data Center Type, 2017–2024 (USD Billion)
Table 79 Rest of Asia Pacific: Market Size By Vertical, 2017–2024 (USD Billion)
Table 80 Rest of the World: Data Center Rack Server Market Size, By Form Factor, 2017–2024 (USD Billion)
Table 81 Rest of the World: Market Size By Service, 2017–2024 (USD Billion)
Table 82 Rest of the World: Market Size By Tier Type, 2017–2024 (USD Billion)
Table 83 Rest of the World: Market Size By Data Center Type, 2017–2024 (USD Billion)
Table 84 Rest of the World: Market Size By Vertical, 2017–2024 (USD Billion)
Table 85 Evaluation Criteria
List of Figures (34 Figures)
Figure 1 Global Data Center Rack Server Market: Research Design
Figure 2 Breakup of Primary Profiles
Figure 3 Market: Top-Down and Bottom-Up Approaches
Figure 4 Competitive Leadership Mapping: Criteria Weightage
Figure 5 Market to Witness Significant Growth During the Forecast Period
Figure 6 Fastest Growing Segments in the Global Market in 2019
Figure 7 Data Center Rack Server Market: Regional Snapshot
Figure 8 Increasing Shift to Cloud-Based Technologies Driving the Global Data Center Rack Server Market
Figure 9 Tier 1 Segment to Hold the Highest Market Share During the Forecast Period
Figure 10 Banking, Financial Services, and Insurance to Lead the Market During the Forecast Period
Figure 11 Asia Pacific Considered as the Best Market to Invest During 2019–2024
Figure 12 Drivers, Restraints, Opportunities, and Challenges: Data Center Rack Server Market
Figure 13 2U Form Factor Segment to Dominate the Market During the Forecast Period
Figure 14 Installation and Deployment Segment to Dominate the Market During the Forecast Period
Figure 15 Tier 1 Segment to Dominate the Market During the Forecast Period
Figure 16 Mid-Sized Data Centers Segment to Grow at the Highest CAGR During the Forecast Period
Figure 17 Banking, Financial Services, and Insurance Vertical to Dominate the Data Center Rack Server Market During the Forecast Period
Figure 18 Asia Pacific to Grow at the Highest Growth Rate During the Forecast Period
Figure 19 North America: Market Snapshot
Figure 20 Asia Pacific: Market Snapshot
Figure 21 Data Center Rack Server Market (Global): Competitive Leadership Mapping, 2019
Figure 22 Hewlett Packard Enterprise: Company Snapshot
Figure 23 HPE: SWOT Analysis
Figure 24 Lenovo: Company Snapshot
Figure 25 Lenovo: SWOT Analysis
Figure 26 Dell: Company Snapshot
Figure 27 Dell: SWOT Analysis
Figure 28 Cisco Systems: Company Snapshot
Figure 29 Cisco: SWOT Analysis
Figure 30 Huawei: Company Snapshot
Figure 31 Huawei: SWOT Analysis
Figure 32 Oracle: Company Snapshot
Figure 33 Fujitsu: Company Snapshot
Figure 34 NEC Corporation: Company Snapshot
The study involved 4 major activities in estimating the current size of the data center rack server market. Exhaustive secondary research was done to collect information on the market, peer market, and parent market. The next step was to validate these findings, assumptions, and sizing with the industry experts across the value chain through primary research. Both top-down and bottom-up approaches were employed to estimate the complete market size. Thereafter, market breakup and data triangulation were used to estimate the market size of segments and subsegments.
Secondary Research
In the secondary research process, various secondary sources, such as Bloomberg and BusinessWeek, have been referred for, to identify and collect information for this study. The secondary sources included annual reports; press releases; and investor presentations of companies, white papers, and journals; and certified publications and articles from recognized authors, directories, and databases.
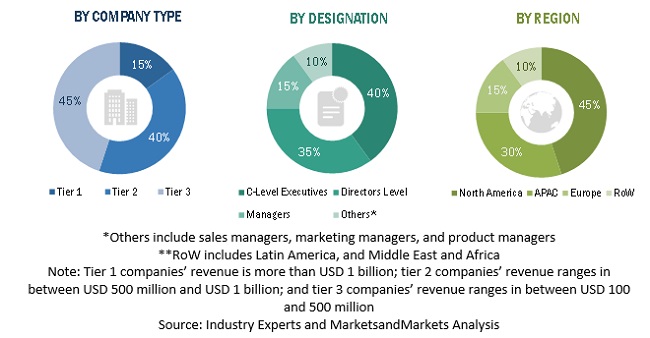
Primary Research
Various primary sources from both supply and demand sides were interviewed to obtain qualitative and quantitative information for this report. The primary sources from the supply side included industry experts, such as Chief Executive Officers (CEOs), Chief Marketing Officers (CMO), Vice Presidents (VPs), Managing Directors (MDs), technology and innovation directors, and related key executives from various key companies and organizations operating in the data center rack server market along with the associated service providers, and system integrators operating in the targeted regions. All possible parameters that affect the market covered in this research study have been accounted for, viewed in extensive detail, verified through primary research, and analyzed to get the final quantitative and qualitative data. Following is the breakup of primary respondents:
To know about the assumptions considered for the study, download the pdf brochure
Market Size Estimation
For making market estimates and forecasting the data center rack server market, and the other dependent submarkets, top-down and bottom-up approaches were used. The bottom-up procedure was used to arrive at the overall market size of the global data center rack server market using key companies’ revenue and their offerings in the market. The research methodology used to estimate the market size includes the following:
- The key players in the market have been identified through extensive secondary research.
- The market size, in terms of value, has been determined through primary and secondary research processes.
- All percentage shares, splits, and breakdowns have been determined using secondary sources and verified through primary sources.
Data Triangulation
With data triangulation and validation through primary interviews, the exact value of the overall parent market size was determined and confirmed using this study. The overall data center rack server market size was then used in the top-down procedure to estimate the size of other individual markets via percentage splits of the market segmentation.
Report Objectives
- To define, describe, and forecast the data center rack server market by form factor, service, tier type, data center type, vertical, and region
- To provide detailed information about the major factors (drivers, restraints, opportunities, and industry-specific challenges) influencing the growth of the market
- To analyze the market with respect to individual growth trends, prospects, and contributions to the market
- To forecast the market size of 4 main regions, namely, North America, Europe, Asia Pacific (APAC) and RoW
- To analyze the opportunities in the market for stakeholders by identifying the high-growth segments of the market
- To profile the key players in the data center rack server market and comprehensively analyze their core competencies in each subsegment
- To analyze the competitive developments, such as new product launches and product enhancements, partnerships, collaborations, and acquisitions
Available Customizations
With the given market data, MarketsandMarkets offers customizations as per the company’s specific needs. The following customization options are available for the report:
Company Information
- Detailed analysis and profiling of additional market players up to 5


Growth opportunities and latent adjacency in Data Center Rack Server Market