Connected Car Devices Market by Communication Type (V2V, V2I, V2P), Connectivity Type (DSRC, Cellular Network), Product Type (Das, Telematics), Vehicle Type (PC, LCV & HCV), Electric Vehicle Type (BEV, HEV, PHEV, FCV) and Region - Global Forecast to 2021


[303 Pages Report] The connected car devices market size was valued at USD 26.87 billion in 2017 and is expected to reach USD 57.15 billion by 2021, at a CAGR of 16.3% during the forecast period 2016 to 2021. The market is mainly driven by the legislations pertaining to vehicle safety, changing buyer preferences, increased demand for premium passenger cars, and electrification of vehicles across the globe. The base year considered for the study is 2015, and the forecast has been provided for the period between 2016 and 2021.
Market Dynamics
Drivers
- Industry compliance and government laws supporting connectivity and telematics in automobiles
- Increasing penetration of telecommunication services in automotive industry
- Intense competition among connected car manufacturers
Restraints
- Privacy issues related to data generated by the vehicles
- Lack of infrastructure to support connectivity
Opportunities
- Opportunity for non-automotive players to enter the automotive industry
- Opportunity for development of new business models
Challenges
- To integrate the cost of connectivity into the cost of vehicles
- Threat to safety and security of passengers
Increasing penetration of telecommunication services in automotive industry will boost the automotive connected car devices market
Demand for navigation services, increasing number of accidents, rising vehicle thefts, and security issues are the factors driving the adoption of telecom services in the automotive industry. Connecting a car with the network enables it to access many services such as safety, information, navigation, and remote diagnostics easily and efficiently. BMW offers integrated sim card services, which help to make calls and use the internet without connecting the cell phone to the vehicle. As the automotive industry offers a great opportunity for the telecom companies to invest and grow, this can lead to the growth of onboard internet services in automobiles.
The following are the major objectives of the study.
- To define and segment the connected car devices (CCD) market (2016–2021), by volume (‘000 units) and value (USD million)
- To provide a detailed analysis of various forces acting in the market (drivers, restraints, opportunities, and challenges)
- To analyze the regional markets for growth trends, prospects, and their contribution to the overall market
- To segment and forecast the size of the CCD market, by region into- North America, Europe, Asia-Pacific, and the Rest of the World (RoW)
- To segment and forecast the size of the CCD market, by communication type based on vehicle to vehicle, vehicle to infrastructure, vehicle to pedestrian and other communication types
- To segment and forecast the size of the CCD market, by product type based on driver assistance systems (DAS), telematics, and others
- To segment and forecast the size of the CCD market based on mode of connectivity into dedicated short-range communication (DSRC) and cellular network/Wi-Fi
- To segment and forecast the size of the CCD market, by vehicle type based on passenger car, light commercial vehicles, heavy commercial vehicles, and battery electric vehicles (BEV)
- To track and analyze competitive developments such as joint ventures, mergers & acquisitions, new product launches, expansions, and other activities carried out by key industry participants
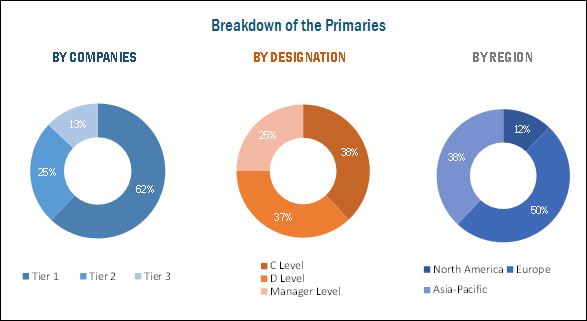
During this research study, major players operating in the connected car device market in various regions have been identified, and their offerings, regional presence, and distribution channels have been analyzed through in-depth discussions. Bottom-up approach has been used to determine the overall market size. Sizes of the other individual markets have been estimated using the percentage splits obtained through secondary sources such as Hoovers, Bloomberg BusinessWeek, and Factiva, along with primary respondents. The entire procedure includes the study of the annual and financial reports of the top market players and extensive interviews with industry experts such as CEOs, VPs, directors, and marketing executives for key insights (both qualitative and quantitative) pertaining to the market. The figure below shows the breakdown of the primaries on the basis of the company type, designation, and region considered during the research study.
To know about the assumptions considered for the study, download the pdf brochure
The connected car devices market comprises a network of players involved in the research and product development; raw material supply; component manufacturing; distribution and sale; and post-sales services. Key players considered in the analysis of the connected car market are Continental AG (Germany), Delphi Automotive (UK), Robert Bosch (Germany), and Denso Corporation (Japan), ZF Friedrichshafen AG (Germany) are some of the key players in the market.
Major Developments
- In November 2016, Continental Ag introduced a new product, multifunctional smart device terminal (MFST). It allows wireless charging of smartphone and operates a range of device functions in the vehicle safely and conveniently. MFST has been introduced in Mercedes-Benz E-Class sedan.
- In April 2017, Delphi automotive PLC acquires Movimento Inc. This development will help Delphi to provide Over-the-Air (OTA) upgrades to its software at any stage of the vehicle’s life cycle leading to increased efficiency of the vehicles connectivity system. This will also position Delphi as a leading end-to-end systems and software provider to the industry as vehicle connectivity becomes increasingly important.
- In November 2016, Denso has joined hands with Imagination Technologies to develop multithreaded CPU cores that enable a processor (CPU) to execute multiple processes concurrently. The multithreaded CPU's will help improve the efficiency of advanced electronic systems used in today’s car. This will help Denso to come up with more and more advanced safe and secure automotive technologies to strengthen its position in the automotive market.
Target Audience
- Connected car devices manufacturers
- Automotive electronic system manufacturers
- Vehicle manufacturers
- Investment firms
- Equity research firms
- Private equity firms
Report Scope
Market, By Communication
- Vehicle-to-Vehicle (V2V)
- Vehicle-to-Infrastructure (V2I)
- Vehicle-to-Pedestrian(V2P)
- Others (V2C, V2D, V2G)
Market, By Technology
-
Driver Assistance Systems
- Adaptive cruise control
- Lane departure warning
- Blind spot detection
- Road sign recognition
- Park assist
- Pedestrian detection system
- Telematics
- Others
Market, By Connectivity
- Dedicated Short Range Communication (DSRC)
- Long Range/ Cellular Network
Market, By Vehicle Type
- Passenger Cars
- Light Commercial Vehicles
- Heavy Commercial Vehicles
Market, By Region
- North America
- Europe
- Asia-Pacific
- Rest of the World (RoW)
Critical questions which the report answers
- Industry leaders are differentiating themselves by focusing more into future technologies to make their new revenue stream. What will be the most demanding future technology?
- Which are the key players in the market and how intense is the competition?
- Which connectivity mode will have major impact in connected car device market?
Available Customizations
Based on the given market data, MarketsandMarkets offers customizations in the reports as per the client’s specific requirements. The available customization options are as follows:
- Electric Vehicle Connected Car Devices Market, By Technology
- Additional Company Profiles
The major factors responsible for the growth of connected car devices market include the introduction of advance technologies such as adaptive cruise control and lane departure warning systems in premium and mid-segment cars and rising awareness about vehicle, driver, and pedestrian safety.
Devices used to communicate/exchange information about the vehicle with other entities such as vehicles, infrastructure, pedestrians, or cloud are called connected car devices. The systems falling under DAS (adaptive cruise control, blind spot detection systems and many more), telematics, and security systems which allow the vehicle to communicate and exchange information are considered as connected car devices. The connected devices allow V2V, V2P, V2I, and other type of communication.
The connected car devices market has been segmented, on the basis of connectivity mode, into Dedicated Short-Range Communication (DSRC) and cellular network/ Wi-Fi. The market for DSRC is expected to grow at the highest CAGR between 2016 and 2021. DSRC was developed majorly for application in the automobile sector. The main aim of developing this communication type was to prevent crashes and provide communication among vehicles (V2V), infrastructure (V2I), and passengers (V2P). The major applications of DSRC include e-parking, toll payment systems, blind spot detection systems, and collision warning system.
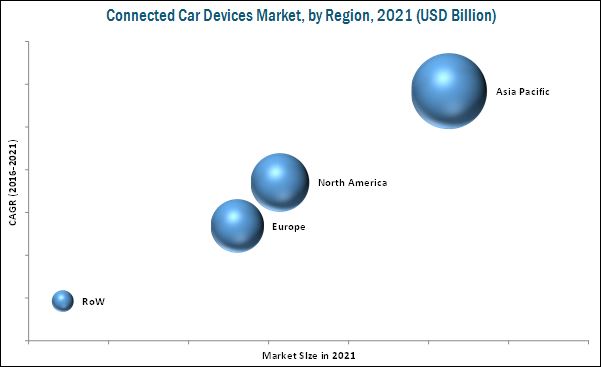
The Asia-Pacific region is projected to witness the highest CAGR from 2016 to 2021. The major factors responsible for this region’s growth include increasing demand for driver assistance systems and government laws favoring the implementations in passenger cars, especially in developed countries like Japan and South Korea. These two countries have vehicle safety regulations equally stringent as that of Europe and North America. Additionally, improving socio-economic conditions in countries such as India, Thailand, and Indonesia have resulted in the growth of demand for premium segment passenger cars, which in turn has accelerated the market for connected car devices in these countries.
Increasing penetration of telecommunication services in automotive industry drive the growth of reed sensor market
Vehicle to Vehicle
Vehicle-to-vehicle (V2V) is a technology that is designed to establish communication among automobiles. Vehicle-to-vehicle is a short range type of communication. This technology requires wireless transmission of data between vehicles. The main reason for the development of such technologies is to prevent accidents by allowing vehicles in transit to send position and speed data to one another over an ad-hoc mesh network.
Vehicle-to-Infrastructure
Vehicle-to-Infrastructure (V2I) is a technology that is designed to establish communication between vehicles and other entities such as roadside units, signs, and traffic lights. In V2I, the infrastructure plays a coordination role by gathering global or local information on traffic and road conditions and then suggesting or imposing certain behaviors on a group of vehicles. The basic components of a V2I communication system are On-Board Unit or Equipment (OBU or OBE), Roadside Unit or Equipment (RSU or RSE), and safe communication channel.
Vehicle-to-Pedestrian
Vehicle-to-Pedestrian (V2P) technology is used to establish communication between vehicles and pedestrians. This technology was developed to avoid the pedestrian fatalities. The V2P approach encompasses a broad set of road users including people walking, children being pushed in strollers, people using wheelchairs or other mobility devices, passengers embarking and disembarking buses and trains, and people riding bicycles. Most of the OEMs and Tier1 suppliers are working toward the development of such high-end technologies. Recently, Honda displayed its vehicle-to-pedestrian technology that will be implemented in its upcoming cars.
Critical questions the report answers:
- Software-defined-car offers opportunity to the traditional Tier-2 electronics suppliers to engage with OEMs as Tier-1 suppliers by leveraging software development for their electronics. What are the opportunities for these stakeholders in this ecosystem of connected car devices?
- Where will all the developments take the industry in the mid to long term?
The key factors restraining the growth of the connected car devices market is lack of infrastructure to support connectivity. The connected cars are majorly dependent on connectivity. Without proper connectivity, the car might lose its control and might even crash. The major functions such as navigation, infotainment, and emergency calling (E-call) depends on connectivity. Hence, lack of connectivity can lead to disastrous conditions in the case of connected cars. According to recent reports, telecom companies in India, Indonesia, China, and parts of South America are dealing with the problem of lack of infrastructure to support uninterrupted connectivity.
The major problem with the developing countries is a lack of infrastructure in the rural parts. The majority of the population in developing countries live in the rural parts, and thus the lack of infrastructure means lack of connectivity, which is one of the reasons for the lack of adoption of the connectivity services in these regions.
The global connected car devices market is dominated by key manufacturers such as Continental AG (Germany), Denso Corporation (Japan), Delphi Automotive, PLC (U.K.), Robert Bosch GmbH (Germany), and Autoliv Inc. (Sweden) among others. These players are increasingly undertaking mergers and acquisitions, and product launches to develop and introduce new technologies and products in the market.
To speak to our analyst for a discussion on the above findings, click Speak to Analyst
 Exclusive indicates content/data unique to MarketsandMarkets and not available with any competitors.
Table of Contents
1 Introduction (Page No. - 17)
1.1 Objectives
1.2 Connected Car DevicesMarket Scope
1.2.1 Markets Covered
1.2.2 Product Definition
1.2.3 Years Considered in the Report
1.3 Currency
1.3.1 Currency Exchange Rates of the Countries
1.4 Package Size
1.5 Limitations
1.6 Stakeholders
2 Research Methodology (Page No. - 21)
2.1 Research Data
2.2 Secondary Data
2.2.1 Key Secondary Sources
2.3 Data From Secondary Sources
2.4 Primary Data
2.4.1 Sampling Techniques & Data Collection Methods
2.4.2 Primary Participants
2.5 Factor Analysis
2.5.1 Introduction
2.5.2 Demand Side Analysis
2.5.2.1 Growing Information and Telecommunication Infrastructure is Increasing the Demand of Connected Car Devices Market
2.5.2.2 Growth in Luxury Vehicle Sales
2.5.3 Supply-Side Analysis
2.5.3.1 Technological Advancements
2.5.3.2 Need of Connectivity for Safety, Security, and Fuel Efficient Vehicles
2.5.4 Market Size Estimation
2.6 Data Triangulation
2.7 Assumptions
3 Executive Summary (Page No. - 30)
3.1 Introduction
4 Premium Insights (Page No. - 34)
4.1 Attractive Opportunities in the Connected Car Devices Market
4.2 Market, By Region & Communication Type, 2016
4.3 Regional Market Share of Market, 2016 vs 2021
4.4 Market, By Connectivity Mode
4.5 Market, By Vehicle Type
4.6 Market, By Technology
4.7 Introduction
4.8 Market Segmentation
4.8.1 Market, By Communication Type
4.8.2 Market, By Product Type
4.8.3 Market, By Mode of Connectivity
4.8.4 Market, By Region
4.8.5 Market, By Vehicle Type
4.8.6 Market, By Electric Vehicle Type
4.9 Market Dynamics
4.9.1 Drivers
4.9.1.1 Industry Compliance and Government Laws Supporting Connectivity and Telematics in Automobiles
4.9.1.2 Increasing Penetration of Telecommunication Services in Automotive Industry
4.9.1.3 Intense Competition Among Connected Car Manufacturers
4.9.2 Restraints
4.9.2.1 Privacy Issues Related to Data Generated By the Vehicles
4.9.2.2 Lack of Infrastructure to Support Connectivity
4.9.3 Opportunities
4.9.3.1 Opportunity for Non-Automotive Players to Enter the Automotive Industry
4.9.3.2 Opportunity for Development of New Business Models
4.9.4 Challenges
4.9.4.1 to Integrate the Cost of Connectivity Into the Cost of Vehicles
4.9.4.2 Threat to Safety and Security of Passengers
4.10 Porter’s Five Forces Analysis
4.10.1 Intensity of Competitive Rivalry
4.10.2 Threat of Substitutes
4.10.3 Bargaining Power of Buyers
4.10.4 Bargaining Power of Suppliers
4.10.5 Threat of New Entrants
5 Connected Car Devices Market, By Region (Page No. - 49)
5.1 Introduction
5.2 Asia-Pacific
5.2.1 China: Market Size
5.2.2 Japan: Market Size
5.2.3 India: Market Size
5.2.4 South Korea: Market Size
5.3 Europe
5.3.1 Germany: Market Size
5.3.2 France: Market Size
5.3.3 U.K.: Market Size
5.3.4 Spain: Market Size
5.4 North America
5.4.1 The U.S.: Market Size
5.4.2 Canada: Market Size
5.4.3 Mexico: Market Size
5.5 RoW
5.5.1 Russia: Market Size
5.5.2 Brazil: Market Size
6 Connected Car Devices Market, By Communication Type (Page No. - 71)
6.1 Introduction
6.2 Vehicle to Vehicle
6.3 Vehicle to Infrastructure
6.4 Vehicle to Pedestrian
6.5 Others
7 Connected Car Devices Market, By Connectivity Mode (Page No. - 78)
7.1 Introduction
7.1.1 Dedicated Short Range Communication
7.1.2 Cellular Network/Wi-Fi
8 Connected Car Devices Market, By Vehicle Type (Page No. - 89)
8.1 Introduction
8.1.1 Passenger Cars
8.2 Commercial Vehicles
8.2.1 Light Commercial Vehicles
8.2.2 Heavy Commercial Vehicles
9 Connected Car Devices Market, By Product Type (Page No. - 95)
9.1 Introduction
9.1.1 Driver Assistance System
9.1.2 Telematics
9.1.3 Others
10 Connected Car Devices Market, By Electric Vehicle Type (Page No. - 109)
10.1 Introduction
10.2 BEV
10.3 PHEV
10.4 HEV
10.5 FCEV
11 Competitive Landscape (Page No. - 116)
11.1 Introduction
11.1.1 Vanguards
11.1.2 Innovators
11.1.3 Dynamic
11.1.4 Emerging
11.2 Competitive Benchmarking
11.2.1 Product Offerings (For All 25 Companies)
11.2.2 Business Strategy (For All 25 Companies)
Top Companies Analyzed for This Study are – Robert Bosch GmbH, Panasonic Corporation,Continental AG, Denso Corporation, ZF Friedrichshafen AG, Valeo SA, Delphi Automotive PLC ,Infineon Technologies AG, Lear Corporation (Arada Systems) , Harman International Industries Inc., Pioneer Corporation, Trimble Inc., Takata Corporation, Nvidia Corporation, Garmin Ltd., Alpine Electronics, Inc., Tomtom N.V., Mobileye N.V., Verizon Communications, Inc., Magna International Inc., Aisin Seiki Co., Ltd, Qualcomm Inc., Autoliv Inc., NXP Semiconductors N.V., Visteon Corporation
12 Company Profiles (Page No. - 120)
(Business Overview, Product Offerings & Business Strategies, Key Insights, Recent Developments, MnM View)*
12.1 Continental AG
12.2 Delphi Automotive PLC
12.3 Denso Corporation
12.4 Robert Bosch GmbH
12.5 ZF Friedrichshafen AG
12.6 Autoliv, Inc.
12.7 Valeo S.A.
12.8 Visteon Corporation
12.9 Magna International, Inc.
12.10 Infineon Technologies AG
12.11 Harman International Industries, Incorporated
12.12 Panasonic Corporation
*Details on Business Overview, Product Offerings & Business Strategies, Key Insights, Recent Developments, MnM View Might Not Be Captured in Case of Unlisted Companies.
13 Appendix (Page No. - 163)
13.1 Discussion Guide
13.2 Knowledge Store: Marketsandmarkets’ Subscription Portal
13.3 Introducing RT: Real Time Market Intelligence
13.4 Available Customizations
13.5 Related Reports
13.6 Author Details
List of Tables (119 Tables)
Table 1 Connected Car Devices Market: Porter’s Five Forces Analysis
Table 2 Market, By Region, 2014–2021 (Million Units)
Table 3 Market, By Region, 2014–2021 (USD Billion)
Table 4 Asia-Pacific: Market, By Country, 2014–2021 (‘000 Units)
Table 5 Asia-Pacific:Market, By Country, 2014–2021 (USD Million)
Table 6 China: Market, By Product, 2014–2021 (‘000 Units)
Table 7 China: Market, By Product, 2014–2021 (USD Million)
Table 8 Japan: Market, By Product, 2014–2021 (‘000 Units)
Table 9 Japan: Market, By Product, 2014–2021 (USD Million)
Table 10 India: Market, By Product, 2014–2021 (‘000 Units)
Table 11 India: Market, By Product, 2014–2021 (USD Million)
Table 12 South Korea: Market, By Product, 2014–2021 (‘000 Units)
Table 13 South Korea: Market, By Product, 2014–2021 (USD Million)
Table 14 Europe: Market, By Country (‘000 Units)
Table 15 Europe: Market, By Country, 2014-2021 (USD Million)
Table 16 Germany: Market, By Product, 2014–2021 (‘000 Units)
Table 17 Germany:Market, By Product, 2014–2021 (USD Million)
Table 18 France: Market, By Product, 2014–2021 (‘000 Units)
Table 19 France: Market, By Product, 2014–2021 (USD Million)
Table 20 U.K.: Market, By Product, 2014–2021 (‘000 Units)
Table 21 U.K.: Market, By Product, 2014–2021 (USD Million)
Table 22 Spain: Market, By Product, 2014–2021 (‘000 Units)
Table 23 Spain: Market, By Product, 2014–2021 (USD Million)
Table 24 North America Market, By Country, 2014-2021 (‘000 Units)
Table 25 North America Market, By Country, 2014-2021 (USD Million)
Table 26 U.S.: Market, By Product, 2014-2021 (‘000 Units)
Table 27 U.S. Market, By Product, 2014-2021 (USD Million)
Table 28 Canada: Market, By Product, 2014-2021 (‘000 Units)
Table 29 Canada: Market, By Product, 2014-2021 (USD Million)
Table 30 Mexico: Market, By Product, 2014-2021 (‘000 Units)
Table 31 Mexico: Market, By Product, 2014-2021 (USD Million)
Table 32 RoW: Market, By Country, 2014-2021 (‘000 Units)
Table 33 RoW: Market, By Country, 2014-2021 (USD Million)
Table 34 Russia: Market, By Product, 2014-2021 (‘000 Units)
Table 35 Russia: Market, By Product, 2014-2021 (USD Million)
Table 36 Brazil: Market, By Product, 2014-2021 (‘000 Units)
Table 37 Brazil: Market, By Product, 2014-2021 (USD Million)
Table 38 Market Size, By Communication Type , 2014–2021 (Million Units)
Table 39 Market Size, By Communication Type, 2014–2021 (USD Billion)
Table 40 Vehicle-To-Vehicle Market Size, By Region, 2014–2021 (‘000 Units)
Table 41 Vehicle-To-Vehicle Market Size, By Region, 2014–2021 (USD Million)
Table 42 Vehicle-To-Infrastructure Market Size, By Region, 2014–2021 (‘000 Units)
Table 43 Vehicle-To-Infrastructure Market Size, By Region, 2014–2021 (USD Million)
Table 44 Vehicle-To-Pedestrian Market Size, By Region, 2014–2021 (‘000 Units)
Table 45 Vehicle-To-Pedestrian Market Size, By Region, 2014–2021 (USD Million)
Table 46 Other Market Size, By Region, 2014–2021 (‘000 Units)
Table 47 Other Market Size, By Region, 2014–2021 (USD Million)
Table 48 Market Size, By Connectivity Mode , 2014–2021 (Million Units)
Table 49 Market Size, By Connectivity Mode, 2014–2021 (USD Billion)
Table 50 DSRC Market Size, By Region, 2014–2021 (‘000 Units)
Table 51 Market Size, By Region, 2014–2021 (USD Million)
Table 52 Market Size, By Country (Asia-Pacific), 2014–2021 (‘000 Units)
Table 53 Market Size, By Country (Asia-Pacific), 2014–2021 (USD Million)
Table 54 Market Size, By Country (Europe), 2014–2021 (‘000 Units)
Table 55 Market Size, By Country (Europe), 2014–2021 (USD Million)
Table 56 Market Size, By Country (North America), 2014–2021 (‘000 Units)
Table 57 Market Size, By Country (North America), 2014–2021 (USD Million)
Table 58 Market Size, By Country (RoW), 2014–2021 (‘000 Units)
Table 59 Market Size, By Country (RoW), 2014–2021 (USD Million)
Table 60 Cellular Network/Wi-Fi Market Size, By Region, 2014–2021 (‘000 Units)
Table 61 Market Size, By Region, 2014–2021 (USD Million)
Table 62 Market Size, By Country (APAC), 2014–2021 (‘000 Units)
Table 63 Market Size, By Country (APAC), 2014–2021 (USD Million)
Table 64 Market Size, By Country (Europe), 2014–2021 (‘000 Units)
Table 65 Market Size, By Country (Europe), 2014–2021 (USD Million)
Table 66 Market Size, By Country (North America), 2014–2021 (‘000 Units)
Table 67 Market Size, By Country (North America), 2014–2021 (USD Million)
Table 68 Market Size, By Country (RoW), 2014–2021 (‘000 Units)
Table 69 Market Size, By Country (RoW), 2014–2021 (USD Million)
Table 70 Market Size, By Vehicle Type, 2014–2021 (‘000 Units)
Table 71 Market Size, By Vehicle Type, 2014–2021 (USD Million)
Table 72 Passenger Cars Market Size, By Region, 2014–2021 (‘000 Units)
Table 73 Passenger Cars Market Size, By Region, 2014–2021 (USD Million)
Table 74 Light Commercial Vehicles Market Size, By Region, 2014–2021 (‘000 Units)
Table 75 Light Commercial Vehicles Market Size, By Region, 2014–2021 (USD Million)
Table 76 Heavy Commercial Vehicles Market Size, By Region, 2014–2021 (‘000 Units)
Table 77 Heavy Commercial Vehicles Market Size, By Region, 2014–2021 (USD Million)
Table 78 Market Size, By Product Type, 2014–2021 (Million Units)
Table 79 Market Size, By Product Type, 2014–2021 (USD Billion)
Table 80 Driver Assistance System Market Size, By Region, 2014–2021 (‘000 Units)
Table 81 Market Size, By Region, 2014–2021 (USD Million)
Table 82 Market Size, By Country (Asia-Pacific) , 2014–2021 (‘000 Units)
Table 83 Market Size, By Country (Asia-Pacific), 2014–2021 (USD Million)
Table 84 Market Size, By Country (Europe) , 2014–2021 (‘000 Units)
Table 85 Market Size, By Country (Europe), 2014–2021 (USD Million)
Table 86 Market Size, By Country (North America) , 2014–2021 (‘000 Units)
Table 87 Market Size, By Country (North America), 2014–2021 (USD Million)
Table 88 Market Size, By Country (RoW) , 2014–2021 (‘000 Units)
Table 89 Market Size, By Country (RoW), 2014–2021 (USD Million)
Table 90 Telematics Market Size, By Region, 2014–2021 (‘000 Units)
Table 91 Market Size, By Region, 2014–2021 (USD Million)
Table 92 Market Size, By Country (Asia-Pacific) , 2014–2021 (‘000 Units)
Table 93 Market Size, By Country (Asia-Pacific), 2014–2021 (USD Million)
Table 94 Market Size, By Country (Europe) , 2014–2021 (‘000 Units)
Table 95 Market Size, By Country (Europe), 2014–2021 (USD Million)
Table 96 Market Size, By Country (North America) , 2014–2021 (‘000 Units)
Table 97 Market Size, By Country (North America), 2014–2021 (USD Million)
Table 98 Market Size, By Country (RoW) , 2014–2021 (‘000 Units)
Table 99 Market Size, By Country (RoW), 2014–2021 (USD Million)
Table 100 Others Market Size, By Region, 2014–2021 (‘000 Units)
Table 101 Market Size, By Region, 2014–2021 (USD Million)
Table 102 Market Size, By Country (Asia-Pacific) , 2014–2021 (‘000 Units)
Table 103 Market Size, By Country (Asia-Pacific), 2014–2021 (USD Million)
Table 104 Market Size, By Country (Europe) , 2014–2021 (‘000 Units)
Table 105 Market Size, By Country (Europe), 2014–2021 (USD Million)
Table 106 Market Size, By Country (North America) , 2014–2021 (‘000 Units)
Table 107 Market Size, By Country (North America), 2014–2021 (USD Million)
Table 108 Market Size, By Country (RoW) , 2014–2021 (‘000 Units)
Table 109 Market Size, By Country (RoW), 2014–2021 (USD Million)
Table 110 Global Connected Car Devices Market, By Electric Vehicle Type, 2014–2021 (Units)
Table 111 Global Market, By Electric Vehicle Type, 2014–2021 (USD Million)
Table 112 BEV: Market,By Region, 2014–2021 (Units)
Table 113 BEV: Market, By Region, 2014–2021 (USD Million)
Table 114 PHEV: Market, By Region, 2014–2021 (Units)
Table 115 PHEV: Market, By Region, 2014–2021 (USD Million)
Table 116 HEV: Market, By Region, 2014–2021 (Units)
Table 117 HEV: Market, By Region, 2014–2021 (USD Million)
Table 118 FCEV: Market, By Region, 2014–2021 ( Units)
Table 119 FCEV: Market, By Region, 2014–2021 (‘000 USD)
List of Figures (75 Figures)
Figure 1 Research Design
Figure 2 Research Methodology Model
Figure 3 Breakdown of Primary Interviews: By Company Type, Designation, & Region
Figure 4 Global Luxury Vehicle Y-O-Y Sales Trend (2011-2015)
Figure 5 Connected Car Devices Market Size Estimation Methodology: Bottom-Up Approach
Figure 6 Asia-Pacific Estimated to Be the Largest Market for Connected Car Devices, 2016 vs 2021 (USD Billion)
Figure 7 Others (Vehicle to Cloud and Vehicle to Device and Vehicle to Infrastructure) to Hold the Largest Share in the Market, 2016 vs 2021 (USD Billion)
Figure 8 Telematics Systems to Dominate the Market, 2016 vs 2021 (USD Billion)
Figure 9 Passenger Cars Segment to Dominate the Market, 2016 vs 2021 (USD Billion)
Figure 10 Government Regulations & Changing Preferences of Buyers Expected to Drive the Demand for Connected Car Devices Market
Figure 11 Asia-Pacific to Dominate the Market in 2016
Figure 12 Asia-Pacific to Hold the Largest Share, By Volume, of the Market, 2016–2021
Figure 13 Cellular Network/Wi-Fi to Dominate the Market in 2016
Figure 14 Passenger Cars to Hold the Largest Share in the Market in 2016
Figure 15 Telematics System to Hold the Largest Market Share, in 2016
Figure 16 Market Segmentation
Figure 17 Market, By Technology
Figure 18 Market, By Product Type
Figure 19 Market, By Mode of Connectivity
Figure 20 Market, By Region
Figure 21 Market, By Vehicle Type
Figure 22 Market, By Electric Vehicle Type
Figure 23 Market: Market Dynamics
Figure 24 Market: Porter's Five Forces Analysis
Figure 25 Threat of New Entrants in Market is High
Figure 26 New Product Launch and Innovation in Markets Leads to High Competition in the CCD Market
Figure 27 Limited Availability of Substitutes Makes the Threat of Substitute Low
Figure 28 The Buyer Bargaining Power is High as Lots of New and Innovative Products are Being Launched
Figure 29 Technology Factor and Government Regulations Makes the Bargaining Power of Suppliers Medium
Figure 30 Technology Firms Trying to Enter the CCD Market are Making the Threat of New Entrants High
Figure 31 Market Outlook, By Region (USD Billion)
Figure 32 Asia-Pacific: Market Snapshot
Figure 33 North America: Market Snapshot
Figure 34 Market, By Communication Type, 2016 vs 2021 (USD Million)
Figure 35 Market, By Connectivity Mode, 2016 vs 2021 (USD Million)
Figure 36 Market, By Vehicle Type, 2016 vs 2021 (USD Million
Figure 37 Market, By Product Type, 2016 vs 2021 (USD Million)
Figure 38 Market, By Electric Vehicle Type, 2016 vs 2021 (USD Million)
Figure 39 Dive Chart
Figure 40 Continental AG: Company Snapshot (2015)
Figure 41 Continental AG: Product Offering Scorecard
Figure 42 Continental AG: Business Strategy Scorecard
Figure 43 Delphi Automotive PLC: Company Snapshot (2015)
Figure 44 Delphi Automotive PLC: Product Offering Scorecard
Figure 45 Delphi Automotive PLC: Business Strategy Scorecard
Figure 46 Denso Corporation: Company Snapshot (2015)
Figure 47 Denso Corporation: Product Offering Scorecard
Figure 48 Denso Corporation: Business Strategy Scorecard
Figure 49 Robert Bosch GmbH: Company Snapshot (2015)
Figure 50 Robert Bosch GmbH: Product Offering Scorecard
Figure 51 Robert Bosch GmbH: Business Strategy Scorecard
Figure 52 ZF Friedrichshafen AG: Company Snapshot (2015)
Figure 53 ZF Friedrichshafen AG: Product Offering Scorecard
Figure 54 ZF Friedrichshafen AG: Business Strategy Scorecard
Figure 55 Autoliv, Inc.: Company Snapshot (2015)
Figure 56 Autoliv, Inc.: Product Offering Scorecard
Figure 57 Autoliv, Inc.: Business Strategy Scorecard
Figure 58 Valeo S.A.: Company Snapshot (2015)
Figure 59 Valeo S.A.: Product Offering Scorecard
Figure 60 Valeo S.A.: Business Strategy Scorecard
Figure 61 Visteon Corp.: Company Snapshot (2015)
Figure 62 Visteon Corp.: Product Offering Scorecard
Figure 63 Visteon Corp.: Business Strategy Scorecard
Figure 64 Magna International, Inc.: Company Snapshot (2015)
Figure 65 Magna International, Inc.: Product Offering Scorecard
Figure 66 Magna International, Inc.: Business Strategy Scorecard
Figure 67 Infineon Technologies AG: Company Snapshot (2015)
Figure 68 Infineon Technologies AG: Product Offering Scorecard
Figure 69 Infineon Technologies AG: Business Strategy Scorecard
Figure 70 Harman International Industries, Incorporated: Company Snapshot (2015)
Figure 71 Harman International Industries, Incorporated: Product Offering Scorecard
Figure 72 Harman International Industries, Incorporated: Business Strategy Scorecard
Figure 73 Panasonic Corporation: Company Snapshot (2015)
Figure 74 Panasonic Corporation: Product Offering Scorecard
Figure 75 Panasonic Corporation: Business Strategy Scorecard


Growth opportunities and latent adjacency in Connected Car Devices Market
I WOULD LIKE TO KNOW IF YOU HAVE REPORT ABOUT PORTUGAL AMRFKET IN LAST 5 YEARS TILL 2018 SPLIT BY SEGMENTS AND PRODUCTS (ELECTRIC, GAZ, DIESEL ETC)