Composite Coatings Market by Technique (Laser Melt Injection, Brazing, Electroless Plating), Application (Anti-Corrosion, UV Protection, Thermal Protection), End-Use Industry, Region - Global Forecast to 2022


The composite coatings market is projected to reach USD 1,306.8 Million by 2022, at a CAGR of 7.7%. Composite coatings are increasingly crucial in the aerospace & defense, transportation, industrial, and oil & gas industries due to their superior properties which provide anti-corrosion, self-lubrication, UV protection, chemical resistance, thermal protection, and so on. In this study, the years considered to estimate the market size of composite coatings are:
- Base Year – 2016
- Estimated Year – 2017
- Projected Year – 2022
- Forecast Period – 2017 to 2022
2016 has been considered the base year for company profiles. Whenever information was unavailable for the base year, the prior year has been considered.
Composite Coatings Market Report Objectives of the Study
- To define, describe, and forecast the composite coatings market size, in terms of value
- To identify and measure the composite coatings market by technique, application, end-use industry, and region
- To analyze significant region-specific market trends in North America, Europe, the Asia-Pacific region, Latin America and Middle East & Africa (ME&A) and country-specific trends in the U.S., Canada, Germany, France, U.K., Austria, China, India, Japan, South Korea, Israel, UAE, Saudi Arabia, Mexico, Brazil, and others. To provide detailed information regarding the major factors influencing the growth of the composite coatings market ( drivers, restraints, opportunities, industry-specific challenges, and burning issues)
- To strategically profile and analyze the key market players and their core competencies
- To analyze recent market developments such as agreements, acquisitions, and expansions in the composite coatings market
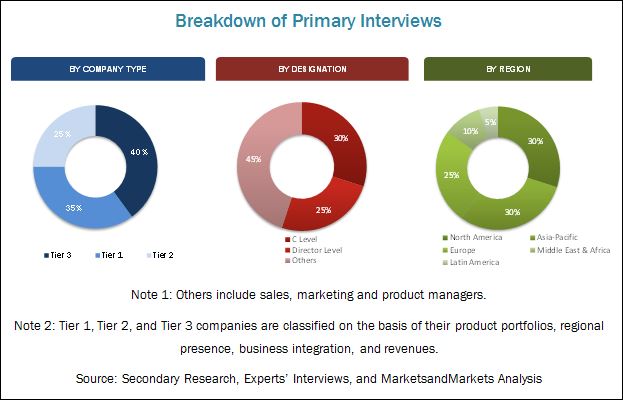
Various secondary sources such as company websites, encyclopedias, directories, and databases such as Composite World, Factiva, and American Composites Manufacturers Association, and so on have been used to understand and gain insights into the composite coatings market. Experts from top composite coatings companies have been interviewed to verify and collect critical information and to assess the trends in the composite coatings market for the forecast period. The top-down, bottom-up, and data triangulation approaches have been implemented to calculate the exact values of the overall parent and individual market sizes.
To know about the assumptions considered for the study, download the pdf brochure
Key Players in Composite Coatings Market
The composite coatings market has a diversified ecosystem, including downstream stakeholders such as manufacturers, vendors, end-use industries, and government organizations. The composite coatings value chain includes resin manufacturers such as Arkema (France), Mitsubishi Plastics, Inc. (Japan), Huntsman Corporation (U.S), and others. Further, the manufacturers of composite coatings supply their products to various entities for aerospace & defense, transportation, industrial, and oil & gas, among other applications.
This study focuses on the top investment pockets, which would help stakeholders understand and analyze the emerging trends in the composite coatings market. These stakeholders include:
- Composite coating manufacturers
- Raw material suppliers
- Distributors and suppliers
- End-use industries
- Industry associations
- R&D institutions
- Environment support agencies
Composite Coatings Market Report Scope
This research report categorizes the composite coatings market based on product type, application, and region. It forecasts revenue growth and analyzes trends in each of the submarkets till 2021.
On the Basis of Technique,
- Laser Melt Injection
- Brazing
- Electroless Plating
- Others
On the Basis of Application,
- Anti-Corrosion
- UV Protection
- Thermal Protection
- Others
On the basis of End-Use Industries,
- Aerospace & Defense
- Transportation
- Industrial
- Oil & Gas
- Others
On the Basis of Region,
- North America
- Europe
- Asia-Pacific
- Middle East & Africa
- Latin America
Composite Coatings Market Report Available Customizations
With the given market data, MarketsandMarkets offers customizations according to the specific needs of the companies. The following customization options are available for the report:
Composite Coatings Market Product Analysis
- Product matrix, which gives a detailed comparison of the product portfolio of each company
Composite Coatings Market Regional Analysis
- Further breakdown of the North American composite coatings market
- Further breakdown of the European composite coatings market
- Further breakdown of the Asia-Pacific region composite coatings market
- Further breakdown of the Middle Eastern & African composite coatings market
- Further breakdown of the Latin American composite coatings market
Composite Coatings Market Company Information
Detailed analysis and profiles of additional market players
The global composite coatings market is projected to reach USD 1,306.8 Million by 2022, at a CAGR of 7.7%, from 2017 to 2022. Increasing demand for composite coatings for anti-corrosion and self-lubrication in the transportation industry and anti-corrosion and chemical resistance in the oil & gas industry are the key factors leading to the growth of the composite coatings market.
The composite coatings market, by application, is further segmented into anti-corrosion, UV protection, thermal protection, and others. Composite coatings for the anti-corrosion application comprise a major market share due to their properties such as uniform coating thickness, accuracy, and consistency, and so on. Due to these features, they are utilized in large volumes in industries such as transportation, industrial, and oil & gas.
The major end-use industries in the composite coatings market include transportation, aerospace & defense, oil & gas, industrial, and others. The transportation end-use industry is the fastest-growing segment in the composite coatings market. Composite coatings offer various features including uniform coating thickness, accuracy, stiffness, and consistency in comparison to powder coatings, due to which these are utilized in the transportation, oil & gas, and industrial end-use industries.
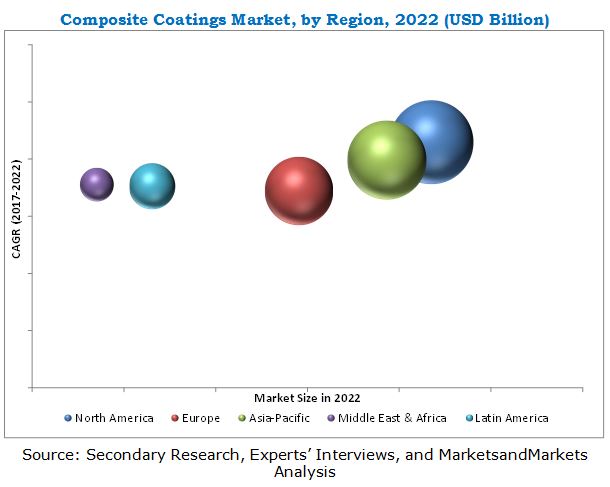
North America is expected to be the fastest-growing market for composite coatings during the next five years. The main factors that are leading to its growth are, the increasing demand from the transportation and aerospace & defense industries. These advanced coatings are utilized for the different equipment used in these industries as these provide uniform coating thickness, accuracy, stiffness, and consistency, leading to the low maintenance cost required.
The global composite coatings market is rapidly growing, in terms of value. However, a few factors act as restraints in its growth in the global composite coatings market. The high production cost is a major restraint in the growth of the global composite coatings market.
Key Composite Coatings Market Industry Players
Companies such as PPG Industries, Inc. (U.S.), Axalta (U.S.), Mader Group (France), A.W. Chesterton Company (U.S.), K C Jones Plating Company (U.S.), Om Sangyo Co. Ltd. (Japan), Endura Coatings (U.S.), Twin City Plating (U.S.), Aztron Technologies LLC (U.S.), Nickel Composite Coating Inc. (U.S.), Surteckariya Co. Ltd. (Japan) and others are the leading market players in the global composite coatings market. They have been adopting various organic and inorganic growth strategies such as agreements, acquisitions, and expansions to enhance their shares in the global composite coatings market.
To speak to our analyst for a discussion on the above findings, click Speak to Analyst
 Exclusive indicates content/data unique to MarketsandMarkets and not available with any competitors.
Table of Contents
1 Introduction (Page No. - 15)
1.1 Objectives of the Study
1.2 Market Definition
1.3 Market Scope
1.3.1 Years Considered for the Study
1.4 Currency
1.5 Limitations
1.6 Stakeholders
2 Research Methodology (Page No. - 18)
2.1 Research Data
2.1.1 Secondary Data
2.1.1.1 Key Data From Secondary Sources
2.1.2 Primary Data
2.1.2.1 Key Data From Primary Sources
2.1.2.2 Key Industry Insights
2.1.2.3 Breakdown of Primary Interviews
2.2 Market Size Estimation
2.2.1 Bottom-Up Approach
2.2.2 Top-Down Approach
2.3 Data Triangulation
2.4 Research Assumptions
3 Executive Summary (Page No. - 27)
4 Premium Insights (Page No. - 31)
4.1 Significant Opportunities in the Composite Coatings Market
4.2 Composite Coatings Market, By Application
4.3 Composite Coatings Market, By End-Use Industry and Region
4.4 Composite Coatings Market Share, By Country
5 Market Overview (Page No. - 34)
5.1 Introduction
5.2 Market Dynamics
5.2.1 Drivers
5.2.1.1 High Demand of Composite Coating for Anti-Corrosion and Self-Lubrication in Transportation and Infrastructure Industries
5.2.1.2 Increasing Demand of Composite Coating for Anti-Corrosion and Chemical Resistance in Oil & Gas Industry
5.2.2 Restraints
5.2.2.1 High Processing Cost
5.2.3 Opportunities
5.2.3.1 Budding Wind Energy Industry
5.2.4 Challenges
5.2.4.1 Need for Continuous Improvement in Product Offering
5.3 Porter’s Five Forces Analysis
5.3.1 Threat of New Entrants
5.3.2 Threat of Substitutes
5.3.3 Bargaining Power of Suppliers
5.3.4 Bargaining Power of Buyers
5.3.5 Intensity of Competitive Rivalry
6 Macroeconomic Overview and Key Trends (Page No. - 41)
6.1 Introduction
6.2 Trends and Forecast of GDP
6.3 Trends in Aerospace Industry
7 Composite Coatings Market, By Technique (Page No. - 44)
7.1 Introduction
7.2 Laser Melt Injection
7.3 Brazing
7.4 Electroless Plating
7.5 Others
7.5.1 Laser Cladding
7.5.2 Electrochemical
8 Composite Coatings Market, By Application (Page No. - 48)
8.1 Introduction
8.2 Anti-Corrosion
8.3 UV Protection
8.4 Thermal Protection
8.5 Others
9 Composite Coatings Market, By End-Use Industry (Page No. - 51)
9.1 Introduction
9.2 Transportation
9.3 Aerospace and Defense
9.4 Industrial
9.4.1 Medical
9.4.2 Food Industry
9.5 Oil & Gas
9.6 Others
9.6.1 Marine
9.6.2 Wind
10 Regional Analysis (Page No. - 59)
10.1 Introduction
10.2 North America
10.2.1 By End-Use Industry
10.2.2 By Application
10.2.3 By Country
10.2.4 U.S.
10.2.4.1 By End-Use Industry
10.2.4.2 By Application
10.2.5 Canada
10.2.5.1 By End-Use Industry
10.2.5.2 By Application
10.3 Europe
10.3.1 By End-Use Industry
10.3.2 By Application
10.3.3 By Country
10.3.4 Germany
10.3.4.1 By End-Use Industry
10.3.4.2 By Application
10.3.5 France
10.3.5.1 By End-Use Industry
10.3.5.2 By Application
10.3.6 U.K.
10.3.6.1 By End-Use Industry
10.3.6.2 By Application
10.3.7 Italy
10.3.7.1 By End-Use Industry
10.3.7.2 By Application
10.3.8 Austria
10.3.8.1 By End-Use Industry
10.3.8.2 By Application
10.3.9 Turkey
10.3.9.1 By End-Use Industry
10.3.9.2 By Application
10.3.10 Rest of Europe
10.4 Asia-Pacific
10.4.1 By End-Use Industry
10.4.2 By Application
10.4.3 By Country
10.4.4 China
10.4.4.1 By End-Use Industry
10.4.4.2 By Application
10.4.5 India
10.4.5.1 By End-Use Industry
10.4.5.2 By Application
10.4.6 Japan
10.4.6.1 By End-Use Industry
10.4.6.2 By Application
10.4.7 South Korea
10.4.7.1 By End-Use Industry
10.4.7.2 By Application
10.4.8 Indonesia
10.4.8.1 By End-Use Industry
10.4.8.2 By Application
10.4.9 Rest of Asia-Pacific
10.5 Middle East & Africa
10.5.1 By End-Use Industry
10.5.2 By Application
10.5.3 By Country
10.5.4 Israel
10.5.4.1 By End-Use Industry
10.5.4.2 By Application
10.5.5 Qatar
10.5.5.1 By End-Use Industry
10.5.5.2 By Application
10.5.6 UAE
10.5.6.1 By End-Use Industry
10.5.6.2 By Application
10.5.7 South Africa
10.5.7.1 By End-Use Industry
10.5.7.2 By Application
10.5.8 Saudi Arabia
10.5.8.1 By End-Use Industry
10.5.8.2 By Application
10.6 Latin America
10.6.1 By End-Use Industry
10.6.2 By Application
10.6.3 By Country
10.6.4 Brazil
10.6.4.1 By End-Use Industry
10.6.4.2 By Application
10.6.5 Mexico
10.6.5.1 By End-Use Industry
10.6.5.2 By Application
11 Competitive Landscape (Page No. - 94)
11.1 Introduction
11.1.1 Dynamic
11.1.2 Innovators
11.1.3 Vanguard
11.1.4 Emerging Companies
11.2 Competitive Benchmarking
11.3 Competitive Benchmarking
11.3.1 Product Offerings
11.3.2 Business Strategy
11.4 Market Ranking of Key Players
11.4.1 Market Ranking of Top 5 Players in Global Composite Coatings Market
12 Company Profiles (Page No. - 99)
(Overview, Financial*, Products & Services, Strategy, and Developments)
12.1 PPG Industries, Inc.
12.2 Axalta Coating Systems, LLC
12.3 Mader Group
12.4 A.W. Chesterton Company
12.5 KC Jones Plating Company
12.6 OM Sangyo Co., Ltd.
12.7 Poeton Industries Ltd.
12.8 Endura Coatings
12.9 Twin City Plating
12.10 Aztron Technologies, LLC
12.11 Nickel Composite Coatings, Inc.
12.12 Surteckariya Co., Ltd.
12.13 Other Key Players
12.13.1 Sharretts Plating Company
12.13.2 Electrochem
12.13.3 Interpalte Ltd.
12.13.4 Composite Coating Inc.
12.13.5 Walter Hunger GmbH & Co. Kg
12.13.6 NEI Corporation
12.13.7 Verometal
12.13.8 Advanced Surface Technologies, Inc.
12.13.9 Laser Applied Surface Engineering Ltd.
12.13.10 Microplating, Inc.
12.13.11 Monroe Plating
*Details Might Not Be Captured in Case of Unlisted Companies
13 Appendix (Page No. - 127)
13.1 Insights From Industry Experts
13.2 Discussion Guide
13.3 Knowledge Store: Marketsandmarkets Subscription Portal
13.4 Introducing RT: Real Time Market Intelligence
13.5 Available Customizations
13.6 Related Reports
13.7 Author Details
List of Tables (68 Tables)
Table 1 Trends and Forecast of GDP, 2016–2022 (USD Billion)
Table 2 Number of New Airplane Deliveries, 2016
Table 3 Composite Coatings Market Size, By Technique, 2015–2022 (USD Million)
Table 4 Composite Coatings Techniques Comparison Chart
Table 5 Market Size, By Application, 2015–2022 (USD Million)
Table 6 Nano-Particles for Composite Coatings Application
Table 7 Market Size, By End-Use Industry, 2015–2022 (USD Million)
Table 8 Market Size in Transportation End-Use Industry, By Region, 2015–2022 (USD Million)
Table 9 Market Size in Aerospace & Defense End-Use Industry, By Region, 2015–2022 (USD Million)
Table 10 Market Size in Industrial End-Use Industry, By Region, 2015–2022 (USD Million)
Table 11 Market Size in Oil & Gas End-Use Industry, By Region, 2015–2022 (USD Million)
Table 12 Market Size in Other End-Use Industry, By Region, 2015–2022 (USD Million)
Table 13 Market Size, By Region, 2015–2022 (USD Million)
Table 14 North America: Market Size, By End-Use Industry, 2015–2022 (USD Million)
Table 15 North America: Market Size, By Application, 2015–2022 (USD Million)
Table 16 North America: Market Size, By Country, 2015–2022 (USD Million)
Table 17 U.S.: Market Size, By End-Use Industry, 2015–2022 (USD Million)
Table 18 U.S.: Market Size, By Application, 2015–2022 (USD Million)
Table 19 Canada: Market Size, By End-Use Industry, 2015–2022 (USD Million)
Table 20 Canada: Market Size, By Application, 2015–2022 (USD Million)
Table 21 Europe: Market Size, By End-Use Industry, 2015–2022 (USD Million)
Table 22 Europe: Market Size, By Application, 2015–2022 (USD Million)
Table 23 Europe: Market Size, By Country, 2015–2022 (USD Million)
Table 24 Germany: Market Size, By End-Use Industry, 2015–2022 (USD Million)
Table 25 Germany: Market Size, By Application, 2015–2022 (USD Million)
Table 26 France: Market Size, By End-Use Industry, 2015–2022 (USD Million)
Table 27 France: Market Size, By Application, 2015–2022 (USD Million)
Table 28 U.K.: Market Size, By End-Use Industry, 2015–2022 (USD Million)
Table 29 U.K.: Market Size, By Application, 2015–2022 (USD Million)
Table 30 Italy: Market Size, By End-Use Industry, 2015–2022 (USD Million)
Table 31 Italy: Market Size, By Application, 2015–2022 (USD Million)
Table 32 Austria: Market Size, By End-Use Industry, 2015–2022 (USD Million)
Table 33 Austria: Market Size, By Application, 2015–2022 (USD Million)
Table 34 Turkey: Market Size, By End-Use Industry, 2015–2022 (USD Million)
Table 35 Turkey: Market Size, By Application, 2015–2022 (USD Million)
Table 36 Asia-Pacific: Market Size, By End-Use Industry, 2015–2022 (USD Million)
Table 37 Asia-Pacific: Market Size, By Application, 2015–2022 (USD Million)
Table 38 Asia-Pacific: Market Size, By Country, 2015–2022 (USD Million)
Table 39 China: Market Size, By End-Use Industry, 2015–2022 (USD Million)
Table 40 China: Market Size, By Application, 2015–2022 (USD Million)
Table 41 India: Market Size, By End-Use Industry, 2015–2022 (USD Million)
Table 42 India: Market Size, By Application, 2015–2022 (USD Million)
Table 43 Japan: Market Size, By End-Use Industry, 2015–2022 (USD Million)
Table 44 U.S.: Market Size, By Application, 2015–2022 (USD Million)
Table 45 South Korea: Market Size, By End-Use Industry, 2015–2022 (USD Million)
Table 46 South Korea: Market Size, By Application, 2015–2022 (USD Million)
Table 47 Indonesia: Market Size, By End-Use Industry, 2015–2022 (USD Million)
Table 48 Indonesia: Market Size, By Application, 2015–2022 (USD Million)
Table 49 Middle East & Africa: By tings Market Size, By End-Use Industry, 2015–2022 (USD Million)
Table 50 Middle East & Africa: Market Size, By Application, 2015–2022 (USD Million)
Table 51 Middle East & Africa: Market Size, By Country, 2015–2022 (USD Million)
Table 52 Israel: Market Size, By End-Use Industry, 2015–2022 (USD Million)
Table 53 Israel: Market Size, By Application, 2015–2022 (USD Million)
Table 54 Qatar: Market Size, By End-Use Industry, 2015–2022 (USD Million)
Table 55 Qatar: Market Size, By Application, 2015–2022 (USD Million)
Table 56 UAE: Market Size, By End-Use Industry, 2015–2022 (USD Million)
Table 57 UAE: Market Size, By Application, 2015–2022 (USD Million)
Table 58 South Africa: Market Size, By End-Use Industry, 2015–2022 (USD Million)
Table 59 South Africa: Market Size, By Application, 2015–2022 (USD Million)
Table 60 Saudi Arabia: Market Size, By End-Use Industry, 2015–2022 (USD Million)
Table 61 Saudi Arabia: Market Size, By Application, 2015–2022 (USD Million)
Table 62 Latin America: Market Size, By End-Use Industry, 2015–2022 (USD Million)
Table 63 Latin America: Market Size, By Application, 2015–2022 (USD Million)
Table 64 Latin America: Market Size, By Country, 2015–2022 (USD Million)
Table 65 Brazil: Market Size, By End-Use Industry, 2015–2022 (USD Million)
Table 66 Brazil: Market Size, By Application, 2015–2022 (USD Million)
Table 67 Mexico: Market Size, By End-Use Industry, 2015–2022 (USD Million)
Table 68 Mexico: Market Size, By Application, 2015–2022 (USD Million)
List of Figures (33 Figures)
Figure 1 Composite Coatings: Market Segmentation
Figure 2 Composite Coatings Market: Research Design
Figure 3 Bottom-Up Approach
Figure 4 Top-Down Approach
Figure 5 Composite Coatings Market: Data Triangulation
Figure 6 Composite Coatings Market to Register Highest CAGR in Transportation End-Use Industry, 2017 vs 2022
Figure 7 Anti-Corrosion Application Expected to Lead Market of Composite Coatings, 2017 vs 2022
Figure 8 Electroless Plating Dominates Market of Composite Coatings in 2016
Figure 9 North America Dominated Market of Composite Coatings in 2016
Figure 10 Attractive Market Opportunities in the Composite Coatings Between 2017 and 2022
Figure 11 Anti-Corrosion Application to Lead the Market of Composite Coatings
Figure 12 North America Dominated Market of Composite Coatings in 2016
Figure 13 U.S. Anticipated to Register Highest CAGR in Composite Coatings Market, 2017 vs 2022
Figure 14 Drivers, Restraints, Opportunities, and Challenges of the Composite Coatings Market
Figure 15 Porter’s Five Forces Analysis
Figure 16 Relative GDP Growth Scenario of Key Economies
Figure 17 New Airplane Deliveries, By Region, 2016–2035
Figure 18 Electroless Plating Based Composite Coating Technique to Dominate Overall Market
Figure 19 Anti-Corrosion Application Dominates Overall Market of Composite Coatings
Figure 20 Transportation End-Use Industry Dominates Market of Composite Coatings
Figure 21 North America to Register Highest Market Growth of Composite Coatings in Transportation End-Use Industry
Figure 22 Asia-Pacific Projected to Lead Market of Composite Coatings in Aerospace & Defense Industry
Figure 23 Asia-Pacific to Register Highest Market Growth of Composite Coatings in Industrial Sector
Figure 24 North America to Register Highest Market Growth of Composite Coatings in Oil & Gas End-Use Industry
Figure 25 U.S. and China Leading Global Market of Composite Coatings, 2016
Figure 26 North America Market Snapshot: U.S. is the Most Lucrative Market
Figure 27 Europe Market Snapshot: Germany is the Most Lucrative Market
Figure 28 Asia-Pacific Market Snapshot: China is the Largest Market
Figure 29 Middle East & Africa Market Snapshot: Saudi Arabia is the Most Lucrative Market
Figure 30 Latin America Market Snapshot: Brazil is the Most Lucrative Market
Figure 31 Competitive Leadership Mapping, 2016
Figure 32 PPG Industries, Inc.: Company Snapshot
Figure 33 Axalta Coatings Systems, LLC: Company Snapshot


Growth opportunities and latent adjacency in Composite Coatings Market