Carotenoids Market

Carotenoids Market by Type (Astaxanthin, Beta-Carotene, Lutein, Lycopene, Canthaxanthin, and Zeaxanthin), Application (Feed, Food & Beverages, Dietary Supplements, Cosmetics, and Pharmaceuticals), Source, Formulation, and Region - Global Forecast to 2026

Market Segmentation

Report Metrics Details

Market size available for years

2019 - 2026

CAGR %

4.2

READ MORE...

Competitive Analysis

READ MORE...

Top 10 companies in Carotenoids Market

Report Code: FB 4411 Feb, 2020, by marketsandmarkets.com

[186 Pages Report] The carotenoids market is projected to grow from USD 1.5 billion in 2019 to USD 2.0 billion by 2026, recording a CAGR of 4.2% during the forecast period. This is attributed to the increasing awareness regarding the potential benefits of caortenoids in preventing heart diesaes, cancer, and treating eye disorders, parkinson’s disease, alzhmier’s disease and macular denegraton. Moreover, carotenoids has high antioxidant properties and helps in slowing the ageing process. These factors have made carotenoids a popular preference among consumera and players in food industry.

Furthermore, consumers across the world are demanding clean-label products due to increasing concnern over use of synthetic ingredients in food. This has driven the demand fornatural colorants in food industry and carotenoids being a red pigment is now being widely applied in meat industry to impart color to products such salmon, trout, and other meat and seafood products.

Carotenoids Market

To know about the assumptions considered for the study, Request for Free Sample Report

The lutein segment is projected to grow at the highest rate during the forecast period

The lutein segment, on the basis of type, is projected to grow at the highest CAGR, in terms of value, during the forecast period. Lutein is synthesized by plants and found in some of the major food items, such as egg yolks, carrot, spinach, kale, squash, grapes, and pepper. It is used in both, human nutrition and animal nutrition products. Its wide acceptability due to its ability to treat age-related eye disorders, including cataracts and macular degeneration, is a key factor driving its demand.

By application, the feed segment is estimated to account for the largest market share in 2019 in the carotenoids market

Carotenoids are extensively used in animal nutrition products due to their coloring properties and are incorporated in feed to pigment the egg yolks, broiler skin, fishes, and crustaceans. These also help in increasing the immunity and improving the health of livestock by enhancing the quality of nutrition. The fertility of cattle, swine, and horses can be improved by feeding beta-carotene, whereas astaxanthin and canthaxanthin help in improving the growth of salmons and larval fishes.

The beadlet segment in the carotenoids market is estimated to dominate the market in 2019

On the basis of formulation, the beadlet segment is estimated to dominate the carotenoids market in 2019. Carotenoid beadlets are free-flowing spherical particles developed from spray drying technology. They are usually packed in an aluminum foil bag and stored in a cool and dry place away from direct light, oxygen, and heat. Some of the other major benefits of using beadlet formulations include increased stability, cold water dispersion, and enhanced of shelf life.

Carotenoids Market by Region

To know about the assumptions considered for the study, download the pdf brochure

Europe is projected to account for the largest share in the carotenoids market during the forecast period

The European market accounted for the largest share in 2018 due to the presence of leading manufacturers, such as Koninklijke DSM (Netherlands), BASF (Germany), Chr. Hansen (Denmark), and Dohler Group (Germany). Further, the increase in the aging population in the region has led to a surge in demand for lutein, lycopene, and beta-carotene to treat cataract and reduce the risk of diabetes, cancer, and other heart-related issues. Although synthetic carotenoids account for a high share in the market, consumers prefer opting for natural and clean label products, which is projected to drive the growth of the naturally-sourced carotenoids market in this region.

Key Market Players

Key players in the market include Koninklijke DSM (Netherlands), BASF (Germany), Chr. Hansen (Denmark), Kemin Industries (US), Lycored Limited (Israel), Cyanotech Corporation (US), Fuji Chemical Industry Co Ltd. (Japan), Novus International (US), DDW The Color House (US), Dohler Group (Germany), Allied Biotech Corporation (Taiwan), E.I.D Parry (India), Farbest Brands (US), Excelvite Sdn. Bhd. (Malaysia), AlgaTechnologies Ltd. (Israel), Zhejiang NHU Co. Ltd (China), Dynadis SARL (France), Deinove SAS (France), Vidya Europe SAS (France), and Divi’s Laboratories (India). These players have a broad industry coverage and strong operational and financial strength.

Get online access to the report on the World's First Market Intelligence Cloud

  • Easy to Download Historical Data & Forecast Numbers
  • Company Analysis Dashboard for high growth potential opportunities
  • Research Analyst Access for customization & queries
  • Competitor Analysis with Interactive dashboard
  • Latest News, Updates & Trend analysis
Request Sample

Scope of the Report

Report Metric

Details

Market size available for years

2017–2026

Base year considered

2018

Forecast period

2019–2026

Forecast units

Value (USD Billion) and Volume (Tons)

Segments covered

Type, Application, Source, and Formulation

Geographies covered

North America, Europe, Asia Pacific, South America, and RoW

Companies covered

Koninklijke DSM (Netherlands), BASF (Germany), Chr. Hansen (Denmark), Kemin Industries (US), Lycored Limited (Israel), Cyanotech Corporation (US), Fuji Chemical Industry Co Ltd. (Japan), Novus International (US), DDW The Color House (US), Dohler Group (Germany), Allied Biotech Corporation (Taiwan), E.I.D Parry (India), Farbest Brands (US), Excelvite Sdn. Bhd. (Malaysia), AlgaTechnologies Ltd. (Israel), Zhejiang NHU Co. Ltd (China), Dynadis SARL (France), Deinove SAS (France), Vidya Europe SAS (France), and Divi’s Laboratories (India)

This research report categorizes the carotenoids market based on type, application, source, formulation, and region.

Based on type, the market has been segmented as follows:

  • Astaxanthin
  • Beta-carotene
  • Lutein
  • Lycopene
  • Canthaxanthin
  • Zeaxanthin
  • Other types (capsanthin, annatto, alpha-carotene, and apocarotenal)

Based on application, the market has been segmented as follows:

Based on formulations, the market has been segmented as follows

  • Oil suspension
  • Powder
  • Beadlet
  • Emulsion

Based on source, the market has been segmented as follows:

  • Natural
  • Synthetic

Based on region, the market has been segmented as follows:

  • North America
  • Europe
  • Asia Pacific
  • South America
  • RoW (the Middle East & Africa)

Recent Developments:

  • In June 2019, DDW The Color House acquired Du Pont Natural Colors (Denmark) to enhance the presence of the company in the global market. This acquisition would also help it expand its portfolio with new products.
  • In April 2019, Dφhler Group acquired a majority of shares in Zumos Catalano Aragoneses S.A. (ZUCASA), which is based in Spain. This would help the company to increase its presence in the fruits and carotenoids segment.
  • In April 2019, ExcelVite Sdn. Bhd. collaborated with US Pharmacopeia (US) to publish a new plant carotenes monograph. It was developed based on mixed carotene complex, EVTene. The publication of this monograph would reinstate the efforts of the company to meet the high ingredient standards.
  • In April 2019, Zhejiang NHU Co. Ltd formed a partnership with LJ Ingredients (Denmark). Through this partnership, LJ Ingredients became an exclusive sales agent for beta-carotene products for the company in the European market.
  • In March 2019, Kemin Industries launched Organic KEM GLO, which is a USDA certified organic carotenoid that helps organic egg producers to intensify the colors of egg yolks. This would help the company to attain a leading position in the feed carotenoids market.

Key questions addressed by the report:

  • Who are the major market players in the carotenoids market?
  • What are the regional growth trends and the largest revenue-generating regions for the carotenoids market?
  • Which are the key regions that are projected to witness significant growth in the carotenoids market?
  • What are the major types of carotenoids that are projected to gain maximum market revenue and share during the forecast period?
  • Which are the major applications and formulations of carotenoids that are projected to dominate during the forecast period?

Frequently Asked Questions (FAQ):

To speak to our analyst for a discussion on the above findings, click Speak to Analyst

Table of Contents

1 Introduction (Page No. - 18)
    1.1 Objectives of the Study
    1.2 Market Definition
    1.3 Study Scope
    1.4 Periodization Considered
    1.5 Currency Considered
    1.6 Unit Considered
    1.7 Stakeholders

2 Research Methodology (Page No. - 22)
    2.1 Research Data
    2.2 Market Size Estimation
           2.2.1 Method One (Based on Global Market)
           2.2.2 Carotenoids Market Size Estimation - Method Two
           2.2.3 Market Size Estimation Notes
    2.3 Data Triangulation
    2.4 Assumptions for the Study
    2.5 Limitations of the Study

3 Executive Summary (Page No. - 29)

4 Premium Insights (Page No. - 33)
    4.1 Overview of the Carotenoids Market
    4.2 Market, By Country, 2019 vs. 2026
    4.3 Europe: Carotenoids Market, By Application and Country
    4.4 Market, By Type and Region, 2019
    4.5 Market for Carotenoids, By Formulation, 2019 vs. 2026 (USD Million)
    4.6 Market for Carotenoids, By Source, 2019 vs. 2026 (USD Million)
    4.7 Market for Carotenoids, By Application and Region, 2019

5 Market Overview (Page No. - 38)
    5.1 Introduction
    5.2 Market Dynamics
           5.2.1 Drivers
                    5.2.1.1 Carotenoids are Beneficial in Preventive Healthcare
                    5.2.1.2 Increasing Use of Natural Carotenoids as Food Colorants
                    5.2.1.3 The Growth of the End-User Industries is Projected to Drive the Demand for Carotenoids
                    5.2.1.4 Innovative Technologies for the Extraction of Carotenoids
           5.2.2 Restraints
                    5.2.2.1 Stringent Regulatory Norms are Projected to Hamper the Market Growth
                    5.2.2.2 Risks Associated With High Doses of Carotenoids
                    5.2.2.3 Lack of R&D Activities in Underdeveloped Countries
           5.2.3 Opportunities
                    5.2.3.1 Growing Demand in the Pharmaceutical Industry
                    5.2.3.2 Opportunity to Expand in the High-Growth Potential Markets Such as Asia Pacific and South America
                    5.2.3.3 Growing Demand for Naturally Sourced Carotenoids
           5.2.4 Challenges
                    5.2.4.1 Difficulty in Meeting the Requisite Quality Standards
                    5.2.4.2 High Production Costs Restrict the Entry of Smaller Players
    5.3 Value Chain Analysis
    5.4 YC & YCC Shift
    5.5 Regulations
           5.5.1 Regulations for the Use of Carotenoids

6 Carotenoids Market, By Type (Page No. - 48)
    6.1 Introduction
    6.2 Beta-Carotene
           6.2.1 Increasing Use of Beta-Carotene in the Food & Beverage Industry
    6.3 Astaxanthin
           6.3.1 High Demand for Astaxanthin to Impart Color in Meat Products
    6.4 Lutein
           6.4.1 Wide Acceptability to Treat Eye Diseases
    6.5 Lycopene
           6.5.1 Increasing Usage to Prevent Cancer
    6.6 Zeaxanthin
           6.6.1 Growing Demand in Poultry Feed
    6.7 Canthaxanthin
           6.7.1 Increasing Usage of Canthaxanthin Due to High Quality Results With No Chemical Toxicity
    6.8 Other Types

7 Carotenoids Market, By Application (Page No. - 60)
    7.1 Introduction
    7.2 Feed
           7.2.1 To Enhance the Quality of Feed and Livestock Health
    7.3 Dietary Supplements
           7.3.1 Rising Awareness Among Consumers for Natural Health Supplements
    7.4 Food & Beverages
           7.4.1 High Demand for Natural Food Colorants
    7.5 Cosmetics
           7.5.1 Benefits to Prevent Age-Related Skin Disorders
    7.6 Pharmaceuticals
           7.6.1 Growing Popularity to Prevent Various Diseases and Boost Immunity

8 Carotenoids Market, By Formulation (Page No. - 70)
    8.1 Introduction
    8.2 Beadlet
           8.2.1 Growing Application in Pharmaceuticals
    8.3 Powder
           8.3.1 Wide Application of Power Formulation
    8.4 Oil Suspension
           8.4.1 Low Price of Oil Suspension is Driving Their Market Demand
    8.5 Emulsion
           8.5.1 Low Product Availability is Expected to Hamper Market Growth

9 Carotenoids Market, By Source (Page No. - 78)
    9.1 Introduction
    9.2 Synthetic Carotenoids
           9.2.1 Lower Manufacturing Cost of Synthetic Carotenoids
    9.3 Natural Carotenoids
           9.3.1 Consumer Preference for Natural Products
           9.3.2 Extraction From Botanical Materials
           9.3.3 Fermentation
           9.3.4 Algae Route

10 Carotenoids Market, By Region (Page No. - 84)
     10.1 Introduction
     10.2 North America
             10.2.1 US
                        10.2.1.1 Rising Awareness Regarding the Health Benefits of Carotenoids Driving the Market Growth in the US
             10.2.2 Canada
                        10.2.2.1 Increasing Demand for Dietary-Based Carotenoid Supplements
             10.2.3 Mexico
                        10.2.3.1 Feed is the Major Application Area for Carotenoids
     10.3 Europe
             10.3.1 France
                        10.3.1.1 Feed Applications are Driving the Global Market
             10.3.2 Germany
                        10.3.2.1 Dairy and Pork Feed Consumption Driving the Demand for Carotenoids
             10.3.3 Netherlands
                        10.3.3.1 Entry of New Players Expected to Fuel the Market Demand
             10.3.4 Russia
                        10.3.4.1 Increased Focus on Health Issues Driving Demand
             10.3.5 Spain
                        10.3.5.1 Carotenoids are Majorly Used as Natural Colorants
             10.3.6 Italy
                        10.3.6.1 High Industrial Applications in the Feed and Cosmetic Industries
             10.3.7 Rest of Europe
                        10.3.7.1 Natural Carotenoids are Expected to Witness Fast Growth in This Region
     10.4 Asia Pacific
             10.4.1 China
                        10.4.1.1 Initiatives By Central and Local Governments Promoting the Use of Carotenoids
             10.4.2 India
                        10.4.2.1 Increased Health Awareness and Rise in Livestock Population are Driving Growth
             10.4.3 Thailand
                        10.4.3.1 Seafood and Aquafeed Applications of Carotenoids Driving Growth
             10.4.4 Japan
                        10.4.4.1 Increased Preference for Processed Food and Rising Meat and Dairy Consumption Fuels the Consumption of Carotenoids
             10.4.5 Malaysia
                        10.4.5.1 Growing Demand for Fish and Fisheries Leading to the High Demand for Carotenoids in Feed Applications
             10.4.6 Indonesia
                        10.4.6.1 Low Labor Cost for the Extraction of Carotenoids has Led to an Increase in Production
             10.4.7 Rest of Asia Pacific
                        10.4.7.1 Increasing Use of Carotenoids as Natural Colorants Expected to Drive Demand
     10.5 South America
             10.5.1 Brazil
                        10.5.1.1 Growing Demand for Livestock Feed
             10.5.2 Argentina
                        10.5.2.1 Increasing Industrialization of the Meat and Dairy Industries
             10.5.3 Rest of South America
     10.6 Rest of the World (RoW)
             10.6.1 Middle East
                        10.6.1.1 Growth in the Natural Carotenoids Production Due to the Presence of Key Players in the Region
             10.6.2 Africa
                        10.6.2.1 Large Livestock Population is Driving the Market for Carotenoids

11 Competitive Landscape (Page No. - 134)
     11.1 Overview
     11.2 Competitive Leadership Mapping
             11.2.1 Visionary Leaders
             11.2.2 Innovators
             11.2.3 Dynamic Differentiators
             11.2.4 Emerging Companies
     11.3 Microquadrants of Small Players
             11.3.1 Progressive Companies
             11.3.2 Starting Blocks
             11.3.3 Responsive Companies
             11.3.4 Dynamic Companies
     11.4 Market Share Analysis of Key Players, 2019
     11.5 Competitive Scenario
             11.5.1 New Product Launches
             11.5.2 Expansions & Investments
             11.5.3 Mergers & Acquisitions
             11.5.4 Agreements, Joint Ventures, and Partnerships

12 Company Profiles (Page No. - 141)
(Business Overview, Products Offered, Recent Developments, SWOT Analysis & Right to Win)* 
     12.1 Koninklijke DSM
     12.2 BASF
     12.3 Chr. Hansen
     12.4 Cyanotech Corporation
     12.5 Allied Biotech Corporation
     12.6 Lycored Limited
     12.7 Kemin Industries
     12.8 Fuji Chemical Industry Co Ltd.
     12.9 Novus International
     12.10 Dφhler Group
     12.11 Excelvite Sdn. Bhd.
     12.12 DDW the Color House
     12.13 Farbest Brands
     12.14 Algatechnologies Ltd.
     12.15 Zhejiang NHU Co. Ltd.
     12.16 E.I.D. Parry
     12.17 Divi’s Laboratories
     12.18 Dynadis SARL
     12.19 Vidya Europe SAS
     12.20 Deinove SAS
*Details on Business Overview, Products Offered, Recent Developments, SWOT Analysis & Right to Win Might Not Be Captured in Case of Unlisted Companies. 

13 Appendix (Page No. - 178)
     13.1 Discussion Guide
     13.2 Knowledge Store: Marketsandmarkets’ Subscription Portal
     13.3 Available Customizations
     13.4 Related Reports
     13.5 Author Details


List of Tables (147 Tables)

Table 1 USD Exchange Rates Considered, 2014–2018
Table 2 Carotenoids Market Snapshot, 2019 vs. 2026
Table 3 Sources of Carotenoids and Their Medicinal Properties
Table 4 Carotenoids Market Size, By Type, 2017–2026 (USD Million)
Table 5 Market Size for Carotenoids, By Type, 2017–2026 (Ton)
Table 6 Beta-Carotene Market Size, By Region, 2017–2026 (USD Million)
Table 7 Beta-Carotene Market Size, By Region, 2017–2026 (Ton)
Table 8 Astaxanthin Market Size, By Region, 2017–2026 (USD Million)
Table 9 Astaxanthin Market Size, By Region, 2017–2026 (Ton)
Table 10 Lutein Market Size, By Region, 2017–2026 (USD Million)
Table 11 Lutein Market Size, By Region, 2017–2026 (Ton)
Table 12 Lycopene Market Size, By Region, 2017–2026 (USD Million)
Table 13 Lycopene Market Size, By Region, 2017–2026 (Ton)
Table 14 Zeaxanthin Market Size, By Region, 2017–2026 (USD Million)
Table 15 Zeaxanthin Market Size, By Region, 2017–2026 (Ton)
Table 16 Canthaxanthin Market Size, By Region, 2017–2026 (USD Million)
Table 17 Canthaxanthin Market Size, By Region, 2017–2026 (Ton)
Table 18 Other Types Market Size, By Region, 2017–2026 (USD Million)
Table 19 Other Types Market Size, By Region, 2017–2026 (Ton)
Table 20 Carotenoids Market Size, By Application, 2017–2026 (USD Million)
Table 21 Market Size for Carotenoids, By Application, 2017–2026 (Ton)
Table 22 Carotenoids Market Size in Feed, By Region, 2017–2026 (USD Million)
Table 23 Market Size in Feed, By Region, 2017–2026 (Ton)
Table 24 Market Size in Dietary Supplements, By Region, 2017–2026 (USD Million)
Table 25 Carotenoids Market Size in Dietary Supplements, By Region, 2017–2026 (Ton)
Table 26 Market Size in Food & Beverages, By Region, 2017–2026 (USD Million)
Table 27 Market Size in Food & Beverages, By Region, 2017–2026 (Ton)
Table 28 Market Size in Cosmetics, By Region, 2017–2026 (USD Million)
Table 29 Market Size in Cosmetics, By Region, 2017–2026 (Ton)
Table 30 Market Size in Pharmaceuticals, By Region, 2017–2026 (USD Million)
Table 31 Market Size in Pharmaceuticals, By Region, 2017–2026 (Ton)
Table 32 Market Size for Carotenoids, By Formulation, 2017–2026 (USD Million)
Table 33 Market Size for Carotenoids, By Formulation, 2017–2026 (Ton)
Table 34 Carotenoids Beadlet Market Size, By Region, 2017–2026 (USD Million)
Table 35 Carotenoids Beadlet Market Size, By Region, 2017–2026 (Ton)
Table 36 Carotenoids Powder Market Size, By Region, 2017–2026 (USD Million)
Table 37 Carotenoids Powder Market Size, By Region, 2017–2026 (Ton)
Table 38 Carotenoids Oil Suspension Market Size, By Region, 2017–2026 (USD Million)
Table 39 Carotenoids Oil Suspension Market Size, By Region, 2017–2026 (Ton)
Table 40 Carotenoids Emulsion Market Size, By Region, 2017–2026 (USD Million)
Table 41 Carotenoids Emulsion Market Size, By Region, 2017–2026 (Ton)
Table 42 Carotenoids Market Size, By Source, 2017–2026 (USD Million)
Table 43 Market Size for Carotenoids, By Source, 2017–2026 (Ton)
Table 44 Synthetic Carotenoids Market Size, By Region, 2017–2026 (USD Million)
Table 45 Synthetic Carotenoids: Market Size, By Region, 2017–2026 (Ton)
Table 46 Natural Carotenoids: Market Size, By Region, 2017–2026 (USD Million)
Table 47 Natural Carotenoids Market Size, By Region, 2017–2026 (Ton)
Table 48 Market Size, By Region, 2017–2026 (USD Million)
Table 49 Market Size for Carotenoids, By Region, 2017–2026 (Ton)
Table 50 North America: Carotenoids Market Size, By Country, 2017–2026 (USD Million)
Table 51 North America: Market Size, By Country, 2017–2026 (Ton)
Table 52 North America: Market Size, By Type, 2017–2026 (USD Million)
Table 53 North America: Market Size, By Type, 2017–2026 (Ton)
Table 54 North America: Market Size, By Source, 2017–2026 (USD Million)
Table 55 North America: Market Size, By Source, 2017–2026 (Ton)
Table 56 North America: Market Size, By Formulation, 2017–2026 (USD Million)
Table 57 North America: Market Size, By Formulation, 2017–2026 (Ton)
Table 58 North America: Market Size, By Application, 2017–2026 (USD Million)
Table 59 North America: Market Size, By Application, 2017–2026 (Ton)
Table 60 US: Market Size, By Application, 2017–2026 (USD Million)
Table 61 US: Market Size for Carotenoids, By Application, 2017–2026 (Ton)
Table 62 Canada: Market Size for Carotenoids, By Application, 2017–2026 (USD Million)
Table 63 Canada: Market Size for Carotenoids, By Application, 2017–2026 (Ton)
Table 64 Mexico: Market Size for Carotenoids, By Application, 2017–2026 (USD Million)
Table 65 Mexico: Market Size for Carotenoids, By Application, 2017–2026 (Ton)
Table 66 Europe: Carotenoids Market Size, By Country, 2017–2026 (USD Million)
Table 67 Europe: Market Size for Carotenoids, By Country, 2017–2026 (Ton)
Table 68 Europe: Market Size for Carotenoids, By Type, 2017–2026 (USD Million)
Table 69 Europe: Market Size for Carotenoids, By Type, 2017–2026 (Ton)
Table 70 Europe: Market Size for Carotenoids, By Source, 2017–2026 (USD Million)
Table 71 Europe: Market Size for Carotenoids, By Source, 2017–2026 (Ton)
Table 72 Europe: Market Size for Carotenoids, By Formulation, 2017–2026 (USD Million)
Table 73 Europe: Market Size for Carotenoids, By Formulation, 2017–2026 (Ton)
Table 74 Europe: Market Size for Carotenoids, By Application, 2017–2026 (USD Million)
Table 75 Europe: Market Size for Carotenoids, By Application, 2017–2026 (Ton)
Table 76 France: Market Size, By Application, 2017–2026 (USD Million)
Table 77 France: Market Size for Carotenoids, By Application, 2017–2026 (Ton)
Table 78 Germany: Market Size for Carotenoids, By Application, 2017–2026 (USD Million)
Table 79 Germany: Market Size for Carotenoids, By Application, 2017–2026 (Ton)
Table 80 Netherlands: Market Size for Carotenoids, By Application, 2017–2026 (USD Million)
Table 81 Netherlands: Market Size for Carotenoids, By Application, 2017–2026 (Ton)
Table 82 Russia: Market Size for Carotenoids, By Application, 2017–2026 (USD Million)
Table 83 Russia: Market Size for Carotenoids, By Application, 2017–2026 (Ton)
Table 84 Spain: Market Size for Carotenoids, By Application, 2017–2026 (USD Million)
Table 85 Spain : Market Size for Carotenoids, By Application, 2017–2026 (Ton)
Table 86 Italy: Market Size for Carotenoids, By Application, 2017–2026 (USD Million)
Table 87 Italy: Market Size for Carotenoids, By Application, 2017–2026 (Ton)
Table 88 Rest of Europe: Market Size for Carotenoids, By Application, 2017–2026 (USD Million)
Table 89 Rest of Europe: Market Size for Carotenoids, By Application, 2017–2026 (Ton)
Table 90 Asia Pacific: Carotenoids Market Size, By Country, 2017–2026 (USD Million)
Table 91 Asia Pacific: Market Size for Carotenoids, By Country, 2017–2026 (Ton)
Table 92 Asia Pacific: Market Size for Carotenoids, By Type, 2017–2026 (USD Million)
Table 93 Asia Pacific: Market Size for Carotenoids, By Type, 2017–2026 (Ton)
Table 94 Asia Pacific: Market Size for Carotenoids, By Source, 2017–2026 (USD Million)
Table 95 Asia Pacific: Market Size for Carotenoids, By Source, 2017–2026 (Ton)
Table 96 Asia Pacific: Market Size for Carotenoids, By Formulation, 2017–2026 (USD Million)
Table 97 Asia Pacific: Market Size for Carotenoids, By Formulation, 2017–2026 (Ton)
Table 98 Asia Pacific: Market Size for Carotenoids, By Application, 2017–2026 (USD Million)
Table 99 Asia Pacific: Market Size for Carotenoids, By Application, 2017–2026 (Ton)
Table 100 China: Carotenoids Market Size, By Application, 2017–2026 (USD Million)
Table 101 China: Market Size for Carotenoids, By Application, 2017–2026 (Ton)
Table 102 India: Market Size for Carotenoids, By Application, 2017–2026 (USD Million)
Table 103 India: Market Size for Carotenoids, By Application, 2017–2026 (Tons)
Table 104 Thailand: Market Size for Carotenoids, By Application, 2017– 2026 (USD Million)
Table 105 Thailand: Market Size for Carotenoids, By Application, 2017– 2026 (Ton)
Table 106 Japan: Market Size for Carotenoids, By Application, 2017–2026 (USD Million)
Table 107 Japan: Market Size for Carotenoids, By Application, 2017–2026 (Ton)
Table 108 Malaysia: Market Size for Carotenoids, By Application, 2017–2026 (USD Million)
Table 109 Malaysia: Market Size for Carotenoids, By Application, 2017–2026 (Ton)
Table 110 Indonesia: Market Size for Carotenoids, By Application, 2017–2026 (USD Million)
Table 111 Indonesia: Market Size for Carotenoids, By Application, 2017–2026 (Ton)
Table 112 Rest of Asia Pacific: Market Size for Carotenoids, By Application, 2017–2026 (USD Million)
Table 113 Rest of Asia Pacific: Market Size for Carotenoids, By Application, 2017– 2026 (Ton)
Table 114 South America: Carotenoids Market Size, By Country, 2017–2026 (USD Million)
Table 115 South America: Market Size for Carotenoids, By Country, 2017–2026 (Ton)
Table 116 South America: Market Size for Carotenoids, By Type, 2017–2026 (USD Million)
Table 117 South America: Market Size for Carotenoids, By Type, 2017–2026 (Ton)
Table 118 South America: Market Size for Carotenoids, By Formulation, 2017–2026 (USD Million)
Table 119 South America: Market Size for Carotenoids, By Formulation, 2017–2026 (Tons)
Table 120 South America: Market Size for Carotenoids, By Source, 2017–2026 (USD Million)
Table 121 South America: Market Size for Carotenoids, By Source, 2017–2026 (Ton)
Table 122 South America: Market Size for Carotenoids, By Application, 2017–2026 (USD Million)
Table 123 South America: Market Size for Carotenoids, By Application, 2017–2026 (Ton)
Table 124 Brazil: Market Size, By Application, 2017–2026 (USD Million)
Table 125 Brazil: Market Size for Carotenoids, By Application, 2017–2026 (Ton)
Table 126 Argentina: Market Size for Carotenoids, By Application, 2017–2026 (USD Million)
Table 127 Argentina: Market Size for Carotenoids, By Application, 2017–2026 (Tons)
Table 128 Rest of South America: Market Size for Carotenoids, By Application, 2017–2026 (USD Million)
Table 129 Rest of South America: Market Size for Carotenoids, By Application, 2017–2026 (Ton)
Table 130 RoW: Carotenoids Market Size, By Region, 2017–2026 (USD Million)
Table 131 RoW: Market Size for Carotenoids, By Region, 2017–2026 (Ton)
Table 132 RoW: Market Size for Carotenoids, By Type, 2017–2026 (USD Million)
Table 133 RoW: Market Size for Carotenoids, By Type, 2017–2026 (Ton)
Table 134 RoW: Market Size for Carotenoids, By Formulation, 2017–2026 (USD Million)
Table 135 RoW: Market Size for Carotenoids, By Formulation, 2017–2026 (Ton)
Table 136 RoW: Market Size for Carotenoids, By Source, 2017–2026 (USD Million)
Table 137 RoW: Market Size for Carotenoids, By Source, 2017–2026 (Ton)
Table 138 RoW: Carotenoids Market Size, By Application, 2017–2026 (USD Million)
Table 139 RoW: Market Size for Carotenoids, By Application, 2017–2026 (Ton)
Table 140 Middle East: Market Size for Carotenoids, By Application, 2017–2026 (USD Million)
Table 141 Middle East: Market Size for Carotenoids, By Application, 2017–2026 (Ton)
Table 142 Africa: Market Size for Carotenoids, By Application, 2017–2026 (USD Million)
Table 143 Africa: Market Size for Carotenoids, By Application, 2017–2026 (Ton)
Table 144 New Product Launches
Table 145 Expansions & Investments
Table 146 Mergers & Acquisitions
Table 147 Agreements, Joint Ventures, and Partnerships


List of Figures (39 Figures)

Figure 1 Market Segmentation
Figure 2 Regional Segmentation
Figure 3 Carotenoids Market: Research Design
Figure 4 Data Triangulation Methodology
Figure 5 Breakdown of Primaries
Figure 6 Carotenoids Market Size, By Type, 2019 vs. 2026 (USD Million)
Figure 7 Market Size for Carotenoids, By Formulation, 2019 vs. 2026 (USD Million)
Figure 8 Market Size for Carotenoids, By Source, 2019 vs. 2026 (USD Million)
Figure 9 Market Size for Carotenoids, By Application, 2019 vs. 2026 (USD Million)
Figure 10 Market Share & Growth (Value), By Region
Figure 11 Carotenoids: Increasing Awareness Regarding Antioxidant Properties to Drive the Market Growth
Figure 12 US to Dominate the Carotenoids Market From 2019 to 2026
Figure 13 France Accounted for the Largest Share in the European Market and the Feed Segment Dominated, on the Basis of Application, in 2018
Figure 14 Zeaxanthin is Projected to Hold the Largest Share in the North American Carotenoids Market in 2019
Figure 15 Beadlet Accounted for the Largest Share in this Market From 2019 to 2026 (USD Million)
Figure 16 Synthetic Source is Projected to Account for a larger share in the Carotenoids Market from 2019 to 2026 (USD Million)
Figure 17 Feed, on the Basis of Application, Accounted for the largest share in the global market
Figure 18 Carotenoids Market: Market Dynamics
Figure 19 Feed Consumption Share (Volume), By Livestock Type, 2018
Figure 20 Market: Value Chain Analysis
Figure 21 Market: Production Process
Figure 22 YC & YCC Shift – for Carotenoids Market
Figure 23 Carotenoids Market Size, By Type, 2019 vs. 2026 (USD Million)
Figure 24 Market Size for Carotenoids, By Application, 2019–2026 (USD Million)
Figure 25 Market Size for Carotenoids, By Formulation, 2019 vs. 2026 (USD Million)
Figure 26 Market Size for Carotenoids, By Source, 2019 vs. 2026 (USD Million)
Figure 27 Geographic Snapshot (2019–2026): Rapidly Growing Markets in Asia Pacific Emerging as New Hotspots
Figure 28 The US Accounts for the Largest Share in the North American Market for Carotenoids
Figure 29 Europe Carotenoids Market: Snapshot
Figure 30 Figure 1: Asia Pacific Region: Snapshot
Figure 31 Global Carotenoids Market Competitive Leadership Mapping of Top 15 Players, 2019
Figure 32 Smaller Players: Competitive Leadership Mapping, 2019
Figure 33 BASF SE Led the Carotenoids Market, in Terms of Market Share, in 2019
Figure 34 Koninklijke DSM : Company Snapshot
Figure 35 BASF: Company Snapshot
Figure 36 Chr. Hansen: Company Snapshot
Figure 37 Cyanotech Corporation: Company Snapshot
Figure 38 E.I.D. Parry: Company Snapshot
Figure 39 Divi’s Laboratories: Company Snapshot

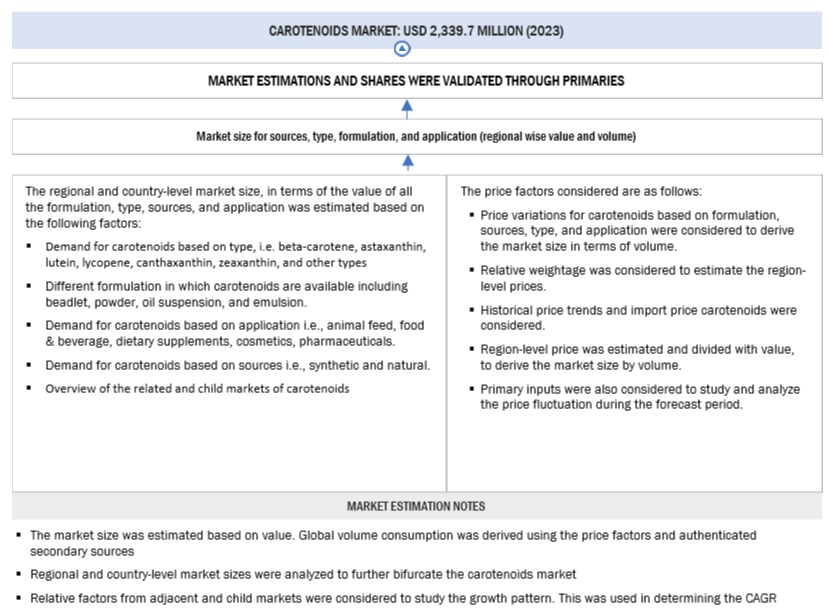
The study involved four major steps to estimate the size of the carotenoids market. Exhaustive secondary research was done to collect information on the market, as well as the parent market. The next step was to validate these findings, assumptions, and sizing with industry experts across the value chain through primary research. Both the top-down and bottom-up approaches were employed to estimate the complete market size. After that, market breakdown and data triangulation were used to estimate the market size of segments and subsegments.

Secondary Research

In the secondary research process, various sources were referred to, to identify and collect information for this study. These secondary sources included reports from the Organization for Economic Cooperation and Developments (OECD), World Health Organization (WHO), Association of Nutrition & Foodservice Professionals (ANFP), Natural Products Association Food (NPAF), Food and Agriculture Organization (FAO), and Department of Environment, Food and Rural Affairs (DEFRA). Secondary sources also included annual reports, press releases, investor presentations of companies, white papers, certified publications, articles by recognized authors and regulatory bodies, trade directories, and databases.

Secondary research was mainly conducted to obtain key information about the industry’s value chain, the total pool of key players, and market classification & segmentation according to industry trends to the bottom-most level, and geographical markets. It was also used to obtain information about the key developments from a market-oriented perspective.

Primary Research

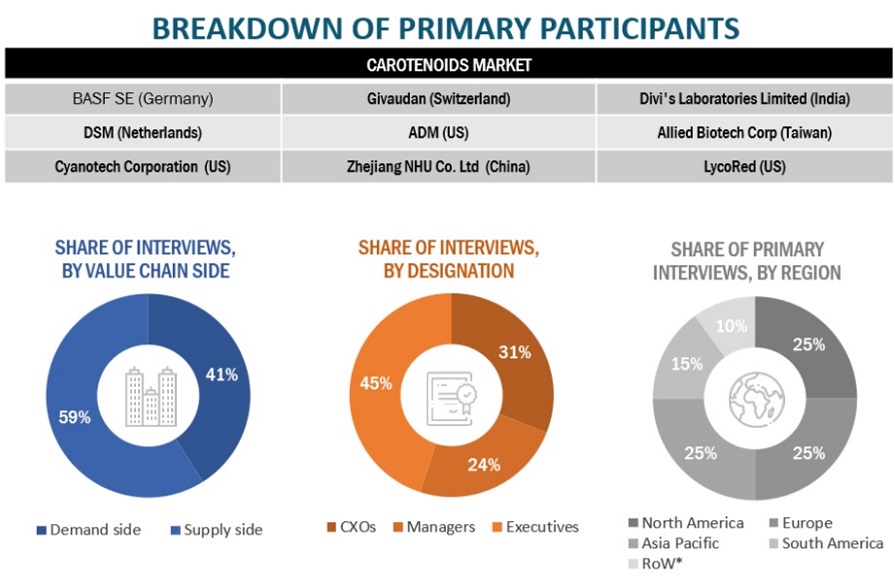
The overall carotenoids market comprises several stakeholders in the supply chain, which include suppliers, manufacturers, importers, traders, distributors, and exporters. Various primary sources from both the supply and demand sides of the market were interviewed to obtain qualitative and quantitative information. The primary interviewees from the demand side include key opinion leaders, executives, vice presidents, and CEOs in the food & beverages, feed, and dietary supplements industry. The primary sources from the supply side include research institutions involved in R&D, key opinion leaders, and carotenoids suppliers and manufacturers.

Carotenoids Market Primary Respondents

To know about the assumptions considered for the study, download the pdf brochure

Market Size Estimation

Both the top-down and bottom-up approaches were used to estimate and validate the total size of the carotenoid market. These approaches were also used extensively to estimate the size of various subsegments in the market. The research methodology used to estimate the market size includes the following details:

  • The key players were identified through extensive secondary research.
  • The carotenoids market size, in terms of value and volume, was determined through primary and secondary research.
  • All percentage share, splits, and breakdowns were determined using secondary sources and verified through primary sources.
  • All the possible parameters that affect the market covered in this research study were accounted for, viewed in extensive detail, verified through primary research, and analyzed to obtain the final quantitative and qualitative data.

Data Triangulation

After arriving at the overall market size from the estimation process explained above, the total market was split into several segments and subsegments. The data triangulation and market breakdown procedures were employed to estimate the global market and arrive at the exact statistics for all segments and subsegments, wherever applicable. The data was triangulated by studying various factors and trends from the demand and supply sides. Along with this, the market size was validated using both the top-down and bottom-up approaches.

Report Objectives

  • Determining and projecting the size of the carotenoids market, with respect to type, application, source, formulation, and regional markets, over the period of seven years, ranging from 2019 to 2026
  • Identifying the attractive opportunities in the market by determining the largest and fastest-growing segments across regions
  • Providing detailed information about the key factors influencing the growth of the market (drivers, restraints, opportunities, and industry-specific challenges)
  • Analyzing the micromarkets, with respect to individual growth trends, future prospects, and their contribution to the total market
  • Identifying and profiling the key market players in the market
  • Providing a comparative analysis of the market leaders based on the following parameters:
    • Product offerings
    • Business strategies
    • Strengths and weaknesses
    • Key financials
  • Understanding the competitive landscape and identifying the major growth strategies adopted by players across the key regions
  • Analyzing the value chain, products, and regulatory frameworks across key regions and their impact on the prominent market players
  • Providing insights on key product innovations and investments in the carotenoids market

Geographical Analysis

  • Further breakdown of application, by key country
  • Further breakdown of Rest of Europe, by key country

Company Information

  • Analyses and profiling of additional market players (up to five)
Custom Market Research Services

We will customize the research for you, in case the report listed above does not meet with your exact requirements. Our custom research will comprehensively cover the business information you require to help you arrive at strategic and profitable business decisions.

Request Customization
Report Code
FB 4411
Published ON
Feb, 2020
Choose License Type
BUY NOW
  • SHARE
X
Request Customization
Speak to Analyst
Speak to Analyst
OR FACE-TO-FACE MEETING
PERSONALIZE THIS RESEARCH
  • Triangulate with your Own Data
  • Get Data as per your Format and Definition
  • Gain a Deeper Dive on a Specific Application, Geography, Customer or Competitor
  • Any level of Personalization
REQUEST A FREE CUSTOMIZATION
LET US HELP YOU!
  • What are the Known and Unknown Adjacencies Impacting the Carotenoids Market
  • What will your New Revenue Sources be?
  • Who will be your Top Customer; what will make them switch?
  • Defend your Market Share or Win Competitors
  • Get a Scorecard for Target Partners
CUSTOMIZED WORKSHOP REQUEST
+1-888-600-6441
  • Call Us
  • +1-888-600-6441 (Corporate office hours)
  • +1-888-600-6441 (US/Can toll free)
  • +44-800-368-9399 (UK office hours)
CONNECT WITH US
ABOUT TRUST ONLINE
©2024 MarketsandMarkets Research Private Ltd. All rights reserved
DMCA.com Protection Status Website Feedback