Carbon Fiber Prepreg Market by Resin Type (Epoxy, Phenolic, Thermoplastic, BMI, Polyimide), Manufacturing Process (Hot Melt, Solvent Dip), End-use Industry (Aerospace & Defense, Automotive, Sports & Recreation, Wind Energy) - Global Forecast to 2027


Updated on : September 24, 2025
Carbon Fiber Prepreg Market
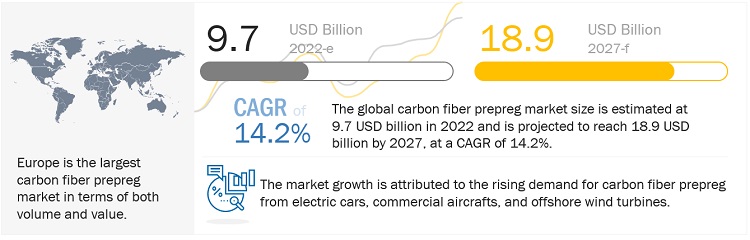
The carbon fiber prepreg market was valued at USD 9.7 billion in 2022 and is projected to reach USD 18.9 billion by 2027, growing at 14.2% cagr from 2022 to 2027. The market is growing due to its increasing demand from aerospace & defense, automotive, and wind energy industries. Growing wind turbine installations and increasing aircraft production is fueling the demand for carbon fiber prepregs across the globe.
Carbon Fiber Prepreg Market Forecast & Trends
Impact of COVID-19 on global carbon fiber prepreg market
In 2020, more than 80% of automobile production was halted owing to COVID-19 in North America. The aerospace & defense industry also experienced a very bad impact of the COVID-19 pandemic. Europe and Asia Pacific witnessed a similar situation of slowdown for various markets. Big manufacturing companies such as Ford, General Motors, Fiat Chrysler Automobiles, Honda, and Tesla stopped their production temporarily. Even though these companies resumed production after the pandemic-induced lockdown, the economic instability and reduction in the purchasing power of consumers are expected to have an adverse effect on the transportation industry for a certain period. Carbon fiber prepreg manufacturing companies are struggling to continue production after shutting down the production plants in most countries in 2020. There was a decrease in consumer demand in markets, especially in the US, China, and Japan.
Driver: Growing demand from wind energy industry to drive the demand for carbon fiber prepregs
The use of carbon fiber prepregs helps to reduce overall weight, optimizes the stiffness-to-weight ratio in the longer wind blades. Carbon fiber prepregs also helps to increase the stiffness that prevents tower strikes in the sudden wind gusts. It is necessary to reduce the weight of wind turbines in order to control and reduce cyclical compression regulations. The CAGR for offshore wind during the next five years is around 31%. The annual installations are expected to quadruple by 2025. This growth in the wind energy industry is expected to fuel the demand for carbon fiber prepregs.
Restraint: High processing and manufacturing cost is a major restrain for the carbon fiber prepreg market
The applications of carbon fiber prepreg have been increasing dramatically in many industries such as aerospace, wind, automotive, and so on. At present, composites in the form of carbon fiber prepreg contribute to over 50% of the structural mass of large transport airplanes. However, further use of carbon fiber prepreg has been restricted because of the high material and manufacturing costs. Hence, it is necessary to use cost estimation tools in the early design stages to reduce the cost of carbon fiber prepreg products.
In the automotive industry, it is mainly used in sports and racing cars due to its high cost. For instance, the cost of aerospace-grade polyacrylonitrile-based carbon fiber is around USD 21/kg compared to the cost of steel and aluminum at USD 0.33/kg and USD 1.50/kg, respectively. The high cost of manufacturing carbon fiber prepreg is limiting its use in end-use industries. This is acting as a restraint to the growth of the market. However, the average cost of carbon fiber prepreg is expected to get lower and may be used for the mass production of mainstream vehicles. Oak Ridge National Laboratory (ORNL), located in the US, is aggressively working to develop low-cost carbon fiber (LCCF) technologies.
Opportunity: Development of advanced software tools for carbon fiber prepreg product development is an opportunity for the carbon fiber prepreg market to grow
Many advanced carbon fiber prepreg software tools are being developed to automate the engineering process and reduce the design cycle time of carbon fiber prepreg. These tools can identify and solve problems incurred during the manufacturing and designing stages of carbon fiber prepreg. They also help in building cost-modeling analysis, thereby reducing manufacturing and assembly costs and meeting the production volumes of targeted industries. Thus, the adoption of these software tools would provide the opportunity for automation and would help in increasing the penetration of carbon fiber prepreg in various applications.
Challenge: High cost of research and development
High R&D cost has been an important concern associated with the growth of the carbon fiber prepreg market. Many applications of carbon fiber prepreg have been discovered. However, due to the high R&D cost, commercialization of these applications is yet to begin. Developing low-cost technologies is a major challenge for all researchers and key manufacturers. Hence, carbon fiber prepreg is only introduced in high-end and luxury cars. Production of low-cost carbon fiber prepreg can increase the demand from different end-use sectors.
Solvent dip manufacturing process accounted for the second highest market share in the carbon fiber prepreg market, in terms of value.
Solvent dip process offers main advantage of providing high performance level. This process can be designed for producing carbon fiber prepregs for having applications in extreme environmental conditions that includes intense heat. Hot melt process accounts for the largest market share in carbon fiber prepreg market.
Polyimide resin type accounted for the second highest market share in the carbon fiber prepreg market, in terms of value.
Polyimide resins are getting widely getting used due to their good chemical resistance, thermal stability, high tensile strength, and excellent mechanical properties. This resin is priced higher than phenolic, epoxy, thermoplastic, and BMI hence accounts for significant market share in terms of value.
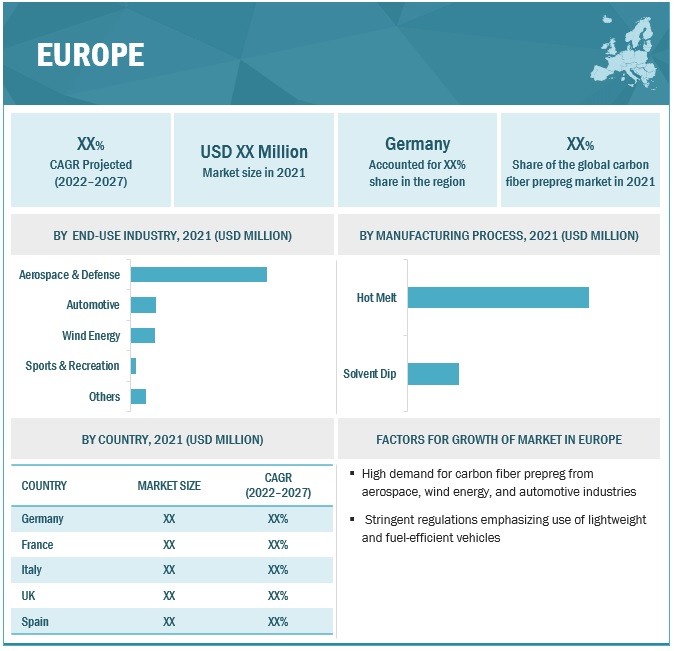
Europe held the largest market share in the carbon fiber prepreg market
The carbon fiber prepreg industry in Europe is a significant part of the region’s economy. This region is segmented into France, Germany, the UK, Italy, Spain, Austria, and the Rest of Europe. In this region, carbon fiber prepreg is largely used in automotive, aerospace & defense, and wind energy industries. The aerospace industry accounts for the maximum market share due to the presence of a large aerospace industry in France and the UK.
Carbon Fiber Prepreg Market Players
The key players in the global carbon fiber prepreg market are:
• Mitsubishi Chemical Carbon Fiber and Composites, Inc. (Japan)
• Solvay (Belgium)
• Teijin Limited (Japan)
• Toray Industries Inc. (Japan)
• Hexcel Corporation (US),
• Gurit Holding AG (Switzerland)
• SGL Carbon (Germany)
• Park Aerospace Corp. (US)
• Axiom Materials, Inc. (US)
• Others
These companies are involved in adopting various inorganic and organic strategies to increase their foothold in the carbon fiber prepreg industry. The study includes an in-depth competitive analysis of these key players in the carbon fiber prepreg market, with their company profiles, recent developments, and key market strategies.
Read More: Carbon Fiber Prepreg Companies
Recent Developments in Carbon Fiber Prepreg Market Industry
- In September 2022, Solvay introduced LTM 350, a next-generation carbon fiber epoxy prepreg tooling material designed to deliver significant time and cost savings for the industrial, aerospace, automotive, and racing car markets. The carbon fiber epoxy tooling material offers an industry-leading fast, low-temperature cure cycle (3 hours at 60°C) and can also be cured at temperatures as low as 45°C with an extended post-cure. Tools built from LTM 350 can be continuously cycled at temperatures up to 150°C delivering highly accurate composite parts.
- In June 2022, Hexcel Corporation was awarded a long-term contract by Sikorsky, a Lockheed Martin Company, to supply advanced composite structures for the CH-53K King Stallion heavy lift helicopter program. The agreement significantly expands Hexcel composite content in the aircraft.
- In May 2022, Toray Composite Materials America, Inc., a subsidiary of Toray Industries, Inc., announced that it entered into a collaborative arrangement with Bell Textron Inc. to support a new National Center for Advanced Materials Performance (NCAMP) design allowable dataset for Toray’s 3960 prepreg material system. This prepreg system utilizes Toray’s T1100 intermediate modulus plus (IM+) fibers, providing high toughness and exceptional tensile performance ideal for aerospace applications.
Frequently Asked Questions (FAQ):
What are the factors influencing the growth of the carbon fiber prepreg market?
High demand from end-use industries due to the superior performance properties of carbon fiber prepreg has been driving the market.
What are the factors contributing to the final price of carbon fiber prepreg?
Raw material plays a vital role in the costs. The cost of these materials contributes largely to the final pricing of carbon fiber.
To speak to our analyst for a discussion on the above findings, click Speak to Analyst
 Exclusive indicates content/data unique to MarketsandMarkets and not available with any competitors.
- 5.1 INTRODUCTION
-
5.2 MARKET DYNAMICSDRIVERS- Increasing use of carbon fiber prepreg in electric cars- Increasing use of ATF and AFP technologies for manufacturing aircraft primary structures- Demand for larger wind turbines- Increasing commercial aircraft productionRESTRAINTS- High processing and manufacturing cost- Limitation in use of carbon fiber prepreg in high-temperature aerospace applications- Decline in demand from luxury cars segmentOPPORTUNITIES- Reduction in cost of carbon fiber- Development of advanced software tools for carbon fiber prepreg product developmentCHALLENGES- High research and development cost- Capital-intensive and complex manufacturing process of carbon fiber
-
5.3 PORTER’S FIVE FORCES ANALYSISBARGAINING POWER OF BUYERSBARGAINING POWER OF SUPPLIERSTHREAT OF NEW ENTRANTSTHREAT OF SUBSTITUTESINTENSITY OF COMPETITIVE RIVALRY
- 5.4 SUPPLY CHAIN ANALYSIS
-
5.5 KEY STAKEHOLDERS & BUYING CRITERIAKEY STAKEHOLDERS IN BUYING PROCESSBUYING CRITERIA
- 5.6 TECHNOLOGY ANALYSIS
-
5.7 ECOSYSTEM: CARBON FIBER PREPREG MARKET
- 5.8 VALUE CHAIN ANALYSIS
-
5.9 KEY MARKETS FOR IMPORT/EXPORTJAPANCHINAUSGERMANYFRANCE
- 5.10 PRICING ANALYSIS
- 5.11 AVERAGE SELLING PRICES OF KEY PLAYERS, BY MANUFACTURING PROCESS
- 5.12 AVERAGE SELLING PRICE, BY RESIN TYPE
- 5.13 AVERAGE SELLING PRICE, BY END-USE INDUSTRY
- 5.14 AVERAGE SELLING PRICE
-
5.15 CARBON FIBER PREPREG MARKET: OPTIMISTIC, PESSIMISTIC, AND REALISTIC SCENARIOSOPTIMISTIC SCENARIOPESSIMISTIC SCENARIOREALISTIC SCENARIO
- 5.16 KEY CONFERENCES & EVENTS
-
5.17 TARIFFS AND REGULATIONSREGULATORY BODIES, GOVERNMENT AGENCIES, AND OTHER ORGANIZATIONS
-
5.18 PATENT ANALYSISMETHODOLOGYLIST OF PATENTS
- 5.19 CASE STUDY ANALYSIS
- 6.1 INTRODUCTION
-
6.2 HOT MELT PROCESSHIGH-SPEED PRODUCTION WITH NO THERMAL STRESS ON SUBSTRATE FUELING MARKET GROWTHHOT MELT PROCESS MARKET, BY REGION
-
6.3 SOLVENT DIP PROCESSINCREASING DEMAND FOR HIGH-TEMPERATURE RESISTANT PREPREG DRIVING SOLVENT DIP PROCESSSOLVENT DIP PROCESS MARKET, BY REGION
- 7.1 INTRODUCTION
-
7.2 EPOXY RESINEPOXY RESIN SEGMENT DOMINATES OVERALL CARBON FIBER PREPREG MARKETEPOXY RESIN CARBON FIBER PREPREG MARKET, BY REGION
-
7.3 PHENOLIC RESINPHENOLIC RESIN SEGMENT TO HAVE HIGH DEMAND FROM AEROSPACE & DEFENSE AND AUTOMOTIVE INDUSTRIESPHENOLIC RESIN CARBON FIBER PREPREG MARKET, BY REGION
-
7.4 THERMOPLASTIC RESINDEMAND FOR THERMOPLASTIC RESIN SEGMENT DRIVEN BY ITS ABILITY TO RE-FORM AFTER REPEATED HEATING AND COOLINGTHERMOPLASTIC RESIN CARBON FIBER PREPREG MARKET, BY REGION
-
7.5 BISMALEIMIDE RESINGROWING DEMAND IN HIGH-TEMPERATURE APPLICATIONS DRIVING BMI RESIN SEGMENTBMI RESIN CARBON FIBER PREPREG MARKET, BY REGION
-
7.6 POLYIMIDE RESININCREASING USE OF CARBON FIBER PREPREG IN EXTREMELY HIGH-TEMPERATURE DEFENSE AND SPACE APPLICATIONSPOLYIMIDE RESIN CARBON FIBER PREPREG MARKET, BY REGION
-
7.7 OTHER RESINSOTHER RESINS CARBON FIBER PREPREG MARKET, BY REGION
- 8.1 INTRODUCTION
-
8.2 AEROSPACE & DEFENSEINCREASING AIRCRAFT PRODUCTION BY BOEING AND AIRBUS TO DRIVE DEMAND FOR CARBON FIBER PREPREGCARBON FIBER PREPREG MARKET IN AEROSPACE & DEFENSE, BY REGIONASIA PACIFIC: CARBON FIBER PREPREG MARKET IN AEROSPACE & DEFENSE, BY KEY COUNTRIES
-
8.3 WIND ENERGYGROWTH IN INSTALLATION OF OFFSHORE WIND ENERGY TURBINES TO INCREASE DEMAND FOR CARBON FIBER PREPREGCARBON FIBER PREPREG MARKET IN WIND ENERGY, BY REGION
-
8.4 SPORTS & RECREATIONDEMAND FOR LIGHTWEIGHT AND HIGH-STRENGTH SPORTING GOODS FUELING USE OF CARBON FIBER PREPREGCARBON FIBER PREPREG MARKET IN SPORTS & RECREATION, BY REGION
-
8.5 AUTOMOTIVEGROWING USE OF CARBON FIBER PREPREG IN ELECTRIC CARS TO SIGNIFICANTLY IMPACT MARKET GROWTHCARBON FIBER PREPREG MARKET IN AUTOMOTIVE, BY REGION
-
8.6 OTHERSCARBON FIBER PREPREG MARKET IN OTHER INDUSTRIES, BY REGION
-
9.1 INTRODUCTIONCARBON FIBER PREPREG MARKET, BY REGION
-
9.2 NORTH AMERICANORTH AMERICA: CARBON FIBER PREPREG MARKET, BY RESIN TYPENORTH AMERICA: CARBON FIBER PREPREG MARKET, BY MANUFACTURING PROCESSNORTH AMERICA: CARBON FIBER PREPREG MARKET, BY END-USE INDUSTRYNORTH AMERICA: CARBON FIBER PREPREG MARKET, BY COUNTRY- US- Canada
-
9.3 EUROPEEUROPE: CARBON FIBER PREPREG MARKET, BY RESIN TYPEEUROPE: CARBON FIBER PREPREG MARKET, BY MANUFACTURING PROCESSEUROPE: CARBON FIBER PREPREG MARKET, BY END-USE INDUSTRYEUROPE: CARBON FIBER PREPREG MARKET, BY COUNTRY- Germany- France- UK- Spain- Italy- Rest of Europe
-
9.4 ASIA PACIFICIMPACT OF COVID-19ASIA PACIFIC: CARBON FIBER PREPREG MARKET, BY RESIN TYPEASIA PACIFIC: CARBON FIBER PREPREG MARKET, BY MANUFACTURING PROCESSASIA PACIFIC: CARBON FIBER PREPREG MARKET, BY END-USE INDUSTRYASIA PACIFIC: CARBON FIBER PREPREG MARKET, BY COUNTRY- China- Japan- Taiwan- South Korea- Rest of Asia Pacific
-
9.5 LATIN AMERICALATIN AMERICA: CARBON FIBER PREPREG MARKET, BY RESIN TYPELATIN AMERICA: CARBON FIBER PREPREG MARKET, BY MANUFACTURING PROCESSLATIN AMERICA: CARBON FIBER PREPREG MARKET, BY END-USE INDUSTRYLATIN AMERICA: CARBON FIBER PREPREG MARKET, BY COUNTRY- Brazil- Mexico- Rest of Latin America
-
9.6 MIDDLE EAST & AFRICAMIDDLE EAST & AFRICA: CARBON FIBER PREPREG MARKET, BY RESIN TYPEMIDDLE EAST & AFRICA: CARBON FIBER PREPREG MARKET, BY MANUFACTURING PROCESSMIDDLE EAST & AFRICA: CARBON FIBER PREPREG MARKET, BY END-USE INDUSTRYMIDDLE EAST & AFRICA: CARBON FIBER PREPREG MARKET, BY COUNTRY- South Africa- Saudi Arabia- UAE- Rest of Middle East & Africa
- 10.1 INTRODUCTION
- 10.2 MARKET SHARE ANALYSIS
- 10.3 MARKET RANKING
- 10.4 REVENUE ANALYSIS OF TOP PLAYERS
- 10.5 COMPETITIVE BENCHMARKING
-
10.6 COMPANY EVALUATION MATRIXSTARSPERVASIVE PLAYERSPARTICIPANTSEMERGING LEADERSSTRENGTH OF PRODUCT PORTFOLIOBUSINESS STRATEGY EXCELLENCE
- 10.7 MARKET EVALUATION FRAMEWORK
- 10.8 COMPETITIVE BENCHMARKING OF KEY START-UPS/SMES
-
10.9 SMALL AND MEDIUM-SIZED ENTERPRISES (SME) EVALUATION MATRIXPROGRESSIVE COMPANIESRESPONSIVE COMPANIESDYNAMIC COMPANIESSTARTING BLOCKS
-
11.1 KEY COMPANIESMITSUBISHI CHEMICAL CARBON FIBER AND COMPOSITES, INC.- Business overview- Products/Solutions/Services offered- Recent developments- MnM viewSOLVAY- Business overview- Products/Solutions/Services offered- Recent developments- MnM viewTEIJIN LIMITED- Business overview- Products/Solutions/Services offered- Recent developments- MnM viewTORAY INDUSTRIES INC.- Business overview- Products/Solutions/Services offered- Recent developments- MnM viewHEXCEL CORPORATION- Business overview- Products/Solutions/Services offered- Recent developments- MnM viewGURIT HOLDING AG- Business overview- Products/Solutions/Services offered- Recent developments- MnM viewROCK WEST COMPOSITES, INC.- Business overview- Products/Solutions/Services offered- MnM viewSGL CARBON- Business overview- Products/Solutions/Services offered- Recent developments- MnM viewPARK AEROSPACE CORP.- Business overview- Products/Solutions/Services offered- Recent developments- MnM viewAXIOM MATERIALS, INC.- Business overview- Products/Solutions/Services offered- Recent developments- MnM view
-
11.2 OTHER COMPANIESWEIHAI GUANGWEI COMPOSITES MATERIALS CO., LTD.MALLINDA, INC.SICHUAN XINWANXING CARBON FIBER COMPOSITES CO., LTD.DEXCRAFT3A ASSOCIATES INCORPORATEDROCKMAN ADVANCED COMPOSITESKINECO LIMITEDTAIWAN FIRST LI-BOND CO., LTD.NORTH THIN PLY TECHNOLOGYTCR COMPOSITESPLASTIC REINFORCEMENT FABRICS LTD.BARRDAY INC.GMS COMPOSITESHANKUK CARBONABC COMPOSITES
- 12.1 DISCUSSION GUIDE
- 12.2 KNOWLEDGESTORE: MARKETSANDMARKETS' SUBSCRIPTION PORTAL
- 12.3 CUSTOMIZATION OPTIONS
- 12.4 RELATED REPORT
- 12.5 AUTHOR DETAILS
- TABLE 1 EUROPE: NEW PASSENGER VEHICLES CO2 EMISSIONS, BY MANUFACTURER (2016 AND 2020/21 TARGETS (G/KM)
- TABLE 2 NEW WIND POWER INSTALLATIONS, BY REGION (2020–2025)
- TABLE 3 CARBON FIBER PREPREG MARKET: PORTER’S FIVE FORCES ANALYSIS
- TABLE 4 CARBON FIBER PREPREG MARKET: ROLE IN ECOSYSTEM
- TABLE 5 INFLUENCE OF STAKEHOLDERS ON BUYING PROCESS FOR TOP 3 END-USE INDUSTRIES
- TABLE 6 KEY BUYING CRITERIA FOR TOP 3 END-USE INDUSTRIES
- TABLE 7 COMPARATIVE STUDY OF PREPREG MANUFACTURING PROCESSES
- TABLE 8 AVERAGE SELLING PRICES OF KEY PLAYERS, BY MANUFACTURING PROCESS (USD/KG)
- TABLE 9 CARBON FIBER PREPREG AVERAGE SELLING PRICE, BY REGION
- TABLE 10 CARBON FIBER PREPREG MARKET: CAGR (BY VALUE) IN OPTIMISTIC, PESSIMISTIC, AND REALISTIC SCENARIOS
- TABLE 11 LIST OF CONFERENCES & EVENTS RELATED TO CARBON FIBER PREPREG AND RELATED MARKETS, 2022–2023
- TABLE 12 NORTH AMERICA: LIST OF REGULATORY BODIES, GOVERNMENT AGENCIES, AND OTHER ORGANIZATIONS
- TABLE 13 EUROPE: LIST OF REGULATORY BODIES, GOVERNMENT AGENCIES, AND OTHER ORGANIZATIONS
- TABLE 14 ASIA PACIFIC: LIST OF REGULATORY BODIES, GOVERNMENT AGENCIES, AND OTHER ORGANIZATIONS
- TABLE 15 REST OF THE WORLD: LIST OF REGULATORY BODIES, GOVERNMENT AGENCIES, AND OTHER ORGANIZATIONS
- TABLE 16 LIST OF PATENTS
- TABLE 17 CARBON FIBER PREPREG MARKET SIZE, BY MANUFACTURING PROCESS, 2018–2021 (KILOTON)
- TABLE 18 CARBON FIBER PREPREG MARKET SIZE, BY MANUFACTURING PROCESS, 2018–2021 (USD MILLION)
- TABLE 19 CARBON FIBER PREPREG MARKET SIZE, BY MANUFACTURING PROCESS, 2022–2027 (KILOTON)
- TABLE 20 CARBON FIBER PREPREG MARKET SIZE, BY MANUFACTURING PROCESS, 2022–2027 (USD MILLION)
- TABLE 21 HOT MELT PROCESS MARKET SIZE, BY REGION, 2018–2021 (KILOTON)
- TABLE 22 HOT MELT PROCESS MARKET SIZE, BY REGION, 2018–2021 (USD MILLION)
- TABLE 23 HOT MELT PROCESS MARKET SIZE, BY REGION, 2022–2027 (KILOTON)
- TABLE 24 HOT MELT PROCESS MARKET SIZE, BY REGION, 2022–2027 (USD MILLION)
- TABLE 25 SOLVENT DIP PROCESS MARKET SIZE, BY REGION, 2018–2021 (KILOTON)
- TABLE 26 SOLVENT DIP PROCESS MARKET SIZE, BY REGION, 2018–2021 (USD MILLION)
- TABLE 27 SOLVENT DIP PROCESS MARKET SIZE, BY REGION, 2022–2027 (KILOTON)
- TABLE 28 SOLVENT DIP PROCESS MARKET SIZE, BY REGION, 2022–2027 (USD MILLION)
- TABLE 29 CARBON FIBER PREPREG MARKET SIZE, BY RESIN TYPE, 2018–2021 (KILOTON)
- TABLE 30 CARBON FIBER PREPREG MARKET SIZE, BY RESIN TYPE, 2018–2021 (USD MILLION)
- TABLE 31 CARBON FIBER PREPREG MARKET SIZE, BY RESIN TYPE, 2022–2027 (KILOTON)
- TABLE 32 CARBON FIBER PREPREG MARKET SIZE, BY RESIN TYPE, 2022–2027 (USD MILLION)
- TABLE 33 EPOXY RESIN CARBON FIBER PREPREG MARKET SIZE, BY REGION, 2018–2021 (KILOTON)
- TABLE 34 EPOXY RESIN CARBON FIBER PREPREG MARKET SIZE, BY REGION, 2018–2021 (USD MILLION)
- TABLE 35 EPOXY RESIN CARBON FIBER PREPREG MARKET SIZE, BY REGION, 2022–2027 (KILOTON)
- TABLE 36 EPOXY RESIN CARBON FIBER PREPREG MARKET SIZE, BY REGION, 2022–2027 (USD MILLION)
- TABLE 37 PHENOLIC RESIN CARBON FIBER PREPREG MARKET SIZE, BY REGION, 2018–2021 (KILOTON)
- TABLE 38 PHENOLIC RESIN CARBON FIBER PREPREG MARKET SIZE, BY REGION, 2018–2021 (USD MILLION)
- TABLE 39 PHENOLIC RESIN CARBON FIBER PREPREG MARKET SIZE, BY REGION, 2022–2027 (KILOTON)
- TABLE 40 PHENOLIC RESIN CARBON FIBER PREPREG MARKET SIZE, BY REGION, 2022–2027 (USD MILLION)
- TABLE 41 THERMOPLASTIC RESIN CARBON FIBER PREPREG MARKET SIZE, BY REGION, 2018–2021 (KILOTON)
- TABLE 42 THERMOPLASTIC RESIN CARBON FIBER PREPREG MARKET SIZE, BY REGION, 2018–2021 (USD MILLION)
- TABLE 43 THERMOPLASTIC RESIN CARBON FIBER PREPREG MARKET SIZE, BY REGION, 2022–2027 (KILOTON)
- TABLE 44 THERMOPLASTIC RESIN CARBON FIBER PREPREG MARKET SIZE, BY REGION, 2022–2027 (USD MILLION)
- TABLE 45 BMI RESIN CARBON FIBER PREPREG MARKET SIZE, BY REGION, 2018–2021 (KILOTON)
- TABLE 46 BMI RESIN CARBON FIBER PREPREG MARKET SIZE, BY REGION, 2018–2021 (USD MILLION)
- TABLE 47 BMI RESIN CARBON FIBER PREPREG MARKET SIZE, BY REGION, 2022–2027 (KILOTON)
- TABLE 48 BMI RESIN CARBON FIBER PREPREG MARKET SIZE, BY REGION, 2022–2027 (USD MILLION)
- TABLE 49 POLYIMIDE RESIN CARBON FIBER PREPREG MARKET SIZE, BY REGION, 2018–2021 (KILOTON)
- TABLE 50 POLYIMIDE RESIN CARBON FIBER PREPREG MARKET SIZE, BY REGION, 2018–2021 (USD MILLION)
- TABLE 51 POLYIMIDE RESIN CARBON FIBER PREPREG MARKET SIZE, BY REGION, 2022–2027 (KILOTON)
- TABLE 52 POLYIMIDE RESIN CARBON FIBER PREPREG MARKET SIZE, BY REGION, 2022–2027 (USD MILLION)
- TABLE 53 OTHER RESINS CARBON FIBER PREPREG MARKET SIZE, BY REGION, 2018–2021 (KILOTON)
- TABLE 54 OTHER RESINS CARBON FIBER PREPREG MARKET SIZE, BY REGION, 2018–2021 (USD MILLION)
- TABLE 55 OTHER RESINS CARBON FIBER PREPREG MARKET SIZE, BY REGION, 2022–2027 (KILOTON)
- TABLE 56 OTHER RESINS CARBON FIBER PREPREG MARKET SIZE, BY REGION, 2022–2027 (USD MILLION)
- TABLE 57 CARBON FIBER PREPREG MARKET SIZE, BY END-USE INDUSTRY, 2018–2021 (KILOTON)
- TABLE 58 CARBON FIBER PREPREG MARKET SIZE, BY END-USE INDUSTRY, 2018–2021 (USD MILLION)
- TABLE 59 CARBON FIBER PREPREG MARKET SIZE, BY END-USE INDUSTRY, 2022–2027 (KILOTON)
- TABLE 60 CARBON FIBER PREPREG MARKET SIZE, BY END-USE INDUSTRY, 2022–2027 (USD MILLION)
- TABLE 61 NUMBER OF NEW AIRPLANES REQUIRED, BY REGION, 2019–2038
- TABLE 62 CARBON FIBER PREPREG MARKET SIZE IN AEROSPACE & DEFENSE, BY REGION, 2018–2021 (KILOTON)
- TABLE 63 CARBON FIBER PREPREG MARKET SIZE IN AEROSPACE & DEFENSE, BY REGION, 2018–2021 (USD MILLION)
- TABLE 64 CARBON FIBER PREPREG MARKET SIZE IN AEROSPACE & DEFENSE, BY REGION, 2022–2027 (KILOTON)
- TABLE 65 CARBON FIBER PREPREG MARKET SIZE IN AEROSPACE & DEFENSE, BY REGION, 2022–2027 (USD MILLION)
- TABLE 66 ASIA PACIFIC: CARBON FIBER PREPREG MARKET SIZE IN AEROSPACE & DEFENSE, BY KEY COUNTRIES, 2018–2021 (KILOTON)
- TABLE 67 ASIA PACIFIC: CARBON FIBER PREPREG MARKET SIZE IN AEROSPACE & DEFENSE, BY KEY COUNTRIES, 2018–2021 (USD MILLION)
- TABLE 68 ASIA PACIFIC: CARBON FIBER PREPREG MARKET SIZE IN AEROSPACE & DEFENSE, BY KEY COUNTRIES, 2022–2027 (KILOTON)
- TABLE 69 ASIA PACIFIC: CARBON FIBER PREPREG MARKET SIZE IN AEROSPACE & DEFENSE, BY KEY COUNTRIES, 2022–2027 (USD MILLION)
- TABLE 70 ESTIMATED NEW OFFSHORE WIND INSTALLATIONS, BY REGION, 2019–2030
- TABLE 71 CARBON FIBER PREPREG MARKET SIZE IN WIND ENERGY, BY REGION, 2018–2021 (KILOTON)
- TABLE 72 CARBON FIBER PREPREG MARKET SIZE IN WIND ENERGY, BY REGION, 2018–2021 (USD MILLION)
- TABLE 73 CARBON FIBER PREPREG MARKET SIZE IN WIND ENERGY, BY REGION, 2022–2027 (KILOTON)
- TABLE 74 CARBON FIBER PREPREG MARKET SIZE IN WIND ENERGY, BY REGION, 2022–2027 (USD MILLION)
- TABLE 75 CARBON FIBER PREPREG MARKET SIZE IN SPORTS & RECREATION, BY REGION, 2018–2021 (KILOTON)
- TABLE 76 CARBON FIBER PREPREG MARKET SIZE IN SPORTS & RECREATION, BY REGION, 2018–2021 (USD MILLION)
- TABLE 77 CARBON FIBER PREPREG MARKET SIZE IN SPORTS & RECREATION, BY REGION, 2022–2027 (KILOTON)
- TABLE 78 CARBON FIBER PREPREG MARKET SIZE IN SPORTS & RECREATION, BY REGION, 2022–2027 (USD MILLION)
- TABLE 79 CARBON FIBER PREPREG MARKET SIZE IN AUTOMOTIVE, BY REGION, 2018–2021 (KILOTON)
- TABLE 80 CARBON FIBER PREPREG MARKET SIZE IN AUTOMOTIVE, BY REGION, 2018–2021 (USD MILLION)
- TABLE 81 CARBON FIBER PREPREG MARKET SIZE IN AUTOMOTIVE, BY REGION, 2022–2027 (KILOTON)
- TABLE 82 CARBON FIBER PREPREG MARKET SIZE IN AUTOMOTIVE, BY REGION, 2022–2027 (USD MILLION)
- TABLE 83 CARBON FIBER PREPREG MARKET SIZE IN OTHER INDUSTRIES, BY REGION, 2018–2021 (KILOTON)
- TABLE 84 CARBON FIBER PREPREG MARKET SIZE IN OTHER INDUSTRIES, BY REGION, 2018–2021 (USD MILLION)
- TABLE 85 CARBON FIBER PREPREG MARKET SIZE IN OTHER INDUSTRIES, BY REGION, 2022–2027 (KILOTON)
- TABLE 86 CARBON FIBER PREPREG MARKET SIZE IN OTHER INDUSTRIES, BY REGION, 2022–2027 (USD MILLION)
- TABLE 87 CARBON FIBER PREPREG MARKET SIZE, BY REGION, 2018–2021 (KILOTON)
- TABLE 88 CARBON FIBER PREPREG MARKET SIZE, BY REGION, 2018–2021 (USD MILLION)
- TABLE 89 CARBON FIBER PREPREG MARKET SIZE, BY REGION, 2022–2027 (KILOTON)
- TABLE 90 CARBON FIBER PREPREG MARKET SIZE, BY REGION, 2022–2027 (USD MILLION)
- TABLE 91 NORTH AMERICA: CARBON FIBER PREPREG MARKET SIZE, BY RESIN TYPE, 2018–2021 (KILOTON)
- TABLE 92 NORTH AMERICA: CARBON FIBER PREPREG MARKET SIZE, BY RESIN TYPE, 2018–2021 (USD MILLION)
- TABLE 93 NORTH AMERICA: CARBON FIBER PREPREG MARKET SIZE, BY RESIN TYPE, 2022–2027 (KILOTON)
- TABLE 94 NORTH AMERICA: CARBON FIBER PREPREG MARKET SIZE, BY RESIN TYPE, 2022–2027 (USD MILLION)
- TABLE 95 NORTH AMERICA: CARBON FIBER PREPREG MARKET SIZE, BY MANUFACTURING PROCESS, 2018–2021 (KILOTON)
- TABLE 96 NORTH AMERICA: CARBON FIBER PREPREG MARKET SIZE, BY MANUFACTURING PROCESS, 2018–2021 (USD MILLION)
- TABLE 97 NORTH AMERICA: CARBON FIBER PREPREG MARKET SIZE, BY MANUFACTURING PROCESS, 2022–2027 (KILOTON)
- TABLE 98 NORTH AMERICA: CARBON FIBER PREPREG MARKET SIZE, BY MANUFACTURING PROCESS, 2022–2027 (USD MILLION)
- TABLE 99 NORTH AMERICA: CARBON FIBER PREPREG MARKET SIZE, BY END-USE INDUSTRY, 2018–2021 (KILOTON)
- TABLE 100 NORTH AMERICA: CARBON FIBER PREPREG MARKET SIZE, BY END-USE INDUSTRY, 2018–2021 (USD MILLION)
- TABLE 101 NORTH AMERICA: CARBON FIBER PREPREG MARKET SIZE, BY END-USE INDUSTRY, 2022–2027 (KILOTON)
- TABLE 102 NORTH AMERICA: CARBON FIBER PREPREG MARKET SIZE, BY END-USE INDUSTRY, 2022–2027 (USD MILLION)
- TABLE 103 NORTH AMERICA: CARBON FIBER PREPREG MARKET SIZE, BY COUNTRY, 2018–2021 (KILOTON)
- TABLE 104 NORTH AMERICA: CARBON FIBER PREPREG MARKET SIZE, BY COUNTRY, 2018–2021 (USD MILLION)
- TABLE 105 NORTH AMERICA: CARBON FIBER PREPREG MARKET SIZE, BY COUNTRY, 2022–2027 (KILOTON)
- TABLE 106 NORTH AMERICA: CARBON FIBER PREPREG MARKET SIZE, BY COUNTRY, 2022–2027 (USD MILLION)
- TABLE 107 US: CARBON FIBER PREPREG MARKET SIZE, BY END-USE INDUSTRY, 2018–2021 (KILOTON)
- TABLE 108 US: CARBON FIBER PREPREG MARKET SIZE, BY END-USE INDUSTRY, 2018–2021 (USD MILLION)
- TABLE 109 US: CARBON FIBER PREPREG MARKET SIZE, BY END-USE INDUSTRY, 2022–2027 (KILOTON)
- TABLE 110 US: CARBON FIBER PREPREG MARKET SIZE, BY END-USE INDUSTRY, 2022–2027 (USD MILLION)
- TABLE 111 CANADA: CARBON FIBER PREPREG MARKET SIZE, BY END-USE INDUSTRY, 2018–2021 (KILOTON)
- TABLE 112 CANADA: CARBON FIBER PREPREG MARKET SIZE, BY END-USE INDUSTRY, 2018–2021 (USD MILLION)
- TABLE 113 CANADA: CARBON FIBER PREPREG MARKET SIZE, BY END-USE INDUSTRY, 2022–2027 (KILOTON)
- TABLE 114 CANADA: CARBON FIBER PREPREG MARKET SIZE, BY END-USE INDUSTRY, 2022–2027 (USD MILLION)
- TABLE 115 EUROPE: CARBON FIBER PREPREG MARKET SIZE, BY RESIN TYPE, 2018–2021 (KILOTON)
- TABLE 116 EUROPE: CARBON FIBER PREPREG MARKET SIZE, BY RESIN TYPE, 2018–2021 (USD MILLION)
- TABLE 117 EUROPE: CARBON FIBER PREPREG MARKET SIZE, BY RESIN TYPE, 2022–2027 (KILOTON)
- TABLE 118 EUROPE: CARBON FIBER PREPREG MARKET SIZE, BY RESIN TYPE, 2022–2027 (USD MILLION)
- TABLE 119 EUROPE: CARBON FIBER PREPREG MARKET SIZE, BY MANUFACTURING PROCESS, 2018–2021 (KILOTON)
- TABLE 120 EUROPE: CARBON FIBER PREPREG MARKET SIZE, BY MANUFACTURING PROCESS, 2018–2021 (USD MILLION)
- TABLE 121 EUROPE: CARBON FIBER PREPREG MARKET SIZE, BY MANUFACTURING PROCESS, 2022–2027 (KILOTON)
- TABLE 122 EUROPE: CARBON FIBER PREPREG MARKET SIZE, BY MANUFACTURING PROCESS, 2022–2027 (USD MILLION)
- TABLE 123 EUROPE: CARBON FIBER PREPREG MARKET SIZE, BY END-USE INDUSTRY, 2018–2021 (KILOTON)
- TABLE 124 EUROPE: CARBON FIBER PREPREG MARKET SIZE, BY END-USE INDUSTRY, 2018–2021 (USD MILLION)
- TABLE 125 EUROPE: CARBON FIBER PREPREG MARKET SIZE, BY END-USE INDUSTRY, 2022–2027 (KILOTON)
- TABLE 126 EUROPE: CARBON FIBER PREPREG MARKET SIZE, BY END-USE INDUSTRY, 2022–2027 (USD MILLION)
- TABLE 127 EUROPE: CARBON FIBER PREPREG MARKET SIZE, BY COUNTRY, 2018–2021 (KILOTON)
- TABLE 128 EUROPE: CARBON FIBER PREPREG MARKET SIZE, BY COUNTRY, 2018–2021 (USD MILLION)
- TABLE 129 EUROPE: CARBON FIBER PREPREG MARKET SIZE, BY COUNTRY, 2022–2027 (KILOTON)
- TABLE 130 EUROPE: CARBON FIBER PREPREG MARKET SIZE, BY COUNTRY, 2022–2027 (USD MILLION)
- TABLE 131 GERMANY: CARBON FIBER PREPREG MARKET SIZE, BY END-USE INDUSTRY, 2018–2021 (KILOTON)
- TABLE 132 GERMANY: CARBON FIBER PREPREG MARKET SIZE, BY END-USE INDUSTRY, 2018–2021 (USD MILLION)
- TABLE 133 GERMANY: CARBON FIBER PREPREG MARKET SIZE, BY END-USE INDUSTRY, 2022–2027 (KILOTON)
- TABLE 134 GERMANY: CARBON FIBER PREPREG MARKET SIZE, BY END-USE INDUSTRY, 2022–2027 (USD MILLION)
- TABLE 135 FRANCE: CARBON FIBER PREPREG MARKET SIZE, BY END-USE INDUSTRY, 2018–2021 (KILOTON)
- TABLE 136 FRANCE: CARBON FIBER PREPREG MARKET SIZE, BY END-USE INDUSTRY, 2018–2021 (USD MILLION)
- TABLE 137 FRANCE: CARBON FIBER PREPREG MARKET SIZE, BY END-USE INDUSTRY, 2022–2027 (KILOTON)
- TABLE 138 FRANCE: CARBON FIBER PREPREG MARKET SIZE, BY END-USE INDUSTRY, 2022–2027 (USD MILLION)
- TABLE 139 UK: CARBON FIBER PREPREG MARKET SIZE, BY END-USE INDUSTRY, 2018–2021 (KILOTON)
- TABLE 140 UK: CARBON FIBER PREPREG MARKET SIZE, BY END-USE INDUSTRY, 2018–2021 (USD MILLION)
- TABLE 141 UK: CARBON FIBER PREPREG MARKET SIZE, BY END-USE INDUSTRY, 2022–2027 (KILOTON)
- TABLE 142 UK: CARBON FIBER PREPREG MARKET SIZE, BY END-USE INDUSTRY, 2022–2027 (USD MILLION)
- TABLE 143 SPAIN: CARBON FIBER PREPREG MARKET SIZE, BY END-USE INDUSTRY, 2018–2021 (KILOTON)
- TABLE 144 SPAIN: CARBON FIBER PREPREG MARKET SIZE, BY END-USE INDUSTRY, 2018–2021 (USD MILLION)
- TABLE 145 SPAIN: CARBON FIBER PREPREG MARKET SIZE, BY END-USE INDUSTRY, 2022–2027 (KILOTON)
- TABLE 146 SPAIN: CARBON FIBER PREPREG MARKET SIZE, BY END-USE INDUSTRY, 2022–2027 (USD MILLION)
- TABLE 147 ITALY: CARBON FIBER PREPREG MARKET SIZE, BY END-USE INDUSTRY, 2018–2021 (KILOTON)
- TABLE 148 ITALY: CARBON FIBER PREPREG MARKET SIZE, BY END-USE INDUSTRY, 2018–2021 (USD MILLION)
- TABLE 149 ITALY: CARBON FIBER PREPREG MARKET SIZE, BY END-USE INDUSTRY, 2022–2027 (KILOTON)
- TABLE 150 ITALY: CARBON FIBER PREPREG MARKET SIZE, BY END-USE INDUSTRY, 2022–2027 (USD MILLION)
- TABLE 151 REST OF EUROPE: CARBON FIBER PREPREG MARKET SIZE, BY END-USE INDUSTRY, 2018–2021 (KILOTON)
- TABLE 152 REST OF EUROPE: CARBON FIBER PREPREG MARKET SIZE, BY END-USE INDUSTRY, 2018–2021 (USD MILLION)
- TABLE 153 REST OF EUROPE: CARBON FIBER PREPREG MARKET SIZE, BY END-USE INDUSTRY, 2022–2027 (KILOTON)
- TABLE 154 REST OF EUROPE: CARBON FIBER PREPREG MARKET SIZE, BY END-USE INDUSTRY, 2022–2027 (USD MILLION)
- TABLE 155 ASIA PACIFIC: CARBON FIBER PREPREG MARKET SIZE, BY RESIN TYPE, 2018–2021 (KILOTON)
- TABLE 156 ASIA PACIFIC: CARBON FIBER PREPREG MARKET SIZE, BY RESIN TYPE, 2018–2021 (USD MILLION)
- TABLE 157 ASIA PACIFIC: CARBON FIBER PREPREG MARKET SIZE, BY RESIN TYPE, 2022–2027 (KILOTON)
- TABLE 158 ASIA PACIFIC: CARBON FIBER PREPREG MARKET SIZE, BY RESIN TYPE, 2022–2027 (USD MILLION)
- TABLE 159 ASIA PACIFIC: CARBON FIBER PREPREG MARKET SIZE, BY MANUFACTURING PROCESS, 2018–2021 (KILOTON)
- TABLE 160 ASIA PACIFIC: CARBON FIBER PREPREG MARKET SIZE, BY MANUFACTURING PROCESS, 2018–2021 (USD MILLION)
- TABLE 161 ASIA PACIFIC: CARBON FIBER PREPREG MARKET SIZE, BY MANUFACTURING PROCESS, 2022–2027 (KILOTON)
- TABLE 162 ASIA PACIFIC: CARBON FIBER PREPREG MARKET SIZE, BY MANUFACTURING PROCESS, 2022–2027 (USD MILLION)
- TABLE 163 ASIA PACIFIC: CARBON FIBER PREPREG MARKET SIZE, BY END-USE INDUSTRY, 2018–2021 (KILOTON)
- TABLE 164 ASIA PACIFIC: CARBON FIBER PREPREG MARKET SIZE, BY END-USE INDUSTRY, 2018–2021 (USD MILLION)
- TABLE 165 ASIA PACIFIC: CARBON FIBER PREPREG MARKET SIZE, BY END-USE INDUSTRY, 2022–2027 (KILOTON)
- TABLE 166 ASIA PACIFIC: CARBON FIBER PREPREG MARKET SIZE, BY END-USE INDUSTRY, 2022–2027 (USD MILLION)
- TABLE 167 ASIA PACIFIC: CARBON FIBER PREPREG MARKET SIZE, BY COUNTRY, 2018–2021 (KILOTON)
- TABLE 168 ASIA PACIFIC: CARBON FIBER PREPREG MARKET SIZE, BY COUNTRY, 2018–2021 (USD MILLION)
- TABLE 169 ASIA PACIFIC: CARBON FIBER PREPREG MARKET SIZE, BY COUNTRY, 2022–2027 (KILOTON)
- TABLE 170 ASIA PACIFIC: CARBON FIBER PREPREG MARKET SIZE, BY COUNTRY, 2022–2027 (USD MILLION)
- TABLE 171 CHINA: ANNUAL WIND ENERGY CAPACITY INSTALLATIONS, 2012–2017 (MW)
- TABLE 172 CHINA: CARBON FIBER PREPREG MARKET SIZE, BY END-USE INDUSTRY, 2018–2021 (KILOTON)
- TABLE 173 CHINA: CARBON FIBER PREPREG MARKET SIZE, BY END-USE INDUSTRY, 2018–2021 (USD MILLION)
- TABLE 174 CHINA: CARBON FIBER PREPREG MARKET SIZE, BY END-USE INDUSTRY, 2022–2027 (KILOTON)
- TABLE 175 CHINA: CARBON FIBER PREPREG MARKET SIZE, BY END-USE INDUSTRY, 2022–2027 (USD MILLION)
- TABLE 176 JAPAN: CARBON FIBER PREPREG MARKET SIZE, BY END-USE INDUSTRY, 2018–2021 (KILOTON)
- TABLE 177 JAPAN: CARBON FIBER PREPREG MARKET SIZE, BY END-USE INDUSTRY, 2018–2021 (USD MILLION)
- TABLE 178 JAPAN: CARBON FIBER PREPREG MARKET SIZE, BY END-USE INDUSTRY, 2022–2027 (KILOTON)
- TABLE 179 JAPAN: CARBON FIBER PREPREG MARKET SIZE, BY END-USE INDUSTRY, 2022–2027 (USD MILLION)
- TABLE 180 TAIWAN: CARBON FIBER PREPREG MARKET SIZE, BY END-USE INDUSTRY, 2018–2021 (KILOTON)
- TABLE 181 TAIWAN: CARBON FIBER PREPREG MARKET SIZE, BY END-USE INDUSTRY, 2018–2021 (USD MILLION)
- TABLE 182 TAIWAN: CARBON FIBER PREPREG MARKET SIZE, BY END-USE INDUSTRY, 2022–2027 (KILOTON)
- TABLE 183 TAIWAN: CARBON FIBER PREPREG MARKET SIZE, BY END-USE INDUSTRY, 2022–2027 (USD MILLION)
- TABLE 184 SOUTH KOREA: CARBON FIBER PREPREG MARKET SIZE, BY END-USE INDUSTRY, 2018–2021 (KILOTON)
- TABLE 185 SOUTH KOREA: CARBON FIBER PREPREG MARKET SIZE, BY END-USE INDUSTRY, 2018–2021 (USD MILLION)
- TABLE 186 SOUTH KOREA: CARBON FIBER PREPREG MARKET SIZE, BY END-USE INDUSTRY, 2022–2027 (KILOTON)
- TABLE 187 SOUTH KOREA: CARBON FIBER PREPREG MARKET SIZE, BY END-USE INDUSTRY, 2022–2027 (USD MILLION)
- TABLE 188 REST OF ASIA PACIFIC: CARBON FIBER PREPREG MARKET SIZE, BY END-USE INDUSTRY, 2018–2021 (KILOTON)
- TABLE 189 REST OF ASIA PACIFIC: CARBON FIBER PREPREG MARKET SIZE, BY END-USE INDUSTRY, 2018–2021 (USD MILLION)
- TABLE 190 REST OF ASIA PACIFIC: CARBON FIBER PREPREG MARKET SIZE, BY END-USE INDUSTRY, 2022–2027 (KILOTON)
- TABLE 191 REST OF ASIA PACIFIC: CARBON FIBER PREPREG MARKET SIZE, BY END-USE INDUSTRY, 2022–2027 (USD MILLION)
- TABLE 192 LATIN AMERICA: CARBON FIBER PREPREG MARKET SIZE, BY RESIN TYPE, 2018–2021 (KILOTON)
- TABLE 193 LATIN AMERICA: CARBON FIBER PREPREG MARKET SIZE, BY RESIN TYPE, 2018–2021 (USD MILLION)
- TABLE 194 LATIN AMERICA: CARBON FIBER PREPREG MARKET SIZE, BY RESIN TYPE, 2022–2027 (KILOTON)
- TABLE 195 LATIN AMERICA: CARBON FIBER PREPREG MARKET SIZE, BY RESIN TYPE, 2022–2027 (USD MILLION)
- TABLE 196 LATIN AMERICA: CARBON FIBER PREPREG MARKET SIZE, BY MANUFACTURING PROCESS, 2018–2021 (KILOTON)
- TABLE 197 LATIN AMERICA: CARBON FIBER PREPREG MARKET SIZE, BY MANUFACTURING PROCESS, 2018–2021 (USD MILLION)
- TABLE 198 LATIN AMERICA: CARBON FIBER PREPREG MARKET SIZE, BY MANUFACTURING PROCESS, 2022–2027 (KILOTON)
- TABLE 199 LATIN AMERICA: CARBON FIBER PREPREG MARKET SIZE, BY MANUFACTURING PROCESS, 2022–2027 (USD MILLION)
- TABLE 200 LATIN AMERICA: CARBON FIBER PREPREG MARKET SIZE, BY END-USE INDUSTRY, 2018–2021 (KILOTON)
- TABLE 201 LATIN AMERICA: CARBON FIBER PREPREG MARKET SIZE, BY END-USE INDUSTRY, 2018–2021 (USD MILLION)
- TABLE 202 LATIN AMERICA: CARBON FIBER PREPREG MARKET SIZE, BY END-USE INDUSTRY, 2022–2027 (KILOTON)
- TABLE 203 LATIN AMERICA: CARBON FIBER PREPREG MARKET SIZE, BY END-USE INDUSTRY, 2022–2027 (USD MILLION)
- TABLE 204 LATIN AMERICA: CARBON FIBER PREPREG MARKET SIZE, BY COUNTRY, 2018–2021 (KILOTON)
- TABLE 205 LATIN AMERICA: CARBON FIBER PREPREG MARKET SIZE, BY COUNTRY, 2018–2021 (USD MILLION)
- TABLE 206 LATIN AMERICA: CARBON FIBER PREPREG MARKET SIZE, BY COUNTRY, 2022–2027 (KILOTON)
- TABLE 207 LATIN AMERICA: CARBON FIBER PREPREG MARKET SIZE, BY COUNTRY, 2022–2027 (USD MILLION)
- TABLE 208 BRAZIL: WIND ENERGY CAPACITY INSTALLATIONS, 2010–2020 (MW)
- TABLE 209 BRAZIL: CARBON FIBER PREPREG MARKET SIZE, BY END-USE INDUSTRY, 2018–2021 (KILOTON)
- TABLE 210 BRAZIL: CARBON FIBER PREPREG MARKET SIZE, BY END-USE INDUSTRY, 2018–2021 (USD MILLION)
- TABLE 211 BRAZIL: CARBON FIBER PREPREG MARKET SIZE, BY END-USE INDUSTRY, 2022–2027 (KILOTON)
- TABLE 212 BRAZIL: CARBON FIBER PREPREG MARKET SIZE, BY END-USE INDUSTRY, 2022–2027 (USD MILLION)
- TABLE 213 MEXICO: CARBON FIBER PREPREG MARKET SIZE, BY END-USE INDUSTRY, 2018–2021 (KILOTON)
- TABLE 214 MEXICO: CARBON FIBER PREPREG MARKET SIZE, BY END-USE INDUSTRY, 2018–2021 (USD MILLION)
- TABLE 215 MEXICO: CARBON FIBER PREPREG MARKET SIZE, BY END-USE INDUSTRY, 2022–2027 (KILOTON)
- TABLE 216 MEXICO: CARBON FIBER PREPREG MARKET SIZE, BY END-USE INDUSTRY, 2022–2027 (USD MILLION)
- TABLE 217 REST OF LATIN AMERICA: CARBON FIBER PREPREG MARKET SIZE, BY END-USE INDUSTRY, 2018–2021 (KILOTON)
- TABLE 218 REST OF LATIN AMERICA: CARBON FIBER PREPREG MARKET SIZE, BY END-USE INDUSTRY, 2018–2021 (USD MILLION)
- TABLE 219 REST OF LATIN AMERICA: CARBON FIBER PREPREG MARKET SIZE, BY END-USE INDUSTRY, 2022–2027 (KILOTON)
- TABLE 220 REST OF LATIN AMERICA: CARBON FIBER PREPREG MARKET SIZE, BY END-USE INDUSTRY, 2022–2027 (USD MILLION)
- TABLE 221 MIDDLE EAST & AFRICA: CARBON FIBER PREPREG MARKET SIZE, BY RESIN TYPE, 2018–2021 (KILOTON)
- TABLE 222 MIDDLE EAST & AFRICA: CARBON FIBER PREPREG MARKET SIZE, BY RESIN TYPE, 2018–2021 (USD MILLION)
- TABLE 223 MIDDLE EAST & AFRICA: CARBON FIBER PREPREG MARKET SIZE, BY RESIN TYPE, 2022–2027 (KILOTON)
- TABLE 224 MIDDLE EAST & AFRICA: CARBON FIBER PREPREG MARKET SIZE, BY RESIN TYPE, 2022–2027 (USD MILLION)
- TABLE 225 MIDDLE EAST & AFRICA: CARBON FIBER PREPREG MARKET SIZE, BY MANUFACTURING PROCESS, 2018–2021 (KILOTON)
- TABLE 226 MIDDLE EAST & AFRICA: CARBON FIBER PREPREG MARKET SIZE, BY MANUFACTURING PROCESS, 2018–2021 (USD MILLION)
- TABLE 227 MIDDLE EAST & AFRICA: CARBON FIBER PREPREG MARKET SIZE, BY MANUFACTURING PROCESS, 2022–2027 (KILOTON)
- TABLE 228 MIDDLE EAST & AFRICA: CARBON FIBER PREPREG MARKET SIZE, BY MANUFACTURING PROCESS, 2022–2027 (USD MILLION)
- TABLE 229 MIDDLE EAST & AFRICA: CARBON FIBER PREPREG MARKET SIZE, BY END-USE INDUSTRY, 2018–2021 (KILOTON)
- TABLE 230 MIDDLE EAST & AFRICA: CARBON FIBER PREPREG MARKET SIZE, BY END-USE INDUSTRY, 2018–2021 (USD MILLION)
- TABLE 231 MIDDLE EAST & AFRICA: CARBON FIBER PREPREG MARKET SIZE, BY END-USE INDUSTRY, 2022–2027 (KILOTON)
- TABLE 232 MIDDLE EAST & AFRICA: CARBON FIBER PREPREG MARKET SIZE, BY END-USE INDUSTRY, 2022–2027 (USD MILLION)
- TABLE 233 MIDDLE EAST & AFRICA: CARBON FIBER PREPREG MARKET SIZE, BY COUNTRY, 2018–2021 (KILOTON)
- TABLE 234 MIDDLE EAST & AFRICA: CARBON FIBER PREPREG MARKET SIZE, BY COUNTRY, 2018–2021 (USD MILLION)
- TABLE 235 MIDDLE EAST & AFRICA: CARBON FIBER PREPREG MARKET SIZE, BY COUNTRY, 2022–2027 (KILOTON)
- TABLE 236 MIDDLE EAST & AFRICA: CARBON FIBER PREPREG MARKET SIZE, BY COUNTRY, 2022–2027 (USD MILLION)
- TABLE 237 SOUTH AFRICA: CARBON FIBER PREPREG MARKET SIZE, BY END-USE INDUSTRY, 2018–2021 (KILOTON)
- TABLE 238 SOUTH AFRICA: CARBON FIBER PREPREG MARKET SIZE, BY END-USE INDUSTRY, 2018–2021 (USD MILLION)
- TABLE 239 SOUTH AFRICA: CARBON FIBER PREPREG MARKET SIZE, BY END-USE INDUSTRY, 2022–2027 (KILOTON)
- TABLE 240 SOUTH AFRICA: CARBON FIBER PREPREG MARKET SIZE, BY END-USE INDUSTRY, 2022–2027 (USD MILLION)
- TABLE 241 SAUDI ARABIA: CARBON FIBER PREPREG MARKET SIZE, BY END-USE INDUSTRY, 2018–2021 (KILOTON)
- TABLE 242 SAUDI ARABIA: CARBON FIBER PREPREG MARKET SIZE, BY END-USE INDUSTRY, 2018–2021 (USD MILLION)
- TABLE 243 SAUDI ARABIA: CARBON FIBER PREPREG MARKET SIZE, BY END-USE INDUSTRY, 2022–2027 (KILOTON)
- TABLE 244 SAUDI ARABIA: CARBON FIBER PREPREG MARKET SIZE, BY END-USE INDUSTRY, 2022–2027 (USD MILLION)
- TABLE 245 UAE: CARBON FIBER PREPREG MARKET SIZE, BY END-USE INDUSTRY, 2018–2021 (KILOTON)
- TABLE 246 UAE: CARBON FIBER PREPREG MARKET SIZE, BY END-USE INDUSTRY, 2018–2021 (USD MILLION)
- TABLE 247 UAE: CARBON FIBER PREPREG MARKET SIZE, BY END-USE INDUSTRY, 2022–2027 (KILOTON)
- TABLE 248 UAE: CARBON FIBER PREPREG MARKET SIZE, BY END-USE INDUSTRY, 2022–2027 (USD MILLION)
- TABLE 249 REST OF MIDDLE EAST & AFRICA: CARBON FIBER PREPREG MARKET SIZE, BY END-USE INDUSTRY, 2018–2021 (KILOTON)
- TABLE 250 REST OF MIDDLE EAST & AFRICA: CARBON FIBER PREPREG MARKET SIZE, BY END-USE INDUSTRY, 2018–2021 (USD MILLION)
- TABLE 251 REST OF MIDDLE EAST & AFRICA: CARBON FIBER PREPREG MARKET SIZE, BY END-USE INDUSTRY, 2022–2027 (KILOTON)
- TABLE 252 REST OF MIDDLE EAST & AFRICA: CARBON FIBER PREPREG MARKET SIZE, BY END-USE INDUSTRY, 2022–2027 (USD MILLION)
- TABLE 253 DEGREE OF COMPETITION: CARBON FIBER PREPREG MARKET
- TABLE 254 COMPANY PRODUCT FOOTPRINT
- TABLE 255 COMPANY END-USE INDUSTRY FOOTPRINT
- TABLE 256 COMPANY REGION FOOTPRINT
- TABLE 257 CARBON FIBER PREPREG MARKET: NEW PRODUCT LAUNCH/ DEVELOPMENT, 2015-2022
- TABLE 258 CARBON FIBER PREPREG MARKET: DEALS, 2015–2022
- TABLE 259 CARBON FIBER PREPREG MARKET: OTHER DEVELOPMENTS, 2015–2022
- TABLE 260 CARBON FIBER PREPREG MARKET: KEY START-UPS/SMES
- TABLE 261 CARBON FIBER PREPREG MARKET: COMPETITIVE BENCHMARKING OF KEY START-UPS/SMES
- TABLE 262 MITSUBISHI CHEMICAL CARBON FIBER AND COMPOSITES, INC.: COMPANY OVERVIEW
- TABLE 263 SOLVAY: COMPANY OVERVIEW
- TABLE 264 TEIJIN LIMITED: COMPANY OVERVIEW
- TABLE 265 TORAY: COMPANY OVERVIEW
- TABLE 266 HEXCEL CORPORATION: COMPANY OVERVIEW
- TABLE 267 GURIT HOLDING AG: COMPANY OVERVIEW
- TABLE 268 ROCK WEST COMPOSITES, INC.: COMPANY OVERVIEW
- TABLE 269 SGL CARBON: COMPANY OVERVIEW
- TABLE 270 PARK AEROSPACE CORP.: COMPANY OVERVIEW
- TABLE 271 AXIOM MATERIALS, INC.: COMPANY OVERVIEW
- TABLE 272 WEIHAI GUANGWEI COMPOSITES MATERIALS CO., LTD.: COMPANY OVERVIEW
- TABLE 273 MALLINDA, INC.: COMPANY OVERVIEW
- TABLE 274 SICHUAN XINWANXING CARBON FIBER COMPOSITES CO., LTD.: COMPANY OVERVIEW
- TABLE 275 DEXCRAFT: COMPANY OVERVIEW
- TABLE 276 3A ASSOCIATES INCORPORATED: COMPANY OVERVIEW
- TABLE 277 ROCKMAN ADVANCED COMPOSITES: COMPANY OVERVIEW
- TABLE 278 KINECO LIMITED: COMPANY OVERVIEW
- TABLE 279 TAIWAN FIRST LI-BOND CO., LTD.: COMPANY OVERVIEW
- TABLE 280 NORTH THIN PLY TECHNOLOGY: COMPANY OVERVIEW
- TABLE 281 TCR COMPOSITES: COMPANY OVERVIEW
- TABLE 282 PLASTIC REINFORCEMENT FABRICS LTD.: COMPANY OVERVIEW
- TABLE 283 BARRDAY INC.: COMPANY OVERVIEW
- TABLE 284 GMS COMPOSITES: COMPANY OVERVIEW
- TABLE 285 HANKUK CARBON: COMPANY OVERVIEW
- TABLE 286 ABC COMPOSITES: COMPANY OVERVIEW
- FIGURE 1 CARBON FIBER PREPREG MARKET SEGMENTATION
- FIGURE 2 CARBON FIBER PREPREG MARKET: RESEARCH DESIGN
- FIGURE 3 MARKET SIZE ESTIMATION METHODOLOGY: BOTTOM-UP APPROACH
- FIGURE 4 MARKET SIZE ESTIMATION: TOP-DOWN APPROACH
- FIGURE 5 CARBON FIBER PREPREG MARKET: DATA TRIANGULATION
- FIGURE 6 HOT MELT SEGMENT DOMINATED OVERALL CARBON FIBER PREPREG MARKET IN 2021
- FIGURE 7 EPOXY RESIN SEGMENT ACCOUNTED FOR LARGEST MARKET SHARE IN 2021
- FIGURE 8 AEROSPACE & DEFENSE ACCOUNTED FOR LARGEST SHARE OF CARBON FIBER PREPREG MARKET IN 2021
- FIGURE 9 EUROPE LED CARBON FIBER PREPREG MARKET IN 2021
- FIGURE 10 SIGNIFICANT GROWTH EXPECTED IN CARBON FIBER PREPREG MARKET BETWEEN 2022 AND 2027
- FIGURE 11 EUROPE WAS LARGEST MARKET IN 2021
- FIGURE 12 HOT MELT CARBON FIBER PREPREG SEGMENT DOMINATED MARKET IN 2021
- FIGURE 13 AEROSPACE & DEFENSE SEGMENT DOMINATED MARKET IN 2021
- FIGURE 14 GERMANY TO BE FASTEST-GROWING CARBON FIBER PREPREG MARKET, (2022–2027)
- FIGURE 15 DRIVERS, RESTRAINTS, OPPORTUNITIES, AND CHALLENGES IN CARBON FIBER PREPREG MARKET
- FIGURE 16 CARBON FIBER PREPREG MARKET: PORTER’S FIVE FORCES ANALYSIS
- FIGURE 17 INFLUENCE OF STAKEHOLDERS ON BUYING PROCESS FOR TOP 3 END-USE INDUSTRIES
- FIGURE 18 KEY BUYING CRITERIA FOR TOP 3 END-USE INDUSTRIES
- FIGURE 19 VALUE CHAIN ANALYSIS: CARBON FIBER PREPREG MARKET
- FIGURE 20 AVERAGE SELLING PRICES OF KEY PLAYERS FOR MANUFACTURING PROCESS (USD/KG)
- FIGURE 21 AVERAGE SELLING PRICES OF DIFFERENT RESIN TYPES (USD/KG)
- FIGURE 22 AVERAGE SELLING PRICES BASED ON END-USE INDUSTRY (USD/KG)
- FIGURE 23 TRENDS AND DISRUPTIONS IMPACTING CUSTOMERS' BUSINESSES
- FIGURE 24 HOT MELT MANUFACTURING PROCESS TO DOMINATE OVERALL CARBON FIBER PREPREG MARKET
- FIGURE 25 EUROPE TO BE LARGEST MARKET FOR HOT MELT PROCESS SEGMENT
- FIGURE 26 EPOXY RESIN SEGMENT TO DOMINATE OVERALL CARBON FIBER PREPREG MARKET
- FIGURE 27 EUROPE TO DRIVE EPOXY RESIN-BASED CARBON FIBER PREPREG MARKET
- FIGURE 28 EUROPE TO DRIVE PHENOLIC RESIN-BASED CARBON FIBER PREPREG MARKET
- FIGURE 29 AEROSPACE & DEFENSE TO BE LARGEST END USER OF CARBON FIBER PREPREG
- FIGURE 30 NORTH AMERICA DOMINATED CARBON FIBER PREPREG MARKET IN AEROSPACE & DEFENSE SEGMENT
- FIGURE 31 EUROPE ACCOUNTS FOR MAJOR SHARE OF CARBON FIBER PREPREG MARKET IN WIND ENERGY
- FIGURE 32 EUROPE TO DRIVE CARBON FIBER PREPREG MARKET (2022–2027)
- FIGURE 33 NORTH AMERICA: CARBON FIBER PREPREG MARKET SNAPSHOT
- FIGURE 34 CARBON FIBER PREPREG MARKET SNAPSHOT: GERMANY IS LARGEST MARKET IN EUROPE
- FIGURE 35 CARBON FIBER PREPREG MARKET SNAPSHOT: JAPAN TO BE FASTEST-GROWING MARKET IN ASIA PACIFIC
- FIGURE 36 SHARES OF TOP COMPANIES IN CARBON FIBER PREPREG MARKET
- FIGURE 37 RANKING OF TOP FIVE PLAYERS IN CARBON FIBER PREPREG MARKET
- FIGURE 38 REVENUE ANALYSIS OF TOP CARBON FIBER PREPREG MANUFACTURERS
- FIGURE 39 CARBON FIBER PREPREG MARKET (GLOBAL): COMPETITIVE LEADERSHIP MAPPING, 2021
- FIGURE 40 PRODUCT PORTFOLIO ANALYSIS OF TOP PLAYERS
- FIGURE 41 BUSINESS STRATEGY EXCELLENCE OF TOP PLAYERS
- FIGURE 42 CARBON FIBER PREPREG MARKET: SMALL AND MEDIUM-SIZED ENTERPRISES MAPPING, 2021
- FIGURE 43 MITSUBISHI CHEMICAL CARBON FIBER AND COMPOSITES, INC.: COMPANY SNAPSHOT
- FIGURE 44 SOLVAY: COMPANY SNAPSHOT
- FIGURE 45 TEIJIN LIMITED: COMPANY SNAPSHOT
- FIGURE 46 TORAY INDUSTRIES INC.: COMPANY SNAPSHOT
- FIGURE 47 HEXCEL CORPORATION: COMPANY SNAPSHOT
- FIGURE 48 GURIT HOLDING AG: COMPANY SNAPSHOT
- FIGURE 49 SGL CARBON: COMPANY SNAPSHOT
- FIGURE 50 PARK AEROSPACE CORP.: COMPANY SNAPSHOT
The study involved four major activities to estimate the current market size for carbon fiber prepreg market. Exhaustive secondary research was done to collect information on the market, the peer market, and parent market. The next step was to validate these findings, assumptions, and sizing with industry experts across value chain through primary research. Both top-down and bottom-up approaches were employed to estimate the complete market size. Thereafter, market breakdown and data triangulation procedures were used to estimate the size of market segments and subsegments.
Carbon Fiber Prepreg Market Secondary Research
In the secondary research process, various secondary sources such as Hoovers, Bloomberg BusinessWeek, and Factiva were referred to, so as to identify and collect information for this study. These secondary sources included annual reports, press releases & investor presentations of companies, white papers, certified publications, articles by recognized authors, gold standard & silver standard websites, regulatory bodies, trade directories, and databases.
Carbon Fiber Prepreg Market Primary Research
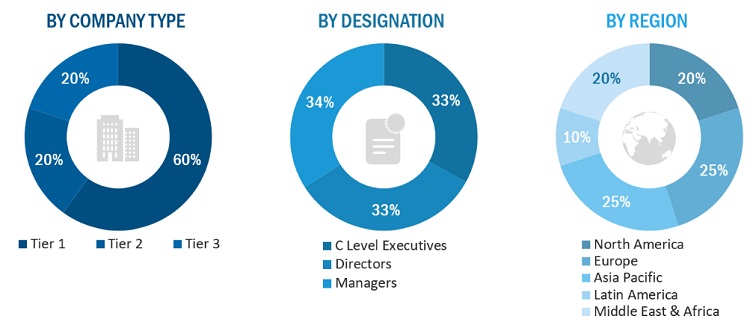
The carbon fiber prepreg market comprises several stakeholders such as raw material suppliers, processors, end-product manufacturers, and regulatory organizations in the supply chain. The demand side of this market is characterized by the development of various industries such as aerospace & defense, wind energy, sports & recreation, automotive, and other industries. The supply side is characterized by advancements in technology and diverse applications. Various primary sources from both the supply and demand sides of the market were interviewed to obtain qualitative and quantitative information.
To know about the assumptions considered for the study, download the pdf brochure
Carbon Fiber Prepreg Market Size Estimation
Both top-down and bottom-up approaches were used to estimate and validate the total carbon fiber prepreg market. These methods were also used extensively to estimate the size of various subsegments in the market. The research methodology used to estimate the market size included the following:
- The key players in the industry and markets were identified through extensive secondary research.
- The industry’s supply chain and market size, in terms of value, were determined through primary and secondary research processes.
- All percentage shares, splits, and breakdowns were determined using secondary sources and verified through primary sources.
Carbon Fiber Prepreg Market Data Triangulation
After arriving at the overall market size using the market size estimation processes as explained above, the market was split into several segments and subsegments. In order to complete the overall market engineering process and arrive at the exact statistics of each market segment and subsegment, the data triangulation and market breakdown procedures were employed, wherever applicable. The data was triangulated by studying various factors and trends from both demand and supply sides in the aerospace & defense, wind energy, sports & recreation, automotive, and other industries.
Carbon Fiber Prepreg Market Report Objectives
- To define, describe, and forecast the market size of carbon fiber prepreg market, in terms of value and volume
- To provide detailed information about the key factors (drivers, restraints, opportunities, and challenges) influencing the growth of the market
- To analyze and forecast the market on the basis of resin type, manufacturing process, and end-use industry
- To define, describe, and forecast the market on the basis of five regions, namely, North America, Europe, Asia Pacific (APAC), the Middle East & Africa (MEA), and Latin America
- To strategically analyze micromarkets with respect to individual growth trends, prospects, and their contribution to the overall market
- To analyze the opportunities in the market for stakeholders and provide a competitive landscape for market leaders
- To strategically profile the key players and comprehensively analyze their market share and core competencies
Carbon Fiber Prepreg Market Report Available Customizations
With the given market data, MarketsandMarkets offers customizations according to the company’s specific needs.
The following customization options are available for the report:
Product Analysis
- Product matrix, which gives a detailed comparison of the product portfolio of each company
Carbon Fiber Prepreg Market Report Regional Analysis
- Further breakdown of Rest of Europe carbon fiber prepreg market
- Further breakdown of Rest of APAC carbon fiber prepreg market
- Further breakdown of Rest of Latin America carbon fiber prepreg market
- Further breakdown of Rest of MEA carbon fiber prepreg market
Company Information
- Detailed analysis and profiling of additional market players (up to ten)

 Generating Response ...


Growth opportunities and latent adjacency in Carbon Fiber Prepreg Market