Brain Computer Interface Market: Growth, Size, Share, and Trends

Report Code HIT 9020
Published in May, 2024, By MarketsandMarkets™
Download PDF

Choose License Type

Buy Report Now Inquire Before Buying

Brain Computer Interface Market by Product (Non-invasive, Invasive, Partial invasive), Technology (EEG, MEG, ECoG, fMRI), Application (Disability/Rehabilitation, Assistive technologies, Mental health, Research), End User - Global Forecast to 2029

Overview

The global brain computer interface market, valued at US$235 million in 2023, is forecasted to grow at a robust CAGR of 14.1%, reaching US$262 million in 2024 and an impressive US$506 million by 2029. The growth in this market is fuelled by the growing incidence & prevalence of neurological disorders, and rising Investments in research and development. Furthermore, the increasing demand for non-invasive and wearable brain computer interface devices is expected to increase the adoption of brain computer interface solutions in future.

Attractive Opportunities in the Brain Computer Interface Market

ASIA PACIFIC:

Market growth in the Asia Pacific region can be attributed to the rising disposable incomes, increasing incidence of neurodegenerative disorders, and a growing governmental focus on healthcare reforms.

Growth in the brain computer interface market is mainly driven by the growing incidence & prevalence of neurological disorders, increasing demand for non-invasive and wearable BCI devices, rising investments in research and development

Partnerships, product launches & approvals, and expansions are expected to offer lucrative opportunities for market players in the coming years.

Market growth in North America can be attributed to the growing incidence of neurological conditions, rapidly growing geriatric population, and rising government initiatives

The growth opportunities in emerging markets, and growing applications of BCI technology offer several opportunities for market growth.

Global Brain Computer Interface Market Dynamics

DRIVER: Growing need to minimize medication errors

The prevalence of various neurological disorders, encompassing stroke, Alzheimer's disease, Parkinson's disease, and amyotrophic lateral sclerosis (ALS). These conditions affect millions of people globally, limiting mobility, communication, and independence. This escalation is primarily linked to the expanding elderly population, with projections indicating that over 20% of the global populace will be above 65 by 2050. Forecasts from the American Medical Association (AMA) suggest that by 2030, approximately 60% of individuals in this age bracket will contend with multiple chronic conditions.The growing incidence of these neurological disorders underscores the critical need for brain computer interface solutions. BCIs offer a novel approach to address these unmet needs. They can help individuals with neurological disorders regain control of prosthetic limbs, operate assistive technologies, and even communicate through brain signals. As brain computer interface technology advances and clinical applications become more widespread, the market is poised for continued growth in the years to come.

RESTRAINT: High cost of brain computer interface systems

The high initial investment required for acquiring and implementing brain computer interface technology poses a significant barrier to entry for many potential users. This cost factor not only affects individual consumers but also dissuades healthcare facilities, research institutions, and other organizations from adopting brain computer interface solutions on a larger scale. The high cost of brain computer interface systems limits accessibility to brain computer interface technology, particularly for individuals and organizations with budget constraints or limited financial resources.Moreover, the total cost of ownership for brain computer interface systems extends beyond the initial purchase price and includes expenses related to installation, training, maintenance, and ongoing support. These additional costs further compound the financial burden associated with adopting brain computer interface solutions. As a result, many potential users may hesitate to invest in brain computer interface technology, leading to slower market growth and adoption rates than anticipated.

OPPORTUNITY: Growth opportunities in emerging markets

The burgeoning economies of emerging markets present lucrative prospects for players within the brain computer interface sector, primarily fuelled by the significant rise in demand for advanced healthcare solutions, including brain computer interface systems, to address the growing burden of neurological disorders and disabilities. Notably, nations like Brazil, Russia, India, China, and South Africa have emerged as some of the world's fastest-growing economies, poised to collectively contribute to a third of the global healthcare expenditure by 2022, as per the World Economic Forum.Emerging markets present an opportunity to develop low-cost and scalable brain computer interface solutions tailored to the specific needs and budgetary constraints of these regions. Moreover, the regulatory landscape in developing nations tends to be less stringent, with lower data requirements. Particularly in the Asia-Pacific region, regulatory policies are perceived as more adaptable and conducive to business, garnering favor among market players. Consequently, the market players are increasingly focusing on expanding their presence and operations in these regions to capitalize on the burgeoning opportunities.

CHALLENGE: Shortage of trained medical professionals

Trained medical personnel are required to operate brain computer interface systems effectively for rehabilitation. The positioning of electrodes on the scalp and the insertion of muscular needles require accuracy and must be performed only by highly-trained personnel. The presence of highly skilled medical personnel and staff is, therefore, vital for the effective use of brain computer interface systems.Skilled medical personnel are currently in short supply worldwide, with the WHO estimating a shortage of 4.3 million physicians, nurses, and other health professionals. In the US, the Association of American Medical Colleges (AAMC) predicts a shortfall of up to 124,000 physicians by 2034 due to factors like population growth and aging. The Canadian Nurses Association predicted that Canada was expected to lack around 60,000 nurses by 2022. Additionally, there's a global shortage of neurodiagnostic technologists, prompting hospitals to train other allied health professionals. This poses a significant obstacle to the expansion of the global brain-computer interface market.

Global Brain Computer Interface Market Ecosystem Analysis

The Brain computer interface market ecosystem comprises entities responsible for delivering these solutions to end users. The ecosystem comprises of manufacturers of brain computer interface solutions, research institutions, investors & venture capital firms, healthcare providers, healthcare professionals, patient and caregivers, and governments and regulatory bodies.

Hardware is the largest component of the brain computer interface industry in 2023, by component.

Based on component, the brain computer interface market is segmented into hardware and software. In 2023, the hardware segment accounted for the largest share in the market. The largest share of the segment can be attributed due to hardware forming the foundational backbone of brain computer interface functionality, and rising investment in hardware development by companies and research institutions.The non-invasive brain computer interface segment accounted for the largest share of the brain computer interface industry, by product type.Based on product type, the brain computer interface market is segmented into non-invasive brain computer interface, partially invasive brain computer interface, and invasive brain computer interface. The non-invasive brain computer interface segment accounted for the largest share of the brain computer interface market in 2023, attributed to the rising prevalence of neurological diseases, and lower risks of complications, infections, and side effects compared to invasive procedures.

The electroencephalography (EEG) segment accounted for the largest share in the brain computer interface industry , by technology.

Based on technology, the brain computer interface market is segmented into hospitals & clinics, ambulatory surgery centers, pharmacies, rehabilitation centers, and other end users. The Electroencephalography (EEG) segment accounted for the largest share of the brain computer interface market, attributing to the large number of players involved in developing EEG hardware and growing R&D in the field of cerebral and spinal disorders.Disabilities restoration/ rehabilitation segment accounted for the largest share of the brain computer interface industry, by applicationBased on application, the brain computer interface market is segmented into disabilities restoration/ rehabilitation, assistive technologies, and other applications. In 2023, disabilities restoration/ rehabilitation segment accounted for the largest share in the market. One of the primary drivers contributing significantly to the substantial market share of this segment is the increasing prevalence of neurological conditions like stroke, spinal cord injury, and amyotrophic lateral sclerosis (ALS). Moreover, the growing healthcare spending and rising research and development initiatives are also responsible for the growth of this market.Hospitals & clinics segment accounted for the largest share in the market, by end user.Based on end user, the brain computer interface market is segmented into hospitals & clinics, rehabilitation centers, homecare settings, and other end users. In 2023, the hospitals & clinics segment accounted for the largest share in the market. The higher patient volumes in hospitals than smaller clinics and other end users amplify the demand for brain computer interface solutions for this end user segment.

NORTH AMERICA region holds the largest share of the Brain Computer Interface Market.

The brain computer interface market is segmented into five major regional segments, namely, North America, Europe, Asia Pacific, Latin America, and Middle East and Africa. In 2023, Asia Pacific was the fastest growing segment in Brain computer interface market attributed to the growing incidence of neurological conditions, rapidly growing geriatric population, and rising government initiatives.


Recent Developments of Brain Computer Interface Market industry


Key Market Players

KEY PLAYERS IN THE Brain Computer Interface Market INCLUDE

Want to explore hidden markets that can drive new revenue in Brain Computer Interface Market?

Scope of the Report

Report Attribute Details
Market Revenue in 2024 $262 million
Projected Revenue by 2029 $506 million
Revenue Rate Poised to Grow at a CAGR of 14.1%
Market Driver Growing need to minimize medication errors
Market Opportunity Growth opportunities in emerging markets


Key Questions Addressed by the Report

What is the projected growth rate of the global brain computer interface market between 2024 and 2029?
The global brain computer interface market is projected to grow from USD 262 million in 2024 to USD 506 million by 2029, demonstrating a robust CAGR of 14.1%.
What are the key factors driving the brain computer interface market?
Key factors driving the brain computer interface market include the rising prevalence of neurological disorders like Alzheimer's, Parkinson's, and ALS, along with growing investments in research and development and increasing demand for non-invasive and wearable BCI devices.
What are the main challenges facing the brain computer interface market?
The brain computer interface market faces challenges such as the high cost of BCI systems, limited accessibility, and a shortage of trained professionals capable of handling advanced BCI technologies.
Which regions are expected to show growth in the brain computer interface market?
North America is expected to dominate the brain computer interface market due to high investment in clinical trials and neurological research. Emerging markets like China, India, and Brazil are also projected to experience significant growth, driven by increasing healthcare investments.
What are the key products in the brain computer interface market?
Key products in the brain computer interface market include hardware such as EEG headsets, neural implants, and sensors, as well as software platforms that facilitate the processing of brain signals for various applications, including assistive technologies and rehabilitation devices.
How does the prevalence of neurological disorders impact the brain computer interface market?
The rising prevalence of neurological disorders, including Alzheimer's, Parkinson's, and stroke, is significantly driving the demand for brain computer interface technologies, particularly for rehabilitation and assistive solutions that improve quality of life for affected individuals.
What are the recent technological advancements in the brain computer interface market?
Recent advancements in brain computer interface technology include improvements in non-invasive BCI devices, enhanced accuracy in neural signal processing, and the integration of AI and machine learning algorithms to better interpret brain signals for applications in healthcare, gaming, and smart home control.
How does the high cost of BCI systems affect the market?
The high cost of brain computer interface systems, including expenses for installation, maintenance, and training, limits their adoption, particularly in emerging markets and among healthcare facilities with budget constraints, slowing the market's growth.
What role do non-invasive BCIs play in the brain computer interface market?
Non-invasive brain computer interface devices dominate the market due to their safer application in medical and non-medical fields. They reduce risks associated with invasive procedures and are widely used in neurological rehabilitation and assistive technologies.
How do emerging markets provide opportunities for the brain computer interface market?
Emerging markets like Brazil, India, and China present significant opportunities for the brain computer interface market due to rising healthcare expenditures, a growing elderly population, and a demand for innovative medical technologies to address neurological disorders and disabilities.


Personalize This Research

  • Triangulate with your Own Data
  • Get Data as per your Format and Definition
  • Gain a Deeper Dive on a Specific Application, Geography, Customer or Competitor
  • Any level of Personalization
Request A Free Customisation

Let Us Help You

  • What are the Known and Unknown Adjacencies Impacting the Brain Computer Interface Market
  • What will your New Revenue Sources be?
  • Who will be your Top Customer; what will make them switch?
  • Defend your Market Share or Win Competitors
  • Get a Scorecard for Target Partners
Customized Workshop Request

Table of Contents

Exclusive indicates content/data unique to MarketsandMarkets and not available with any competitors.

TITLE
PAGE NO
INTRODUCTION
25
RESEARCH METHODOLOGY
29
EXECUTIVE SUMMARY
40
PREMIUM INSIGHTS
45
MARKET OVERVIEW
49
  • 5.1 INTRODUCTION
  • 5.2 MARKET DYNAMICS
    DRIVERS
    - Growing incidence & prevalence of neurological disorders
    - Increasing demand for non-invasive & wearable BCI devices
    - Rising investment in R&D
    RESTRAINTS
    - High cost of BCI systems
    OPPORTUNITIES
    - Growth opportunities in emerging economies
    - Growing applications of BCI technology
    CHALLENGES
    - Shortage of trained medical professionals
    - Data security & privacy concerns
  • 5.3 INDUSTRY TRENDS
    FOCUS ON NON-INVASIVE BCIS
    INTEGRATION WITH WEARABLE TECHNOLOGY
  • 5.4 PRICING ANALYSIS
    AVERAGE SELLING PRICE TREND, BY HARDWARE
    AVERAGE SELLING PRICE TREND OF BRAIN-COMPUTER INTERFACE, BY PRODUCT TYPE
  • 5.5 VALUE CHAIN ANALYSIS
  • 5.6 ECOSYSTEM ANALYSIS
  • 5.7 PORTER’S FIVE FORCES ANALYSIS
    BARGAINING POWER OF BUYERS
    BARGAINING POWER OF SUPPLIERS
    THREAT OF NEW ENTRANTS
    THREAT OF SUBSTITUTES
    INTENSITY OF COMPETITIVE RIVALRY
  • 5.8 KEY STAKEHOLDERS & BUYING CRITERIA
    KEY STAKEHOLDERS IN BUYING PROCESS
    BUYING CRITERIA
  • 5.9 REGULATORY LANDSCAPE
    REGULATORY BODIES, GOVERNMENT AGENCIES, AND OTHER ORGANIZATIONS
    REGULATORY ANALYSIS
    - North America
    - Europe
    - Asia Pacific
    - Latin America
    - Middle East & Africa
  • 5.10 TECHNOLOGY ANALYSIS
    KEY TECHNOLOGIES
    - Artificial Intelligence (AI) and Machine Learning (ML)
    - Signal Processing
    COMPLEMENTARY TECHNOLOGIES
    - Neuroimaging
    - Wearable Technology
    ADJACENT TECHNOLOGIES
    - Robotics & Prosthetics
    - Virtual Reality (VR) & Augmented Reality (AR)
  • 5.11 PATENT ANALYSIS
    PATENT PUBLICATION TRENDS
    JURISDICTION ANALYSIS: TOP APPLICANT COUNTRIES FOR BRAIN-COMPUTER INTERFACE
    PATENT APPLICATIONS AND OWNERS
    LIST OF PATENTS/PATENT APPLICATIONS
  • 5.12 REIMBURSEMENT SCENARIO ANALYSIS
  • 5.13 BUSINESS MODEL ANALYSIS
  • 5.14 TRADE ANALYSIS
    TRADE ANALYSIS FOR BRAIN-COMPUTER INTERFACE MARKET
  • 5.15 CASE STUDY ANALYSIS
  • 5.16 KEY CONFERENCES & EVENTS, 2024–2025
  • 5.17 UNMET NEEDS AND END-USER EXPECTATIONS
    UNMET NEEDS
    END-USER EXPECTATIONS
  • 5.18 TRENDS/DISRUPTIONS IMPACTING CUSTOMERS’ BUSINESSES
  • 5.19 INVESTMENT AND FUNDING LANDSCAPE
BRAIN-COMPUTER INTERFACE MARKET, BY COMPONENT
81
  • 6.1 INTRODUCTION
  • 6.2 HARDWARE
    ADVANCEMENTS IN HARDWARE AND INCREASING DEMAND FOR NON-INVASIVE BCI SOLUTIONS TO DRIVE MARKET GROWTH
  • 6.3 SOFTWARE
    INCREASING ADOPTION OF TECHNOLOGICALLY ADVANCED BCI SOFTWARE SOLUTIONS TO FUEL MARKET GROWTH
BRAIN-COMPUTER INTERFACE MARKET, BY PRODUCT TYPE
85
  • 7.1 INTRODUCTION
  • 7.2 NON-INVASIVE BRAIN-COMPUTER INTERFACES
    DEVELOPMENT OF ADVANCED EEG HEADSETS TO DRIVE ADOPTION
  • 7.3 PARTIALLY INVASIVE BRAIN-COMPUTER INTERFACES
    TECHNOLOGICAL ADVANCEMENTS AND RISING NEUROLOGICAL DISORDER INCIDENCE TO DRIVE DEMAND
  • 7.4 INVASIVE BRAIN-COMPUTER INTERFACES
    GROWING R&D AND RISING INVESTMENTS TO FUEL MARKET GROWTH
BRAIN-COMPUTER INTERFACE MARKET, BY TECHNOLOGY
91
  • 8.1 INTRODUCTION
  • 8.2 ELECTROENCEPHALOGRAPHY
    TECHNOLOGICAL ADVANCEMENTS TO BOOST MARKET GROWTH
  • 8.3 MAGNETOENCEPHALOGRAPHY
    HIGH COST OF MEG-BASED BCI SOLUTIONS TO LIMIT MARKET GROWTH
  • 8.4 ELECTROCORTICOGRAPHY
    FOCUS ON ESTABLISHING FEASIBILITY & EFFICACY OF ECOG-BASED BCIS TO DRIVE MARKET
  • 8.5 FUNCTIONAL MAGNETIC RESONANCE IMAGING
    LARGE SIZE AND HIGH PRICE OF FMRI SCANNERS TO LIMIT APPLICATIONS IN HOME CARE SETTINGS
  • 8.6 FUNCTIONAL NEAR-INFRARED SPECTROSCOPY
    PORTABILITY, SAFETY, AND REAL-TIME BRAIN ACTIVITY MONITORING TO FUEL DEMAND
  • 8.7 DIRECT DATA INTERFACE
    HIGH COST AND LIMITED REIMBURSEMENT OPTIONS TO RESTRAIN GROWTH
BRAIN-COMPUTER INTERFACE MARKET, BY APPLICATION
100
  • 9.1 INTRODUCTION
  • 9.2 ASSISTIVE TECHNOLOGIES
    DEVELOPMENT OF INNOVATIVE SOLUTIONS AND GROWING R&D TO BOOST ADOPTION OF BCI IN ASSISTIVE TECHNOLOGIES
  • 9.3 DISABILITIES & REHABILITATION
    RISING DEMAND FOR ADVANCED SOLUTIONS AND INCREASING PREVALENCE OF NEUROLOGICAL DISORDERS TO DRIVE MARKET
  • 9.4 OTHER APPLICATIONS
BRAIN-COMPUTER INTERFACE MARKET, BY END USER
106
  • 10.1 INTRODUCTION
  • 10.2 HOSPITALS & CLINICS
    EARLY ADOPTION, WIDE APPLICATIONS, AND GROWING R&D TO SUPPORT MARKET GROWTH
  • 10.3 REHABILITATION CENTERS
    SHORTAGE OF TRAINED PROFESSIONALS TO CHALLENGE MARKET GROWTH
  • 10.4 HOME CARE SETTINGS
    PREFERENCE FOR IN-HOME CARE AND GROWING AGING POPULATION TO DRIVE DEMAND
  • 10.5 OTHER END USERS
BRAIN-COMPUTER INTERFACE MARKET, BY REGION
114
  • 11.1 INTRODUCTION
  • 11.2 NORTH AMERICA
    NORTH AMERICA: RECESSION IMPACT
    US
    - US to dominate North American market
    CANADA
    - Growing adoption and government support to propel market growth
  • 11.3 EUROPE
    EUROPE: RECESSION IMPACT
    GERMANY
    - Government support and demand for neurorehabilitation solutions to fuel market growth
    UK
    - Rising prevalence of neurological disorders to drive market
    FRANCE
    - Rising geriatric population to increase demand for BCI solutions
    ITALY
    - Increasing initiatives to propel market growth
    SPAIN
    - Rising R&D and improving health spending to drive market
    REST OF EUROPE
  • 11.4 ASIA PACIFIC
    ASIA PACIFIC: RECESSION IMPACT
    JAPAN
    - Growing demand for assistive technologies to fuel market growth
    CHINA
    - Technological innovations to increase demand
    INDIA
    - Increasing government initiatives to boost demand for BCI
    REST OF ASIA PACIFIC
  • 11.5 LATIN AMERICA
    LATIN AMERICA: RECESSION IMPACT
    BRAZIL
    - High cost of BCI solutions to hamper market growth
    MEXICO
    - Initiatives for healthcare infrastructure development to support market growth
    REST OF LATIN AMERICA
  • 11.6 MIDDLE EAST & AFRICA
    MIDDLE EAST & AFRICA: RECESSION IMPACT
    GCC COUNTRIES
    - Healthcare infrastructural development to drive demand for BCI solutions
    REST OF MIDDLE EAST & AFRICA
COMPETITIVE LANDSCAPE
175
  • 12.1 OVERVIEW
  • 12.2 KEY PLAYER STRATEGIES/RIGHT TO WIN
    OVERVIEW OF STRATEGIES ADOPTED BY PLAYERS IN BRAIN-COMPUTER INTERFACE MARKET
  • 12.3 MARKET SHARE ANALYSIS
  • 12.4 COMPANY EVALUATION MATRIX: KEY PLAYERS, 2023
    STARS
    PERVASIVE PLAYERS
    EMERGING LEADERS
    PARTICIPANTS
    COMPANY FOOTPRINT: KEY PLAYERS, 2023
    - Company footprint
    - Component footprint
    - Product type footprint
    - Technology footprint
    - Application footprint
  • 12.5 COMPANY EVALUATION MATRIX: STARTUPS/SMES, 2023
    PROGRESSIVE COMPANIES
    DYNAMIC COMPANIES
    STARTING BLOCKS
    RESPONSIVE COMPANIES
    COMPETITIVE BENCHMARKING: STARTUPS/SMES, 2023
  • 12.6 VALUATION AND FINANCIAL METRICS
  • 12.7 BRAND/PRODUCT COMPARISON
  • 12.8 COMPETITIVE SCENARIO
    PRODUCT LAUNCHES & APPROVALS
    DEALS
    EXPANSIONS
COMPANY PROFILES
191
  • 13.1 KEY PLAYERS
    NEUROSKY
    - Business overview
    - Products offered
    - MnM view
    EMOTIV
    - Business overview
    - Products offered
    - MnM view
    ANT NEURO
    - Business overview
    - Products offered
    - Recent developments
    - MnM view
    G.TEC MEDICAL ENGINEERING GMBH
    - Business overview
    - Products offered
    - MnM view
    NEURABLE
    - Business overview
    - Products offered
    - Recent developments
    - MnM view
    ADVANCED BRAIN MONITORING, INC.
    - Business overview
    - Products offered
    BRAIN PRODUCTS GMBH
    - Business overview
    - Products offered
    CGX
    - Business overview
    - Products offered
    - Recent developments
    RIPPLE NEURO
    - Business overview
    - Products offered
    BITBRAIN TECHNOLOGIES
    - Business overview
    - Products offered
    OPEN BCI
    - Business overview
    - Products offered
    ARTINIS MEDICAL SYSTEMS
    - Business overview
    - Products offered
    PARADROMICS
    - Business overview
    - Products offered
    - Recent developments
    BRAINCO, INC.
    - Business overview
    - Products offered
    MINDMAZE
    - Business overview
    - Products offered
    - Recent developments
    COGNIXION
    - Business overview
    - Products offered
    - Recent developments
    BLACKROCK NEUROTECH
    - Business overview
    - Products offered
    - Recent developments
    CORTEC GMBH
    - Business overview
    - Products offered
    INTERAXON, INC.
    - Business overview
    - Products offered
    NEUROLUTIONS, INC.
    - Business overview
    - Products offered
    - Recent developments
  • 13.2 OTHER PLAYERS
    CONSCIOUS LABS
    - Business overview
    - Products offered
    KERNEL
    - Business overview
    - Products offered
    - Recent developments
    AAVAA INC.
    - Business overview
    - Products offered
    - Recent developments
    NEXSTEM
    - Business overview
    - Products offered
    BIRGERMIND
    - Business overview
    - Products offered
APPENDIX
234
  • 14.1 DISCUSSION GUIDE
  • 14.2 KNOWLEDGESTORE: MARKETSANDMARKETS’ SUBSCRIPTION PORTAL
  • 14.3 CUSTOMIZATION OPTIONS
  • 14.4 RELATED REPORTS
  • 14.5 AUTHOR DETAILS
LIST OF TABLES
 
  • TABLE 1 RISK ASSESSMENT: BRAIN-COMPUTER INTERFACE MARKET
  • TABLE 2 AVERAGE SELLING PRICE OF BRAIN-COMPUTER INTERFACE, BY HARDWARE
  • TABLE 3 AVERAGE SELLING PRICE OF BRAIN-COMPUTER INTERFACE, BY PRODUCT TYPE
  • TABLE 4 BRAIN-COMPUTER INTERFACE MARKET: PORTER’S FIVE FORCES
  • TABLE 5 LIST OF KEY STAKEHOLDERS AND THEIR ROLE
  • TABLE 6 INFLUENCE OF STAKEHOLDERS ON BUYING PROCESS, BY COMPONENT
  • TABLE 7 KEY BUYING CRITERIA FOR BRAIN-COMPUTER INTERFACE, BY COMPONENT
  • TABLE 8 NORTH AMERICA: REGULATORY BODIES, GOVERNMENT AGENCIES, AND OTHER ORGANIZATIONS
  • TABLE 9 EUROPE: REGULATORY BODIES, GOVERNMENT AGENCIES, AND OTHER ORGANIZATIONS
  • TABLE 10 ASIA PACIFIC: REGULATORY BODIES, GOVERNMENT AGENCIES, AND OTHER ORGANIZATIONS
  • TABLE 11 US FDA: CLASSIFICATION OF MEDICAL DEVICES
  • TABLE 12 US: MEDICAL DEVICE REGULATORY APPROVAL PROCESS
  • TABLE 13 CHINA: CLASSIFICATION OF MEDICAL DEVICES
  • TABLE 14 INDIA: CLASSIFICATION OF NON-NOTIFIED MEDICAL DEVICES
  • TABLE 15 NUMBER OF DOCUMENTS FOR BRAIN-COMPUTER INTERFACE PATENTS, 2013–2023
  • TABLE 16 LIST OF PATENTS/PATENT APPLICATIONS IN BRIAN COMPUTER INTERFACE MARKET, JANUARY 2021-MAY 2024
  • TABLE 17 CASE STUDY 1: EXPLORING USER-CENTERED DESIGN PERSPECTIVES IN BRAIN-COMPUTER INTERFACE RESEARCH
  • TABLE 18 CASE STUDY 2: ASSESSING THE INTEGRATION OF BRAIN-COMPUTER INTERFACE AND INTERNET OF THINGS FOR HEALTHCARE APPLICATIONS
  • TABLE 19 LIST OF KEY CONFERENCES & EVENTS IN BRAIN-COMPUTER INTERFACE MARKET, JANUARY 2024–DECEMBER 2025
  • TABLE 20 UNMET NEEDS IN BRAIN-COMPUTER INTERFACE MARKET
  • TABLE 21 END-USER EXPECTATIONS IN BRAIN-COMPUTER INTERFACE MARKET
  • TABLE 22 BRAIN-COMPUTER INTERFACE MARKET, BY COMPONENT, 2022–2029 (USD MILLION)
  • TABLE 23 BRAIN-COMPUTER INTERFACE HARDWARE MARKET, BY COUNTRY, 2022–2029 (USD MILLION)
  • TABLE 24 BRAIN-COMPUTER INTERFACE SOFTWARE MARKET, BY COUNTRY, 2022–2029 (USD MILLION)
  • TABLE 25 BRAIN-COMPUTER INTERFACE MARKET, BY PRODUCT TYPE, 2022–2029 (USD MILLION)
  • TABLE 26 NON-INVASIVE BRAIN-COMPUTER INTERFACE MARKET, BY COUNTRY, 2022–2029 (USD MILLION)
  • TABLE 27 PARTIALLY INVASIVE BRAIN-COMPUTER INTERFACE MARKET, BY COUNTRY, 2022–2029 (USD MILLION)
  • TABLE 28 INVASIVE BRAIN-COMPUTER INTERFACE MARKET, BY COUNTRY, 2022–2029 (USD MILLION)
  • TABLE 29 BRAIN-COMPUTER INTERFACE MARKET, BY TECHNOLOGY, 2022–2029 (USD MILLION)
  • TABLE 30 EEG-BASED BRAIN-COMPUTER INTERFACE MARKET, BY COUNTRY, 2022–2029 (USD MILLION)
  • TABLE 31 MEG-BASED BRAIN-COMPUTER INTERFACE MARKET, BY COUNTRY, 2022–2029 (USD MILLION)
  • TABLE 32 ECOG-BASED BRAIN-COMPUTER INTERFACE MARKET, BY COUNTRY, 2022–2029 (USD MILLION)
  • TABLE 33 FMRI-BASED BRAIN-COMPUTER INTERFACE MARKET, BY COUNTRY, 2022–2029 (USD MILLION)
  • TABLE 34 FNIRS-BASED BRAIN-COMPUTER INTERFACE MARKET, BY COUNTRY, 2022–2029 (USD MILLION)
  • TABLE 35 DDI-BASED BRAIN-COMPUTER INTERFACE MARKET, BY COUNTRY, 2022–2029 (USD MILLION)
  • TABLE 36 BRAIN-COMPUTER INTERFACE MARKET, BY APPLICATION, 2022–2029 (USD MILLION)
  • TABLE 37 BRAIN-COMPUTER INTERFACE MARKET FOR ASSISTIVE TECHNOLOGIES, BY COUNTRY, 2022–2029 (USD MILLION)
  • TABLE 38 BRAIN-COMPUTER INTERFACE MARKET FOR DISABILITIES & REHABILITATION, BY COUNTRY, 2022–2029 (USD MILLION)
  • TABLE 39 BRAIN-COMPUTER INTERFACE MARKET FOR OTHER APPLICATIONS, BY COUNTRY, 2022–2029 (USD MILLION)
  • TABLE 40 BRAIN-COMPUTER INTERFACE MARKET, BY END USER, 2022–2029 (USD MILLION)
  • TABLE 41 BRAIN-COMPUTER INTERFACE MARKET FOR HOSPITALS & CLINICS, BY COUNTRY, 2022–2029 (USD MILLION)
  • TABLE 42 BRAIN-COMPUTER INTERFACE MARKET FOR REHABILITATION CENTERS, BY COUNTRY, 2022–2029 (USD MILLION)
  • TABLE 43 BRAIN-COMPUTER INTERFACE MARKET FOR HOME CARE SETTINGS, BY COUNTRY, 2022–2029 (USD MILLION)
  • TABLE 44 BRAIN-COMPUTER INTERFACE MARKET FOR OTHER END USERS, BY COUNTRY, 2022–2029 (USD MILLION)
  • TABLE 45 BRAIN-COMPUTER INTERFACE MARKET, BY REGION, 2022–2029 (USD MILLION)
  • TABLE 46 NORTH AMERICA: BRAIN-COMPUTER INTERFACE MARKET, BY COUNTRY, 2022–2029 (USD MILLION)
  • TABLE 47 NORTH AMERICA: BRAIN-COMPUTER INTERFACE MARKET, BY COMPONENT, 2022–2029 (USD MILLION)
  • TABLE 48 NORTH AMERICA: BRAIN-COMPUTER INTERFACE MARKET, BY PRODUCT TYPE, 2022–2029 (USD MILLION)
  • TABLE 49 NORTH AMERICA: BRAIN-COMPUTER INTERFACE MARKET, BY TECHNOLOGY, 2022–2029 (USD MILLION)
  • TABLE 50 NORTH AMERICA: BRAIN-COMPUTER INTERFACE MARKET, BY APPLICATION, 2022–2029 (USD MILLION)
  • TABLE 51 NORTH AMERICA: BRAIN-COMPUTER INTERFACE MARKET, BY END USER, 2022–2029 (USD MILLION)
  • TABLE 52 US: BRAIN-COMPUTER INTERFACE MARKET, BY COMPONENT, 2022–2029 (USD MILLION)
  • TABLE 53 US: BRAIN-COMPUTER INTERFACE MARKET, BY PRODUCT TYPE, 2022–2029 (USD MILLION)
  • TABLE 54 US: BRAIN-COMPUTER INTERFACE MARKET, BY TECHNOLOGY, 2022–2029 (USD MILLION)
  • TABLE 55 US: BRAIN-COMPUTER INTERFACE MARKET, BY APPLICATION, 2022–2029 (USD MILLION)
  • TABLE 56 US: BRAIN-COMPUTER INTERFACE MARKET, BY END USER, 2022–2029 (USD MILLION)
  • TABLE 57 CANADA: BRAIN-COMPUTER INTERFACE MARKET, BY COMPONENT, 2022–2029 (USD MILLION)
  • TABLE 58 CANADA: BRAIN-COMPUTER INTERFACE MARKET, BY PRODUCT TYPE, 2022–2029 (USD MILLION)
  • TABLE 59 CANADA: BRAIN-COMPUTER INTERFACE MARKET, BY TECHNOLOGY, 2022–2029 (USD MILLION)
  • TABLE 60 CANADA: BRAIN-COMPUTER INTERFACE MARKET, BY APPLICATION, 2022–2029 (USD MILLION)
  • TABLE 61 CANADA: BRAIN-COMPUTER INTERFACE MARKET, BY END USER, 2022–2029 (USD MILLION)
  • TABLE 62 EUROPE: BRAIN-COMPUTER INTERFACE MARKET, BY COUNTRY, 2022–2029 (USD MILLION)
  • TABLE 63 EUROPE: BRAIN-COMPUTER INTERFACE MARKET, BY COMPONENT, 2022–2029 (USD MILLION)
  • TABLE 64 EUROPE: BRAIN-COMPUTER INTERFACE MARKET, BY PRODUCT TYPE, 2022–2029 (USD MILLION)
  • TABLE 65 EUROPE: BRAIN-COMPUTER INTERFACE MARKET, BY TECHNOLOGY, 2022–2029 (USD MILLION)
  • TABLE 66 EUROPE: BRAIN-COMPUTER INTERFACE MARKET, BY APPLICATION, 2022–2029 (USD MILLION)
  • TABLE 67 EUROPE: BRAIN-COMPUTER INTERFACE MARKET, BY END USER, 2022–2029 (USD MILLION)
  • TABLE 68 GERMANY: BRAIN-COMPUTER INTERFACE MARKET, BY COMPONENT, 2022–2029 (USD MILLION)
  • TABLE 69 GERMANY: BRAIN-COMPUTER INTERFACE MARKET, BY PRODUCT TYPE, 2022–2029 (USD MILLION)
  • TABLE 70 GERMANY: BRAIN-COMPUTER INTERFACE MARKET, BY TECHNOLOGY, 2022–2029 (USD MILLION)
  • TABLE 71 GERMANY: BRAIN-COMPUTER INTERFACE MARKET, BY APPLICATION, 2022–2029 (USD MILLION)
  • TABLE 72 GERMANY: BRAIN-COMPUTER INTERFACE MARKET, BY END USER, 2022–2029 (USD MILLION)
  • TABLE 73 UK: BRAIN-COMPUTER INTERFACE MARKET, BY COMPONENT, 2022–2029 (USD MILLION)
  • TABLE 74 UK: BRAIN-COMPUTER INTERFACE MARKET, BY PRODUCT TYPE, 2022–2029 (USD MILLION)
  • TABLE 75 UK: BRAIN-COMPUTER INTERFACE MARKET, BY TECHNOLOGY, 2022–2029 (USD MILLION)
  • TABLE 76 UK: BRAIN-COMPUTER INTERFACE MARKET, BY APPLICATION, 2022–2029 (USD MILLION)
  • TABLE 77 UK: BRAIN-COMPUTER INTERFACE MARKET, BY END USER, 2022–2029 (USD MILLION)
  • TABLE 78 FRANCE: BRAIN-COMPUTER INTERFACE MARKET, BY COMPONENT, 2022–2029 (USD MILLION)
  • TABLE 79 FRANCE: BRAIN-COMPUTER INTERFACE MARKET, BY PRODUCT TYPE, 2022–2029 (USD MILLION)
  • TABLE 80 FRANCE: BRAIN-COMPUTER INTERFACE MARKET, BY TECHNOLOGY, 2022–2029 (USD MILLION)
  • TABLE 81 FRANCE: BRAIN-COMPUTER INTERFACE MARKET, BY APPLICATION, 2022–2029 (USD MILLION)
  • TABLE 82 FRANCE: BRAIN-COMPUTER INTERFACE MARKET, BY END USER, 2022–2029 (USD MILLION)
  • TABLE 83 ITALY: BRAIN-COMPUTER INTERFACE MARKET, BY COMPONENT, 2022–2029 (USD MILLION)
  • TABLE 84 ITALY: BRAIN-COMPUTER INTERFACE MARKET, BY PRODUCT TYPE, 2022–2029 (USD MILLION)
  • TABLE 85 ITALY: BRAIN-COMPUTER INTERFACE MARKET, BY TECHNOLOGY, 2022–2029 (USD MILLION)
  • TABLE 86 ITALY: BRAIN-COMPUTER INTERFACE MARKET, BY APPLICATION, 2022–2029 (USD MILLION)
  • TABLE 87 ITALY: BRAIN-COMPUTER INTERFACE MARKET, BY END USER, 2022–2029 (USD MILLION)
  • TABLE 88 SPAIN: BRAIN-COMPUTER INTERFACE MARKET, BY COMPONENT, 2022–2029 (USD MILLION)
  • TABLE 89 SPAIN: BRAIN-COMPUTER INTERFACE MARKET, BY PRODUCT TYPE, 2022–2029 (USD MILLION)
  • TABLE 90 SPAIN: BRAIN-COMPUTER INTERFACE MARKET, BY TECHNOLOGY, 2022–2029 (USD MILLION)
  • TABLE 91 SPAIN: BRAIN-COMPUTER INTERFACE MARKET, BY APPLICATION, 2022–2029 (USD MILLION)
  • TABLE 92 SPAIN: BRAIN-COMPUTER INTERFACE MARKET, BY END USER, 2022–2029 (USD MILLION)
  • TABLE 93 REST OF EUROPE: BRAIN-COMPUTER INTERFACE MARKET, BY COMPONENT, 2022–2029 (USD MILLION)
  • TABLE 94 REST OF EUROPE: BRAIN-COMPUTER INTERFACE MARKET, BY PRODUCT TYPE, 2022–2029 (USD MILLION)
  • TABLE 95 REST OF EUROPE: BRAIN-COMPUTER INTERFACE MARKET, BY TECHNOLOGY, 2022–2029 (USD MILLION)
  • TABLE 96 REST OF EUROPE: BRAIN-COMPUTER INTERFACE MARKET, BY APPLICATION, 2022–2029 (USD MILLION)
  • TABLE 97 REST OF EUROPE: BRAIN-COMPUTER INTERFACE MARKET, BY END USER, 2022–2029 (USD MILLION)
  • TABLE 98 ASIA PACIFIC: BRAIN-COMPUTER INTERFACE MARKET, BY COUNTRY, 2022–2029 (USD MILLION)
  • TABLE 99 ASIA PACIFIC: BRAIN-COMPUTER INTERFACE MARKET, BY COMPONENT, 2022–2029 (USD MILLION)
  • TABLE 100 ASIA PACIFIC: BRAIN-COMPUTER INTERFACE MARKET, BY PRODUCT TYPE, 2022–2029 (USD MILLION)
  • TABLE 101 ASIA PACIFIC: BRAIN-COMPUTER INTERFACE MARKET, BY TECHNOLOGY, 2022–2029 (USD MILLION)
  • TABLE 102 ASIA PACIFIC: BRAIN-COMPUTER INTERFACE MARKET, BY APPLICATION, 2022–2029 (USD MILLION)
  • TABLE 103 ASIA PACIFIC: BRAIN-COMPUTER INTERFACE MARKET, BY END USER, 2022–2029 (USD MILLION)
  • TABLE 104 JAPAN: BRAIN-COMPUTER INTERFACE MARKET, BY COMPONENT, 2022–2029 (USD MILLION)
  • TABLE 105 JAPAN: BRAIN-COMPUTER INTERFACE MARKET, BY PRODUCT TYPE, 2022–2029 (USD MILLION)
  • TABLE 106 JAPAN: BRAIN-COMPUTER INTERFACE MARKET, BY TECHNOLOGY, 2022–2029 (USD MILLION)
  • TABLE 107 JAPAN: BRAIN-COMPUTER INTERFACE MARKET, BY APPLICATION, 2022–2029 (USD MILLION)
  • TABLE 108 JAPAN: BRAIN-COMPUTER INTERFACE MARKET, BY END USER, 2022–2029 (USD MILLION)
  • TABLE 109 CHINA: BRAIN-COMPUTER INTERFACE MARKET, BY COMPONENT, 2022–2029 (USD MILLION)
  • TABLE 110 CHINA: BRAIN-COMPUTER INTERFACE MARKET, BY PRODUCT TYPE, 2022–2029 (USD MILLION)
  • TABLE 111 CHINA: BRAIN-COMPUTER INTERFACE MARKET, BY TECHNOLOGY, 2022–2029 (USD MILLION)
  • TABLE 112 CHINA: BRAIN-COMPUTER INTERFACE MARKET, BY APPLICATION, 2022–2029 (USD MILLION)
  • TABLE 113 CHINA: BRAIN-COMPUTER INTERFACE MARKET, BY END USER, 2022–2029 (USD MILLION)
  • TABLE 114 INDIA: BRAIN-COMPUTER INTERFACE MARKET, BY COMPONENT, 2022–2029 (USD MILLION)
  • TABLE 115 INDIA: BRAIN-COMPUTER INTERFACE MARKET, BY PRODUCT TYPE, 2022–2029 (USD MILLION)
  • TABLE 116 INDIA: BRAIN-COMPUTER INTERFACE MARKET, BY TECHNOLOGY, 2022–2029 (USD MILLION)
  • TABLE 117 INDIA: BRAIN-COMPUTER INTERFACE MARKET, BY APPLICATION, 2022–2029 (USD MILLION)
  • TABLE 118 INDIA: BRAIN-COMPUTER INTERFACE MARKET, BY END USER, 2022–2029 (USD MILLION)
  • TABLE 119 REST OF ASIA PACIFIC: BRAIN-COMPUTER INTERFACE MARKET, BY COMPONENT, 2022–2029 (USD MILLION)
  • TABLE 120 REST OF ASIA PACIFIC: BRAIN-COMPUTER INTERFACE MARKET, BY PRODUCT TYPE, 2022–2029 (USD MILLION)
  • TABLE 121 REST OF ASIA PACIFIC: BRAIN-COMPUTER INTERFACE MARKET, BY TECHNOLOGY, 2022–2029 (USD MILLION)
  • TABLE 122 REST OF ASIA PACIFIC: BRAIN-COMPUTER INTERFACE MARKET, BY APPLICATION, 2022–2029 (USD MILLION)
  • TABLE 123 REST OF ASIA PACIFIC: BRAIN-COMPUTER INTERFACE MARKET, BY END USER, 2022–2029 (USD MILLION)
  • TABLE 124 LATIN AMERICA: BRAIN-COMPUTER INTERFACE MARKET, BY COUNTRY, 2022–2029 (USD MILLION)
  • TABLE 125 LATIN AMERICA: BRAIN-COMPUTER INTERFACE MARKET, BY COMPONENT, 2022–2029 (USD MILLION)
  • TABLE 126 LATIN AMERICA: BRAIN-COMPUTER INTERFACE MARKET, BY PRODUCT TYPE, 2022–2029 (USD MILLION)
  • TABLE 127 LATIN AMERICA: BRAIN-COMPUTER INTERFACE MARKET, BY TECHNOLOGY, 2022–2029 (USD MILLION)
  • TABLE 128 LATIN AMERICA: BRAIN-COMPUTER INTERFACE MARKET, BY APPLICATION, 2022–2029 (USD MILLION)
  • TABLE 129 LATIN AMERICA: BRAIN-COMPUTER INTERFACE MARKET, BY END USER, 2022–2029 (USD MILLION)
  • TABLE 130 BRAZIL: BRAIN-COMPUTER INTERFACE MARKET, BY COMPONENT, 2022–2029 (USD MILLION)
  • TABLE 131 BRAZIL: BRAIN-COMPUTER INTERFACE MARKET, BY PRODUCT TYPE, 2022–2029 (USD MILLION)
  • TABLE 132 BRAZIL: BRAIN-COMPUTER INTERFACE MARKET, BY TECHNOLOGY, 2022–2029 (USD MILLION)
  • TABLE 133 BRAZIL: BRAIN-COMPUTER INTERFACE MARKET, BY APPLICATION, 2022–2029 (USD MILLION)
  • TABLE 134 BRAZIL: BRAIN-COMPUTER INTERFACE MARKET, BY END USER, 2022–2029 (USD MILLION)
  • TABLE 135 MEXICO: BRAIN-COMPUTER INTERFACE MARKET, BY COMPONENT, 2022–2029 (USD MILLION)
  • TABLE 136 MEXICO: BRAIN-COMPUTER INTERFACE MARKET, BY PRODUCT TYPE, 2022–2029 (USD MILLION)
  • TABLE 137 MEXICO: BRAIN-COMPUTER INTERFACE MARKET, BY TECHNOLOGY, 2022–2029 (USD MILLION)
  • TABLE 138 MEXICO: BRAIN-COMPUTER INTERFACE MARKET, BY APPLICATION, 2022–2029 (USD MILLION)
  • TABLE 139 MEXICO: BRAIN-COMPUTER INTERFACE MARKET, BY END USER, 2022–2029 (USD MILLION)
  • TABLE 140 REST OF LATIN AMERICA: BRAIN-COMPUTER INTERFACE MARKET, BY COMPONENT, 2022–2029 (USD MILLION)
  • TABLE 141 REST OF LATIN AMERICA: BRAIN-COMPUTER INTERFACE MARKET, BY PRODUCT TYPE, 2022–2029 (USD MILLION)
  • TABLE 142 REST OF LATIN AMERICA: BRAIN-COMPUTER INTERFACE MARKET, BY TECHNOLOGY, 2022–2029 (USD MILLION)
  • TABLE 143 REST OF LATIN AMERICA: BRAIN-COMPUTER INTERFACE MARKET, BY APPLICATION, 2022–2029 (USD MILLION)
  • TABLE 144 REST OF LATIN AMERICA: BRAIN-COMPUTER INTERFACE MARKET, BY END USER, 2022–2029 (USD MILLION)
  • TABLE 145 MIDDLE EAST & AFRICA: BRAIN-COMPUTER INTERFACE MARKET, BY REGION, 2022–2029 (USD MILLION)
  • TABLE 146 MIDDLE EAST & AFRICA: BRAIN-COMPUTER INTERFACE MARKET, BY COMPONENT, 2022–2029 (USD MILLION)
  • TABLE 147 MIDDLE EAST & AFRICA: BRAIN-COMPUTER INTERFACE MARKET, BY PRODUCT TYPE, 2022–2029 (USD MILLION)
  • TABLE 148 MIDDLE EAST & AFRICA: BRAIN-COMPUTER INTERFACE MARKET, BY TECHNOLOGY, 2022–2029 (USD MILLION)
  • TABLE 149 MIDDLE EAST & AFRICA: BRAIN-COMPUTER INTERFACE MARKET, BY APPLICATION, 2022–2029 (USD MILLION)
  • TABLE 150 MIDDLE EAST & AFRICA: BRAIN-COMPUTER INTERFACE MARKET, BY END USER, 2022–2029 (USD MILLION)
  • TABLE 151 GCC COUNTRIES: BRAIN-COMPUTER INTERFACE MARKET, BY COMPONENT, 2022–2029 (USD MILLION)
  • TABLE 152 GCC COUNTRIES: BRAIN-COMPUTER INTERFACE MARKET, BY PRODUCT TYPE, 2022–2029 (USD MILLION)
  • TABLE 153 GCC COUNTRIES: BRAIN-COMPUTER INTERFACE MARKET, BY TECHNOLOGY, 2022–2029 (USD MILLION)
  • TABLE 154 GCC COUNTRIES: BRAIN-COMPUTER INTERFACE MARKET, BY APPLICATION, 2022–2029 (USD MILLION)
  • TABLE 155 GCC COUNTRIES: BRAIN-COMPUTER INTERFACE MARKET, BY END USER, 2022–2029 (USD MILLION)
  • TABLE 156 REST OF MIDDLE EAST & AFRICA: BRAIN-COMPUTER INTERFACE MARKET, BY COMPONENT, 2022–2029 (USD MILLION)
  • TABLE 157 REST OF MIDDLE EAST & AFRICA: BRAIN-COMPUTER INTERFACE MARKET, BY PRODUCT TYPE, 2022–2029 (USD MILLION)
  • TABLE 158 REST OF MIDDLE EAST & AFRICA: BRAIN-COMPUTER INTERFACE MARKET, BY TECHNOLOGY, 2022–2029 (USD MILLION)
  • TABLE 159 REST OF MIDDLE EAST & AFRICA: BRAIN-COMPUTER INTERFACE MARKET, BY APPLICATION, 2022–2029 (USD MILLION)
  • TABLE 160 REST OF MIDDLE EAST & AFRICA: BRAIN-COMPUTER INTERFACE MARKET, BY END USER, 2022–2029 (USD MILLION)
  • TABLE 161 BRAIN-COMPUTER INTERFACE MARKET: DEGREE OF COMPETITION
  • TABLE 162 BRAIN-COMPUTER INTERFACE MARKET: COMPONENT FOOTPRINT
  • TABLE 163 BRAIN-COMPUTER INTERFACE MARKET: PRODUCT TYPE FOOTPRINT
  • TABLE 164 BRAIN-COMPUTER INTERFACE MARKET: TECHNOLOGY FOOTPRINT
  • TABLE 165 BRAIN-COMPUTER INTERFACE MARKET: APPLICATION FOOTPRINT
  • TABLE 166 BRAIN-COMPUTER INTERFACE MARKET: DETAILED LIST OF KEY STARTUP/SME PLAYERS
  • TABLE 167 BRAIN-COMPUTER INTERFACE MARKET: COMPETITIVE BENCHMARKING OF KEY EMERGING PLAYERS/STARTUPS
  • TABLE 168 BRAIN-COMPUTER INTERFACE MARKET: PRODUCT LAUNCHES & APPROVALS, JANUARY 2021–MAY 2024
  • TABLE 169 BRAIN-COMPUTER INTERFACE MARKET: DEALS, JANUARY 2021–MAY 2024
  • TABLE 170 BRAIN-COMPUTER INTERFACE MARKET: EXPANSIONS, JANUARY 2021–MAY 2024
  • TABLE 171 NEUROSKY: COMPANY OVERVIEW
  • TABLE 172 NEUROSKY: PRODUCTS OFFERED
  • TABLE 173 EMOTIV: COMPANY OVERVIEW
  • TABLE 174 EMOTIV: PRODUCTS OFFERED
  • TABLE 175 ANT NEURO: COMPANY OVERVIEW
  • TABLE 176 ANT NEURO: PRODUCTS OFFERED
  • TABLE 177 ANT NEURO: PRODUCT LAUNCHES & APPROVALS (JANUARY 2021–MAY 2024)
  • TABLE 178 ANT NEURO: EXPANSIONS (JANUARY 2021–MAY 2024)
  • TABLE 179 G.TEC MEDICAL ENGINEERING GMBH: COMPANY OVERVIEW
  • TABLE 180 G.TEC MEDICAL ENGINEERING GMBH: PRODUCTS OFFERED
  • TABLE 181 NEURABLE: COMPANY OVERVIEW
  • TABLE 182 NEURABLE: PRODUCTS OFFERED
  • TABLE 183 NEURABLE: DEALS (JANUARY 2021–MAY 2024)
  • TABLE 184 ADVANCED BRAIN MONITORING, INC.: COMPANY OVERVIEW
  • TABLE 185 ADVANCED BRAIN MONITORING, INC.: PRODUCTS OFFERED
  • TABLE 186 BRAIN PRODUCTS GMBH: COMPANY OVERVIEW
  • TABLE 187 BRAIN PRODUCTS GMBH: PRODUCTS OFFERED
  • TABLE 188 CGX: COMPANY OVERVIEW
  • TABLE 189 CGX: PRODUCTS OFFERED
  • TABLE 190 CGX: EXPANSIONS (JANUARY 2021–MAY 2024)
  • TABLE 191 RIPPLE NEURO: COMPANY OVERVIEW
  • TABLE 192 RIPPLE NEURO: PRODUCTS OFFERED
  • TABLE 193 BITBRAIN TECHNOLOGIES: COMPANY OVERVIEW
  • TABLE 194 BITBRAIN TECHNOLOGIES: PRODUCTS OFFERED
  • TABLE 195 OPENBCI: COMPANY OVERVIEW
  • TABLE 196 OPENBCI: PRODUCTS OFFERED
  • TABLE 197 ARTINIS MEDICAL SYSTEMS: COMPANY OVERVIEW
  • TABLE 198 ARTINIS MEDICAL SYSTEMS: PRODUCTS OFFERED
  • TABLE 199 PARADROMICS: COMPANY OVERVIEW
  • TABLE 200 PARADROMICS: PRODUCTS OFFERED
  • TABLE 201 PARADROMICS: PRODUCT APPROVALS (JANUARY 2021–MAY 2024)
  • TABLE 202 BRAINCO, INC.: COMPANY OVERVIEW
  • TABLE 203 BRAINCO, INC.: PRODUCTS OFFERED
  • TABLE 204 MINDMAZE: COMPANY OVERVIEW
  • TABLE 205 MINDMAZE: PRODUCTS OFFERED
  • TABLE 206 MINDMAZE: PRODUCT LAUNCHES & APPROVALS (JANUARY 2021–MAY 2024)
  • TABLE 207 MINDMAZE: DEALS (JANUARY 2021–MAY 2024)
  • TABLE 208 COGNIXION: COMPANY OVERVIEW
  • TABLE 209 COGNIXION: PRODUCTS OFFERED
  • TABLE 210 COGNIXION: PRODUCT APPROVALS (JANUARY 2021–MAY 2024)
  • TABLE 211 BLACKROCK NEUROTECH: COMPANY OVERVIEW
  • TABLE 212 BLACKROCK NEUROTECH: PRODUCTS OFFERED
  • TABLE 213 BLACKROCK NEUROTECH: PRODUCT LAUNCHES (JANUARY 2021–MAY 2024)
  • TABLE 214 CORTEC GMBH: COMPANY OVERVIEW
  • TABLE 215 CORTEC GMBH: PRODUCTS OFFERED
  • TABLE 216 INTERAXON, INC.: COMPANY OVERVIEW
  • TABLE 217 INTERAXON, INC.: PRODUCTS OFFERED
  • TABLE 218 NEUROLUTIONS, INC.: COMPANY OVERVIEW
  • TABLE 219 NEUROLUTIONS, INC.: PRODUCTS OFFERED
  • TABLE 220 NEUROLUTIONS: PRODUCT APPROVALS (JANUARY 2021–MAY 2024)
  • TABLE 221 CONSCIOUS LABS: COMPANY OVERVIEW
  • TABLE 222 CONSCIOUS LABS: PRODUCTS OFFERED
  • TABLE 223 KERNEL: COMPANY OVERVIEW
  • TABLE 224 KERNEL: PRODUCTS OFFERED
  • TABLE 225 KERNEL: PRODUCT LAUNCHES (JANUARY 2021–MAY 2024)
  • TABLE 226 AAVAA INC.: COMPANY OVERVIEW
  • TABLE 227 AAVAA INC.: PRODUCTS OFFERED
  • TABLE 228 AAVAA: PRODUCT LAUNCHES (JANUARY 2021–MAY 2024)
  • TABLE 229 NEXSTEM: COMPANY OVERVIEW
  • TABLE 230 NEXSTEM: PRODUCTS OFFERED
  • TABLE 231 BIRGERMIND: COMPANY OVERVIEW
  • TABLE 232 BIRGERMIND: PRODUCTS OFFERED
LIST OF FIGURES
 
  • FIGURE 1 BRAIN-COMPUTER INTERFACE MARKET SEGMENTATION
  • FIGURE 2 BRAIN-COMPUTER INTERFACE MARKET: REGIONAL SEGMENTATION
  • FIGURE 3 RESEARCH APPROACH
  • FIGURE 4 BREAKDOWN OF PRIMARY INTERVIEWS: BY COMPANY TYPE, DESIGNATION, AND REGION
  • FIGURE 5 PRIMARY SOURCES
  • FIGURE 6 MARKET SIZE ESTIMATION: REVENUE SHARE ANALYSIS
  • FIGURE 7 TOP-DOWN APPROACH
  • FIGURE 8 BOTTOM-UP APPROACH
  • FIGURE 9 CAGR PROJECTIONS FROM ANALYSIS OF DRIVERS, RESTRAINTS, OPPORTUNITIES, AND CHALLENGES IN BRAIN-COMPUTER INTERFACE MARKET (2024–2029)
  • FIGURE 10 CAGR PROJECTIONS
  • FIGURE 11 DATA TRIANGULATION METHODOLOGY
  • FIGURE 12 BRAIN-COMPUTER INTERFACE MARKET, BY COMPONENT, 2024 VS. 2029 (USD MILLION)
  • FIGURE 13 BRAIN-COMPUTER INTERFACE MARKET, BY PRODUCT TYPE, 2024 VS. 2029 (USD MILLION)
  • FIGURE 14 BRAIN-COMPUTER INTERFACE MARKET, BY TECHNOLOGY, 2024 VS. 2027 (USD MILLION)
  • FIGURE 15 BRAIN-COMPUTER INTERFACE MARKET, BY APPLICATION, 2024 VS. 2027 (USD MILLION)
  • FIGURE 16 BRAIN-COMPUTER INTERFACE MARKET, BY END USER, 2024 VS. 2027 (USD MILLION)
  • FIGURE 17 GEOGRAPHICAL SNAPSHOT OF BRAIN-COMPUTER INTERFACE MARKET
  • FIGURE 18 GROWING PREVALENCE OF NEUROLOGICAL DISORDERS TO DRIVE MARKET GROWTH
  • FIGURE 19 NON-INVASIVE BCI ACCOUNTED FOR LARGEST MARKET SHARE IN 2023
  • FIGURE 20 CHINA TO REGISTER HIGHEST GROWTH RATE DURING FORECAST PERIOD
  • FIGURE 21 NORTH AMERICA TO DOMINATE MARKET DURING FORECAST PERIOD
  • FIGURE 22 EMERGING ECONOMIES TO REGISTER HIGHER GROWTH RATES DURING FORECAST PERIOD
  • FIGURE 23 BRAIN-COMPUTER INTERFACE MARKET: DRIVERS, RESTRAINTS, OPPORTUNITIES, AND CHALLENGES
  • FIGURE 24 GLOBAL HEALTHCARE EXPENDITURE SHARE, 1995 VS 2022
  • FIGURE 25 VALUE CHAIN ANALYSIS: BRAIN-COMPUTER INTERFACE MARKET
  • FIGURE 26 ECOSYSTEM ANALYSIS: KEY PLAYERS IN BRAIN-COMPUTER INTERFACE MARKET
  • FIGURE 27 KEY BUYING CRITERIA FOR BRAIN-COMPUTER INTERFACE, BY COMPONENT
  • FIGURE 28 JURISDICTION ANALYSIS: TOP APPLICANT COUNTRIES FOR BRAIN-COMPUTER INTERFACE PATENTS, 2013–2023
  • FIGURE 29 MAJOR PATENTS FOR BRAIN-COMPUTER INTERFACE (2013–2023)
  • FIGURE 30 IMPORT DATA FOR BRAIN-COMPUTER INTERFACE MARKET (HS CODE 852692), BY COUNTRY, 2021–2023 (USD THOUSAND)
  • FIGURE 31 EXPORT DATA FOR BRAIN-COMPUTER INTERFACE MARKET (HS CODE 852692), BY COUNTRY, 2021–2023 (USD THOUSAND)
  • FIGURE 32 FUNDING IN BRAIN-COMPUTER INTERFACE MARKET, BY PLAYER
  • FIGURE 33 NORTH AMERICA: BRAIN-COMPUTER INTERFACE MARKET SNAPSHOT
  • FIGURE 34 ASIA PACIFIC: BRAIN-COMPUTER INTERFACE MARKET SNAPSHOT
  • FIGURE 35 OVERVIEW OF STRATEGIES DEPLOYED BY KEY MANUFACTURING COMPANIES
  • FIGURE 36 MARKET SHARE ANALYSIS OF KEY PLAYERS IN BRAIN-COMPUTER INTERFACE MARKET (2023)
  • FIGURE 37 BRAIN-COMPUTER INTERFACE MARKET: COMPANY EVALUATION MATRIX (KEY PLAYERS), 2023
  • FIGURE 38 BRAIN-COMPUTER INTERFACE MARKET: COMPANY FOOTPRINT
  • FIGURE 39 BRAIN-COMPUTER INTERFACE MARKET: COMPANY EVALUATION MATRIX (SMES/ STARTUPS), 2023
  • FIGURE 40 EV/EBITDA OF KEY VENDORS
  • FIGURE 41 YEAR-TO-DATE (YTD) PRICE TOTAL RETURN AND 5-YEAR STOCK BETA OF KEY VENDORS
  • FIGURE 42 BRAIN-COMPUTER INTERFACE MARKET: BRAND/PRODUCT COMPARATIVE ANALYSIS


This market research study involved the extensive use of secondary sources, directories, and databases to identify and collect information useful for this technical, market-oriented, and financial study of the medical robots market. In-depth interviews were conducted with various primary respondents, including key industry participants, subject-matter experts (SMEs), C-level executives of key market players, and industry consultants, among other experts, to obtain and verify critical qualitative and quantitative information and to assess market prospects. The size of the brain computer interface market was estimated through various secondary research approaches and triangulated with inputs from primary research to arrive at the final market size.

Secondary Research

The secondary research process involved the widespread use of secondary sources, directories, databases (such as Bloomberg Businessweek, Factiva, and D&B Hoovers), white papers, annual reports, company house documents, investor presentations, and SEC filings of companies. Secondary research was used to identify and collect information useful for the extensive, technical, market-oriented, and commercial study of the brain computer interface market. It was also used to obtain important information about the key players and market classification and segmentation according to industry trends to the bottom-most level and key developments related to market and technology perspectives. A database of the key industry leaders was also prepared using secondary research.

Primary Research

Extensive primary research was conducted after acquiring basic knowledge about the global brain computer interface market scenario through secondary research. Several primary interviews were conducted with market experts from both the demand side (Hospital personnel, department heads, hospital directors, corporate personnel) and supply side (such as C-level and D-level executives, technology experts, software developers, marketing and sales managers, among others) across five major regions—North America, Europe, the Asia Pacific, Latin America, Middle East, and Africa. This primary data was collected through questionnaires, e-mails, online surveys, personal interviews, and telephonic interviews.

Breakdown of Primary Interviews
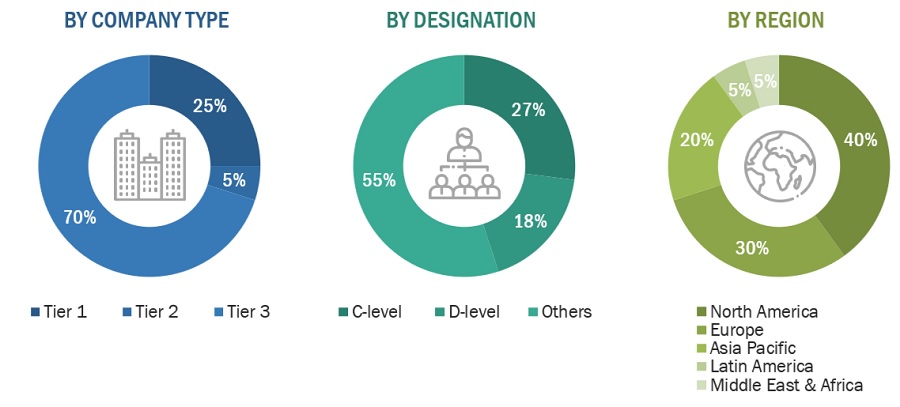
Brain Computer Interface Market Size, and Share

Note 1: Tiers are defined based on the total revenues of companies. As of 2023, Tier 1 = >USD 1 billion, Tier 2 = USD 500 million to USD 1 billion, and Tier 3 = <USD 500 million.

To know about the assumptions considered for the study, download the pdf brochure

Market Size Estimation

Both top-down and bottom-up approaches were used to estimate and validate the total size of the global brain computer interface market. These methods were also used extensively to estimate the size of various subsegments in the market. The research methodology used to estimate the market size includes the following:

  • Key players in the global brain computer interface market were identified through secondary research, and their global market shares were determined through primary and secondary research
  • The research methodology included the study of the annual and quarterly financial reports and regulatory filings, data books of major market players, and interviews with industry experts for detailed market insights.
  • All percentage shares, splits, and breakdowns for the global brain computer interface market were determined by using secondary sources and verified through primary sources.
  • All key macro indicators affecting the revenue growth of market segments and subsegments have been accounted for, viewed in extensive detail, verified through primary research, and analyzed to get validated and verified quantitative and qualitative data.
  • The gathered market data was consolidated and added with detailed inputs and analysis and presented in this report.

Global Brain Computer Interface Market: Bottom-Up Approach

Brain Computer Interface Market Size, and Share

To know about the assumptions considered for the study, Request for Free Sample Report

Global Brain Computer Interface Market: Top-Down Approach
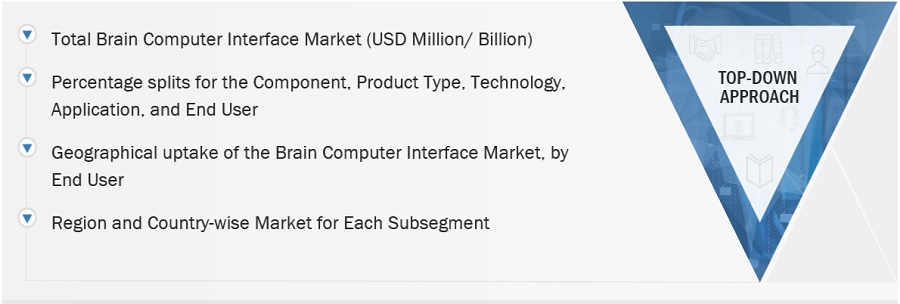
Brain Computer Interface Market Size, and Share

Data Triangulation

After arriving at the overall market size, from the market size estimation process explained above, the brain computer interface market was split into segments and subsegments. To complete the overall market engineering process and to arrive at the exact statistics for all segments and subsegments, data triangulation and market breakdown procedures were employed, wherever applicable. The data was triangulated by studying various factors and trends from both the demand and supply sides in the medical robots market.

Market Definition:

Brain-computer interface (BCI) refers to a technology that enables direct communication between the human brain and external devices, such as computers or prosthetic limbs, without the need for traditional input methods like keyboards. BCIs typically utilize various methods to capture the electrical activity generated by the brain utilizing different approaches such as electroencephalography (EEG) magnetoencephalography (MEG), functional near-infrared spectroscopy (fNIRS) or invasive neural implants, to interpret a user's intentions or commands. This allows individuals to interact with technology using only their thoughts or brain activity.

The BCI market encompasses the development, manufacturing, and deployment of these BCI systems and related technologies for various applications.

Key Stakeholders:

  • Manufacturers of brain computer interface solutions
  • Suppliers and distributors of brain computer interface solutions
  • Third-party refurbishers/suppliers
  • Clinical settings
  • Educational institutions
  • Group purchasing organizations (GPOs)
  • Academic research centers and universities
  • Corporate entities
  • Rehabilitation centers
  • Market research & consulting firms
  • Contract manufacturing organizations (CMOs)
  • Venture capitalists & investors

Report Objectives

  • To define, describe, and forecast the brain computer interface market by component, product type, technology, application, end user, and region
  • To provide detailed information regarding the major factors influencing the market growth (such as drivers, restraints, opportunities, and challenges)
  • To strategically analyze micromarkets1 with respect to individual growth trends, prospects, and contributions to the overall brain computer interface market
  • To analyze the opportunities in the market for stakeholders and provide details of the competitive landscape for market leaders
  • To profile the key players in the market and comprehensively analyze their market shares and core competencies2
  • To forecast the size of the market segments with respect to five main regions: North America, the Asia Pacific, Europe, Latin America, and the Middle East & Africa
  • To track and analyze competitive developments, such as partnerships, product launches & approvals, and expansions
  • To benchmark players within the brain computer interface market using the Competitive Evaluation Matrix, which analyzes market players on various parameters within the broad categories of business strategy, market share, and product offering

Available Customizations:

With the given market data, MarketsandMarkets offers customizations as per the company’s specific needs. The following customization options are available for the report:

Additional Company Profiling

  • Detailed analysis and profiling of additional market players (up to 5)

Geographic Analysis

  • Further breakdown of the Rest of Europe brain computer interface market into Switzerland, Russia, and others
  • Further breakdown of the Rest of Asia Pacific brain computer interface market into South Korea, Singapore, and others

Previous Versions of this Report

"Our USP is "providing game-changing business opportunities reports with free customization" - so please feel free to provide us with your specific areas of interest / business challenges in much greater detail !!"

We appreciate your interest in this report. Once you fill out the form, you'll be immediately directed to an exclusive solution tailored to your needs. This high-value offering can help boost your revenue by 30% - a must-see opportunity for anyone looking to maximize growth.


By clicking the "Submit" button, you are agreeing to the Terms of Use and Privacy Policy.

Custom Market Research Services

We Will Customise The Research For You, In Case The Report Listed Above Does Not Meet With Your Requirements

Get 10% Free Customisation

Growth opportunities and latent adjacency in Brain Computer Interface Market

DMCA.com Protection Status