Body Area Network Market by Device Type (Wearable, Implantable), Component (Displays, Application Processors, Memory, Electromechanicals, Interfaces, Sensors), Application (Medical, Fitness & Sports, Security, Military), and Region - Global Forecast to 2024


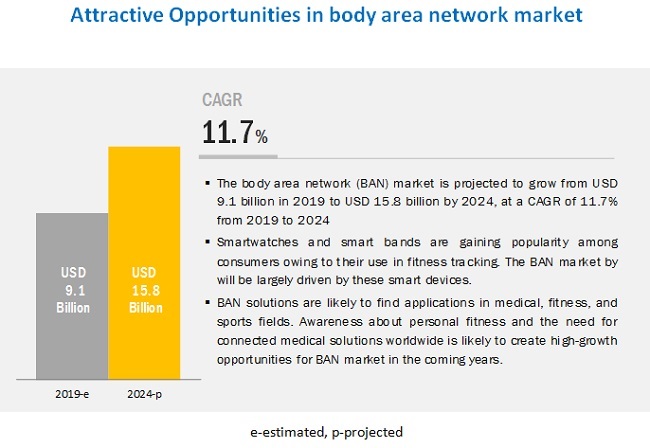
The Body Area Network Market is projected to grow from USD 9.1 Billion in 2019 to USD 15.8 Billion by 2024; it is expected to grow at a compound annual growth rate (CAGR) of 11.7%.
Increased use of smart devices for tracking physical fitness and its availability at low-cost, rapid advancements in medical devices and communication technologies, supportive government and hospital initiatives to promote digital healthcare are some of the driving factors of the market.
Impact of AI Body Area Network Market
The impact of artificial intelligence (AI) on the body area network (BAN) market is transforming healthcare and fitness by enabling smarter, more efficient systems for monitoring and managing personal health. AI enhances the functionality of BANs by processing data from wearable devices, such as smartwatches, fitness trackers, and medical sensors, in real-time. Through machine learning and predictive analytics, AI can detect early signs of health issues, optimize energy consumption, and offer personalized health insights. This integration improves patient care, supports remote monitoring, and empowers individuals to take control of their wellness, driving the growth of AI-powered BANs in healthcare, sports, and wellness applications.
Wearable devices would grow at the highest CAGR for body area network market during the forecast period
Wearable devices for body area network mainly includes smart bands, smartwatches, and smart earphones. The rapid adoption of smartwatches and smart bands in sports and fitness applications across various countries is accelerating market growth for wearable devices. Apple, Fitbit, Samsung, Fossil, Garmin, Huawei, and Xiaomi are among the few companies that offer smartwatches and smart bands, while companies such as Bragi and GN Group offers smart earphones.
Application processors and memory modules to account for the largest market share during the forecast period
Application processors are used widely in several wearable devices, including activity monitors, smartwatches, and smart wristbands. The use of application processor for combining data from multiple sensors, whether internal or external, where the received information is processed, and then the corrective action is taken. Increasing multimedia features in wearable devices such as smartwatches is accelerating the need for additional internal memory. Such factors contribute to a higher market share of application processors and memory modules in the body area network market.
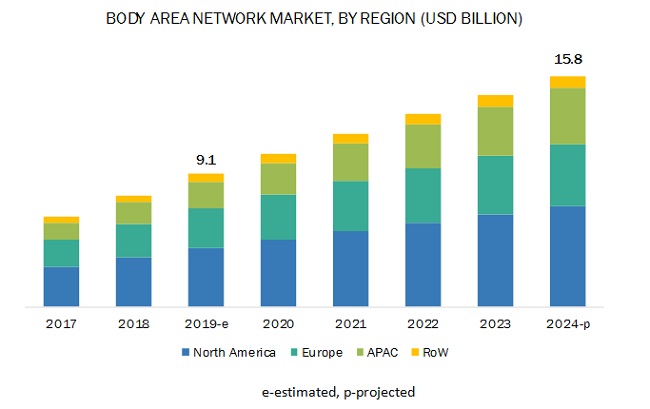
North America to account the largest share of the body area network market during the forecast period
Increasing penetration of smart devices such as smartwatches, fitness trackers, implantable devices; rising prevalence of chronic diseases and lifestyle-related disorders, growing healthcare costs, escalating demand for better healthcare services, and increasing government initiatives to promote digital health records are likely to drive the market growth. Surging penetration of 3G and 4G networks and rising awareness about self-health management are the factors to which growth of body area network market in North America can be attributed.
Key Market Players
Apple Inc. (US), Fitbit (US), Samsung Electronics Co., Ltd. (South Korea), Garmin Ltd. (US), Fossil Group, Inc. (US), Xiaomi Corporation (China), Huawei Technologies Co., Ltd. (China), Casio Computer Co., Ltd. (Japan), LG Electronics Inc. (South Korea), Medtronic plc (US), Bragi (Germany), Polar Electro Oy (Finland), Mobvoi Information Technology Company Limited (China), GOQii (US), Suunto Oy (Finland), Withings (France), AsusTek Computer Inc. (Taiwan), Abbott Laboratories (US), Huami Corporation (China), and Matrix Industries (US) are among a few major players in the body area network market.
Body Area Network Market Report Scope:
|
Report Metric |
Details |
| Estimated Market Size | USD 9.1 Billion in 2019 |
| Projected Market Size | USD 15.8 Billion by 2024 |
| Growth Rate | CAGR of 11.7% |
|
Market size available for years |
2016–2024 |
|
On Demand Data Available |
2029 |
|
Report Coverage |
|
|
Segments covered |
|
|
Geographies covered |
|
|
Companies covered |
|
This research report categorizes the market, By Device Type, Component, Application, and Geography
Based on Device Type, the body area network market has been classified into the following segments:
- Wearable Devices
- Implantable Devices
Based on Components, the body area network market has been classified into the following segments:
- Displays
- Application Processors & Memory Modules, and Pulse Generators
- Electromechanicals
- Communication & Interface Components
- Power Management Units
- Sensors
- Others
Based on the Application, the body area network market has been classified into the following segments:
- Medical, Fitness, and Sports
- Military
- Security
Based on Regions, the body area network market has been classified into the following segments:
- North America
- Europe
- APAC
- RoW
Recent Developments
- In April 2019, Garmin released its all-new Forerunner series of watches that includes Forerunner 45, Forerunner 45S, Forerunner 245, Forerunner 245 Music, and Forerunner 945.
- In March 2019, Fitbit announced the launch of four new products—Fitbit Versa Lite Edition, Fitbit Inspire HR, Fitbit Inspire, and Fitbit Ace 2.
- In February 2019, Samsung Electronics Co., Ltd. launched three new products: Galaxy Watch Active, Galaxy Fit, and Galaxy Buds.
- In October 2018, Fossil Group and CITIZEN Watch Company, Ltd. (Japan) announced a global strategic technology licensing partnership.
- In September 2018, Apple introduced Apple Watch Series 4 with watchOS 5, having advanced and communications features.
Key Questions Addressed by the Report
- Which are the leading applications in the market?
- Which region would lead the body area network market during the forecast period?
- What strategies are adopted by body area network players to stay ahead in the market?
- What are the growth perspectives of this market in different regions?
- What are drivers, opportunities, restraints, and challenges that influence the growth of the market?
Frequently Asked Questions (FAQ):
Why there is increasing need of wearables and implantable devices? Which devices are expected to drive the growth of the market in the next 5 years?
Increased use of smart devices for tracking physical fitness, rapid advancements in medical devices and comunication technologies, supportive government and hospital initiatives to promote digital healthcare, and easy availability of low-cost fitness-tracking gadgets are factors expected to boost body area network market. Wearable devices such as smartwatches and smart bands are expected to lead the body area network market due to its increasing adoption in sports and fitness application. Implantable devices are likely to witness the highest CAGR during the forecast period due to rapidly advancing technology and widespread implementation of implantable devices into clinical practice.
Which are the major companies in the market? What are their major strategies to strengthen their market presence?
Apple, Fitbit, Samsung, Garmin, and Fossil are some of the major companies providing wearable devices such as smartwatches and smart bands. Product launches, partnerships, and collaborations are some of the key strategies adopted by these players. These companies are focussed on market development by introducing its products in various countries across the world. Pricing is the key strategy companies look to compete on due to availability of cheaper devices in the market from various small to medium scale companies.
Which region is expected to witness significant demand for body area network market in the coming years?
North America is expected to have the largest market share in terms of value and volume due to the presence leading providers of wearable devices such as Apple (US), Fitbit (US), Garmin (US), and Fossil (US) in the region. Growth in North America can be attributed to the surging penetration of smartwatches, tracker bands, and fitness platforms. APAC market is expected to grow at the highest CAGR as the increasing prevalence of several types of chronic diseases and their economic burden on APAC are the major factors that accelerate the demand for advanced technologies, such as body area network, in the healthcare industry of the region.
Which are the major application areas of this market?
Some of the major application areas of body area network includes medical, fitness, and sports; and security. Medical, fitness, and sports application is expected to hold largest market share and to grow at the highest CAGR during the forecast period. Wearable devices, such as smartwatches and smart bands, used to track sports activities and analyze fitness, while implantable devices are adopted in medical applications. As these devices are majorly used in medical, fitness, and sports applications, the market for this application is expected to witness significant growth in the coming years.
Which are the major opportunities in the industrial wearables market?
The growing concerns over the rising healthcare costs, the need for establishing connectivity across medical devices through body area networks is expected to gain importance among heathcare organizations in the coming years. Also, development in IoT technology is expected to provide growth opportunities for body area network market. .
To speak to our analyst for a discussion on the above findings, click Speak to Analyst
 Exclusive indicates content/data unique to MarketsandMarkets and not available with any competitors.
Table of Contents
1 Introduction (Page No. - 16)
1.1 Study Objectives
1.2 Definition
1.3 Study Scope
1.3.1 Markets Covered
1.3.2 Years Considered
1.4 Currency
1.5 Limitations
1.6 Stakeholders
2 Research Methodology (Page No. - 20)
2.1 Research Data
2.1.1 Secondary Data
2.1.1.1 Secondary Sources
2.1.2 Primary Data
2.1.2.1 Key Data From Primary Sources
2.1.2.2 Breakdown of Primaries
2.1.2.3 Key Industry Insights
2.2 Market Size Estimation
2.2.1 Bottom-Up Approach
2.2.1.1 Approach for Capturing Market Size By Bottom-Up Analysis(Demand Side)
2.2.2 Top-Down Approach
2.2.2.1 Approach for Capturing Market Size By Top-Down Analysis(Supply Side)
2.3 Market Breakdown and Data Triangulation
2.4 Research Assumptions
3 Executive Summary (Page No. - 29)
4 Premium Insights (Page No. - 32)
4.1 Attractive Opportunities in Body Area Network Market
4.2 Market, By Component and Region
4.3 Country-Wise Market Growth Rate
5 Market Overview (Page No. - 35)
5.1 Introduction
5.2 Market Dynamics
5.2.1 Drivers
5.2.1.1 Increased Use of Smart Devices for Tracking Physical Fitness
5.2.1.2 Rapid Advancements in Medical Devices and Communication Technologies
5.2.1.3 Supportive Government and Hospital Initiatives to Promote Digital Healthcare
5.2.1.4 Easy Availability of Low-Cost Fitness-Tracking Gadgets
5.2.2 Restraints
5.2.2.1 Social Refrain Due to the Threat of Invasion of Privacy
5.2.3 Opportunities
5.2.3.1 Utilization of Advanced Technologies to Reduce Constantly Increasing Healthcare Expenditure
5.2.3.2 Adoption of IoT in Healthcare Applications
5.2.4 Challenges
5.2.4.1 Securing Huge Volumes of Sensitive Data
6 Body Area Network Market, By Device Type (Page No. - 41)
6.1 Introduction
6.2 Wearable Devices
6.2.1 Smart Bands
6.2.1.1 Rising Awareness About Fitness Monitoring Among Users Accelerating Demand for Smart Bands
6.2.2 Smartwatches
6.2.2.1 Growing Importance of Monitoring Health Parameters Encouraging Users to Adopt Smartwatches
6.2.3 Smart Earphones
6.2.3.1 Rapid Innovations in Designing Smart Earphones for Fitness and Health Monitoring Surge Adoption of Smart Earphones
6.3 Implantable Devices
6.3.1 Advances in Medical Applications and Communication Technologies Propel Market Growth
7 Body Area Network Market, By Component (Page No. - 53)
7.1 Introduction
7.2 Displays
7.2.1 OLED Displays Gaining Traction for Smart Bands and Smartwatches
7.3 Application Processors and Memory Modules, and Pulse Generators
7.3.1 Application Processors and Memory Modules, and Pulse Generators Likely to Continue to Command Ban Market
7.4 Electromechanicals
7.4.1 Necessity of Electromechanical Components to Ensure Support and Rigidity of Complete Device
7.5 Communication and Interface Components
7.5.1 Importance of Communiaction and Interface Components to Transmit Data to Different Devices
7.6 Power Management Units
7.6.1 Implementation of Advanced Power Management Components to Meet Rising Demand of End Users for Enhanced Battery Life
7.7 Sensors
7.7.1 Utilization of Sensors to Monitor Different Health Parameters Including Heart Rate and Body Temperature
7.8 Others
8 Body Area Network Market, By Application (Page No. - 65)
8.1 Introduction
8.2 Medical, Fitness, and Sports Application
8.2.1 Medical
8.2.1.1 Increasing Importance of Remote Health Monitoring Generating Huge Opportunity for Players in Ban Market
8.2.2 Fitness
8.2.2.1 Rising Health Awareness and Availability of Low-Cost Smart Bands Boosting Ban Market Growth
8.2.3 Sports
8.2.3.1 Growing Adoption of Wearable Technology in Sports Offers Lucrative Growth Opportunities for Ban Market
8.3 Security
8.3.1 Technological Advancements in Smartwatches Enable Its Use for Security Applications
8.4 Military
8.4.1 Body Area Network Devices Used for Monitoring Health Parameters of Soldiers
9 Geographic Analysis (Page No. - 71)
9.1 Introduction
9.2 North America
9.2.1 US
9.2.1.1 US Market Growth Driven By Early Adoption of Wearables and Connected Devices in Medical and Fitness Applications
9.2.2 Canada
9.2.2.1 Accelerated Market Growth in Canada Owing to High Need to Reduce Healthcare Costs
9.2.3 Mexico
9.2.3.1 Digitization in Healthcare Through Government Initiatives to Create Growth Opportunities
9.3 Europe
9.3.1 Germany
9.3.1.1 Increasing Geriatric Population Leads to Rise in Demand for Remote Health Monitoring and Telemedicine
9.3.2 UK
9.3.2.1 Use of Wearables in Medical Applications Accelerates Demand for Ban Devices in Country
9.3.3 France
9.3.3.1 Demand for Wearables to Track Personal Fitness Driving the Market Growth
9.3.4 Italy
9.3.4.1 Health Management Programs Focusing on Efficient Patient Monitoring Propels Italian Market Growth
9.3.5 Rest of Europe
9.4 APAC
9.4.1 China
9.4.1.1 Remote Patient Monitoring, Telemedicine, Assisted Living, and Health Monitoring Applications to Surge Demand for Wearable Devices
9.4.2 Japan
9.4.2.1 Supportive Government Initiatives for Modernization of Healthcare to Create Growth Opportunity for Ban Market
9.4.3 South Korea
9.4.3.1 Efforts By Leading Players to Offer Different Types of Wearables Promote Use of Ban Devices
9.4.4 India
9.4.4.1 Inclination Toward the Use of Wearables and E-Health Solutions to Drive Ban Market Growth
9.4.5 Rest of APAC
9.5 RoW
9.5.1 South America
9.5.1.1 Increasing Trends of Digital Health to Provide Opportunity for the Market
9.5.2 Middle East and Africa
9.5.2.1 Rising Adoption of Advanced Communication Technologies to Boost Demand for Ban Devices
10 Competitive Landscape (Page No. - 97)
10.1 Overview
10.2 Market Ranking Analysis
10.2.1 Product Launches
10.2.2 Collaborations and Partnerships
10.2.3 Expansions
10.3 Competitive Leadership Mapping
10.3.1 Visionary Leaders
10.3.2 Dynamic Differentiators
10.3.3 Innovators
10.3.4 Emerging Players
11 Company Profiles (Page No. - 103)
(Business Overview, Products Offered, Recent Developments, SWOT Analysis, and MnM View)*
11.1 Introduction
11.2 Key Players
11.2.1 Apple
11.2.2 Fitbit
11.2.3 Samsung
11.2.4 Garmin
11.2.5 Fossil
11.2.6 Casio
11.2.7 Huawei
11.2.8 LG Electronics
11.2.9 Medtronic
11.2.10 Xiaomi
11.3 Other Key Players
11.3.1 Abbott Laboratories
11.3.2 Asus
11.3.3 Bragi
11.3.4 Goqii
11.3.5 Huami Corporation
11.3.6 Matrix Industries
11.3.7 Mobvoi
11.3.8 Polar Electro
11.3.9 Suunto
11.3.10 Withings
*Details on Business Overview, Products Offered, Recent Developments, SWOT Analysis, and MnM View Might Not Be Captured in Case of Unlisted Companies.
12 Appendix (Page No. - 136)
12.1 Discussion Guide
12.2 Knowledge Store: Marketsandmarkets’ Subscription Portal
12.3 Available Customizations
12.4 Related Reports
12.5 Author Details
List of Tables (63 Tables)
Table 1 Market, By Device Type, 2016–2024 (USD Million)
Table 2 Market for Wearable Devices, By Region, 2016–2024 (USD Million)
Table 3 Market for Wearable Devices, By Component, 2016–2024 (USD Million)
Table 4 Market in North America for Wearable Devices, By Component, 2016–2024 (USD Million)
Table 5 Market in Europe for Wearable Devices, By Component, 2016–2024 (USD Million)
Table 6 Market in APAC for Wearable Devices, By Component, 2016–2024 (USD Million)
Table 7 Market in RoW for Wearable Devices, By Component, 2016–2024 (USD Million)
Table 8 Market for Wearable Devices, By Application, 2016–2024 (USD Million)
Table 9 Wearable Body Area Network for Medical, Fitness, and Sports Application, By Region, 2016–2024 (USD Million)
Table 10 Market for Implantable Devices, By Region, 2016–2024 (USD Million)
Table 11 Market for Implantable Devices, By Component, 2016–2024 (USD Million)
Table 12 Market in North America for Implantable Devices, By Component, 2016–2024 (USD Million)
Table 13 Market in Europe for Implantable Devices, By Component, 2016–2024 (USD Million)
Table 14 Market in APAC for Implantable Devices, By Component, 2016–2024 (USD Million)
Table 15 Market in RoW for Implantable Devices, By Component, 2016–2024 (USD Million)
Table 16 Implantable Body Area Network for Medical, Fitness, and Sports Application By Region, 2016–2024 (USD Million)
Table 17 Market, By Component, 2016–2024 (USD Million)
Table 18 Market for Displays, By Region, 2016–2024 (USD Million)
Table 19 Market for Application Processors and Memory Modules, and Pulse Generators, 2016–2024 (USD Million)
Table 20 Market for Application Processors and Memory Modules, By Region, 2016–2024 (USD Million)
Table 21 Market for Pulse Generators, By Region, 2016–2024 (USD Million)
Table 22 Market for Electromechanicals, By Region, 2016–2024 (USD Million)
Table 23 Market for Communication and Interface Components, By Region, 2016–2024 (USD Million)
Table 24 Market for Power Management Units, By Region, 2016–2024 (USD Million)
Table 25 Market for Sensors, By Region, 2016–2024 (USD Million)
Table 26 Market for Other Components in Wearable Devices, By Region, 2016–2024 (USD Million)
Table 27 Market for Other Components in Implantable Devices, By Region, 2016–2024 (USD Million)
Table 28 Market, By Application, 2016–2024 (USD Million)
Table 29 Market for Medical, Fitness, and Sports Application, By Region, 2016–2024 (USD Million)
Table 30 Market for Security Application, By Region, 2016–2024 (USD Million)
Table 31 Market for Military Application, By Region, 2016–2024 (USD Million)
Table 32 Market, By Region, 2016–2024 (USD Million)
Table 33 Market in North America, By Country, 2016–2024 (USD Million)
Table 34 Market in North America, By Component, 2016–2024 (USD Million)
Table 35 Market in North America, By Application, 2016–2024 (USD Million)
Table 36 Market in North America for Wearable Devices, By Application, 2016–2024 (USD Million)
Table 37 Market in North America for Medical, Fitness, and Sports Application, By Country, 2016–2024 (USD Million)
Table 38 Market in North America for Military Application, By Country, 2016–2024 (USD Million)
Table 39 Market in North America for Security Application, By Country, 2016–2024 (USD Million)
Table 40 Market in Europe, By Country, 2016–2024 (USD Million)
Table 41 Market in Europe, By Component, 2016–2024 (USD Million)
Table 42 Market in Europe, By Application, 2016–2024 (USD Million)
Table 43 Market in Europe for Wearable Devices, By Application, 2016–2024 (USD Million)
Table 44 Market in Europe for Medical, Fitness, and Sports Application, By Country, 2016–2024 (USD Million)
Table 45 Market in Europe for Military Application, By Country, 2016–2024 (USD Million)
Table 46 Market in Europe for Security Application, By Country, 2016–2024 (USD Million)
Table 47 Market in APAC, By Country, 2016–2024 (USD Million)
Table 48 Market in APAC for Wearable and Implantable Devices, By Component, 2016–2024 (USD Million)
Table 49 Market in APAC, By Application, 2016–2024 (USD Million)
Table 50 Market in APAC for Wearable Devices, By Application, 2016–2024 (USD Million)
Table 51 Market in APAC for Medical, Fitness, and Sports Application, By Country, 2016–2024 (USD Million)
Table 52 Market in APAC for Military Application, By Country, 2016–2024 (USD Million)
Table 53 Market in APAC for Security Application, By Country, 2016–2024 (USD Million)
Table 54 Market in RoW, By Region, 2016–2024 (USD Million)
Table 55 Market in RoW, By Component, 2016–2024 (USD Million)
Table 56 Market in RoW, By Application, 2016–2024 (USD Million)
Table 57 Market in RoW for Wearable Devices, By Application, 2016–2024 (USD Million)
Table 58 Market in RoW for Medical, Fitness, and Sports Application, By Region, 2016–2024 (USD Million)
Table 59 Market in RoW for Military Application, By Region, 2016–2024 (USD Million)
Table 60 Market in RoW for Security Application, By Region, 2016–2024 (USD Million)
Table 61 Product Launches, 2018–2019
Table 62 Collaborations and Partnerships, 2018–2019
Table 63 Expansions, 2018
List of Figures (41 Figures)
Figure 1 Market Segmentation
Figure 2 Market: Process Flow of Market Size Estimation
Figure 3 Market: Research Design
Figure 4 Market: Bottom-Up Approach
Figure 5 Market: Top-Down Approach
Figure 6 Data Triangulation
Figure 7 Assumptions for Research Study
Figure 8 Wearable Devices to Account for Larger Share of Market in 2024
Figure 9 Medical, Fitness, and Sports Application to Witness Largest Share of Ban Market in 2024
Figure 10 Market in APAC to Grow at Highest CAGR During Forecast Period
Figure 11 Growing Adoption of Smartwatches and Smart Bands Worldwide to Drive Market for Body Area Network Devices
Figure 12 APAC to Account for Largest Share of Market, By Region, in 2024
Figure 13 Market in China to Grow at Fastest CAGR During Forecast Period
Figure 14 Ban Market: Drivers, Restraints, Opportunities, and Challenges
Figure 15 Wearable Devices to Hold Larger Size of Market in 2024
Figure 16 Application Processors and Memory Modules Expected to Continue to Command Market for Wearable Devices From 2019 to 2024
Figure 17 Pulse Generators Would Lead Market for Implantable Devices in 2024
Figure 18 Application Processors and Memory Modules, and Pulse Generators to Hold Largest Market Size in 2024
Figure 19 APAC to Witness Highest CAGR in Market for Displays During Forecast Period
Figure 20 North America to Register Largest Size of Market for Application Processors and Memory Modules in 2024
Figure 21 Market in APAC for Electromechanicals to Record Highest CAGR During Forecast Period
Figure 22 North America to Account for Largest Size of Market for Communication and Interface Components in 2024
Figure 23 Medical, Fitness, and Sports Application Expected to Exhibit Highest CAGR in of Market During Forecast Period
Figure 24 Market in APAC for Medical, Fitness, and Sports Application to Grow at Highest CAGR During Forecast Period
Figure 25 APAC to Exhibit Highest CAGR in Market During 2019–2024
Figure 26 Market Snapshot in North America
Figure 27 Market Snapshot in Europe
Figure 28 Market Snapshot in APAC
Figure 29 Organic and Inorganic Strategies Adopted By Companies Operating in Market
Figure 30 Market Player Ranking, 2018
Figure 31 Market (Global) Competitive Leadership Mapping (2018)
Figure 32 Apple: Company Snapshot
Figure 33 Fitbit: Company Snapshot
Figure 34 Samsung: Company Snapshot
Figure 35 Garmin: Company Snapshot
Figure 36 Fossil: Company Snapshot
Figure 37 Casio: Company Snapshot
Figure 38 Huawei: Company Snapshot
Figure 39 LG Electronics: Company Snapshot
Figure 40 Medtronic: Company Snapshot
Figure 41 Xiaomi: Company Snapshot
The study has involved four major activities in estimating the size of the body area network market. Exhaustive secondary research has been done to collect information on the market, the peer market, and the parent market. To validate these findings, assumptions, and sizing with industry experts across the value chain through primary research has been the next step. Both top-down and bottom-up approaches have been employed to estimate the total market size. After that, market breakdown and data triangulation methods have been used to estimate the market for segments and subsegments.
Secondary Research
In the secondary research process, various secondary sources such as Hoovers, Bloomberg BusinessWeek, and Factiva have been referred to identify and collect information for this study. These secondary sources included annual reports, press releases and investor presentations of companies, white papers, certified publications, articles by recognized authors, gold-standard and silver-standard websites, regulatory bodies, trade directories, and databases.
Primary Research
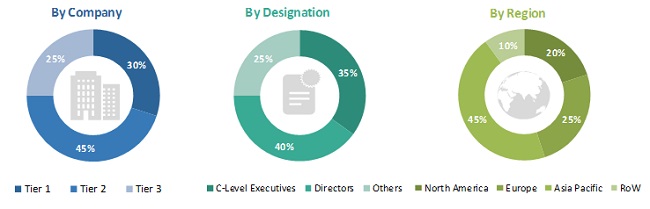
The body area network market comprises several stakeholders, such as wearable device and implantable device manufacturers, component providers, among others in the supply chain. The demand side of this market includes end-users from various applications such as medical, fitness, sports, security, and military. Various primary sources from both the supply and demand sides of the market have been interviewed to obtain qualitative and quantitative information. The breakdown of primary respondents is as follows
To know about the assumptions considered for the study, download the pdf brochure
Market Size Estimation
Both top-down and bottom-up approaches have been used to estimate and validate the total size of the body area network market. These methods have also been used extensively to determine the size of various subsegments in the market. The research methodology used to estimate the market size is as follows:
- Key players in the industry and markets have been identified through extensive secondary research.
- The industry’s supply chain and market size, in terms of value, have been determined through primary and secondary research processes.
- Players offering various types of wearable and implantable devices are considered, their revenue for devices has been observed to arrive at global numbers.
- All percentage shares, splits, and breakdowns have been determined using secondary sources and verified through primary sources.
Data Triangulation
After arriving at the overall market size—using the market size estimation processes as explained above—the market has been split into several segments and subsegments. To complete the entire market engineering process and arrive at the exact statistics of each market segment and subsegment, the data triangulation, and market breakdown procedures have been employed, wherever applicable. The data has been triangulated by studying various factors and trends from both the demand and supply sides in the body area network market.
Report Objectives
- To describe and forecast the body area network market by device type, component, and application, in terms of value
- To describe and forecast the market for various segments with regard to main regions, namely, North America, Europe, Asia Pacific (APAC), and Rest of the World (RoW), in terms of value
- To provide detailed information regarding major factors that include drivers, restraints, opportunities, and challenges influencing the growth of the body area network market
- To strategically analyze micromarkets1 with respect to individual growth trends, prospects, and contribution to the total market
- To strategically profile key players and comprehensively analyze their market position on the basis of their revenue and core competencies2, along with detailing the competitive landscape for market leaders
- To analyze competitive developments, such as collaborations, agreements, partnerships, and product launches, in the body area network market
- To benchmark players within the market using proprietary "Competitive Leadership Mapping" framework, which analyzes market players on various parameters within the broad categories of business and product strategy
Available Customizations:
With the given market data, MarketsandMarkets offers customizations according to the company’s specific needs. The following customization options are available for the report:
Company Information:
- Detailed analysis and profiling of additional market players


Growth opportunities and latent adjacency in Body Area Network Market