Bioceramics Market

Bioceramics Market by Type (Bio-inert, Bio-active, Bio-resorbable), Material Type (Aluminum Oxide, Zirconia, Calcium Phosphate, Calcium Sulfate), Form (Powder, Liquid), Application (Orthopedics, Dental, Biomedical), and Region- Forecast to 2028

Report Code: CH 8964 Mar, 2024, by marketsandmarkets.com

Updated on : April 05, 2024

Bioceramics Market

Bioceramics market was valued at USD 7.4 billion in 2023 and is projected to reach USD 10.2 billion by 2028, growing at 6.7% cagr from 2023 to 2028. Bioceramics is a relatively new field; it did not exist until the beginning of the 1970s. The commercialization of bioceramics began to gain momentum in the late 20th century. The commercialization of bioceramics started with the introduction of alumina (aluminum oxide) and zirconia (zirconium dioxide) ceramics for orthopedic implants, such as hip replacements. Companies like Zimmer Biomet, DePuy Synthes, and Stryker began producing and marketing ceramic-based implants for joint replacement surgeries. With advancements in materials science and manufacturing technologies, the commercialization of bioceramics expanded further in the 1900s. Companies invested in research and development to improve the performance, biocompatibility, and longevity of bioceramic products. The commercialization of bioceramics has continued to evolve in the 21st century. Companies are increasingly investing in innovative bioceramic technologies, such as additive manufacturing (3D printing), surface modifications to enhance bioactivity, and nanoscale engineering for improved properties.

The major applications of bioceramics in today’s day and age include orthopedic, dental, and other biomedical applications.

Attractive Opportunities in Bioceramics Market Trends

Bioceramics Market

To know about the assumptions considered for the study, Request for Free Sample Report

Bioceramics Market

Bioceramics Market Dynamics

Driver: Biocompatibility

One of the major drivers of bioceramics in the medical market is aging population. As the global population ages, there is a growing demand for medical solutions to address age-related conditions such as osteoarthritis, osteoporosis, and dental problems. Increasing awareness among patients and healthcare professionals about the benefits of bioceramic materials, such as their biocompatibility, durability, and ability to integrate with natural tissues, is driving demand for bioceramic products in various medical applications.

Restraint: Long-Term Performance and Durability Concerns

While bioceramic materials are known for their biocompatibility and resistance to corrosion, concerns about long-term performance and durability of implants and devices may arise. Although there has been significant progress in the development of bioceramic materials, the range of available materials is still relatively limited compared to other biomaterials. This limitation may restrict the suitability of bioceramics for certain medical applications or patient populations, limiting market opportunities. The production of bioceramic materials often involves sophisticated manufacturing processes, specialized equipment, and quality control measures to ensure biocompatibility and performance. These factors contribute to higher manufacturing costs, which can limit market growth, particularly in price-sensitive markets or for patients without adequate healthcare coverage.

Opportunity: Emerging markets and medical tourism along with sustainable nature.

Growing healthcare infrastructure in emerging markets present opportunities for market expansion in regions such as Asia-Pacific, Latin America, and the Middle East. Additionally, medical tourism trends drive demand for high-quality bioceramic implants and devices in countries offering advanced healthcare services at competitive prices like India, China and Malaysia. Bioceramic materials play a critical role in regenerative medicine and stem cell therapy by providing scaffolds for cell attachment, proliferation, and differentiation. Opportunities exist for developing bioceramic-based products and therapies that harness the regenerative potential of stem cells for tissue repair and organ regeneration.

Challenge: Long term durability and cost considerations

Ensuring the long-term durability, stability, and performance of bioceramic implants and devices over the patient's lifespan is critical for minimizing the risk of implant failure, revision surgeries, and associated healthcare costs. The cost of bioceramic implants and devices, including manufacturing costs, material expenses, and associated healthcare expenditures, can be significant compared to alternative biomaterials. Challenges may arise in achieving cost-effective solutions that balance performance, quality, and affordability while meeting healthcare budget constraints.

Bioceramics Market Ecosystem

Bioceramics Market Ecosystem

Based on the material type, the calcium phosphate segment is estimated to be the fastest-growing type during the forecast period in terms of value.

Calcium phosphate is often combined with phosphopeptide to form products such as recaldent and tooth mousse, which are applied directly to teeth to aid in remineralization and reduce sensitivity. The material has shown significant effects on biomineralization and has promising applications in drug delivery and bone therapy. Its unique properties, such as high capacity for drug loading and controlled release, make it suitable for these applications.

Based on the type, the bio-active segment is estimated to be the fastest-growing type during the forecast period, in terms of value.

When implanted, bioactive ceramics stimulate healing and trigger the response of the tissue system. Bio-active ceramics are largely used to repair bone damage owing to their compatibility with living bone. These ceramics are osteoconductive and form a bone-like apatite through a chemical reaction with surrounding body fluids. These ceramics interact with the body so that tissue bonding and further integration into the body occur over time.

Based on application, the orthopedic application segment is anticipated to register the second-highest CAGR in bioceramics market.

Bioceramics are commonly used in orthopedic applications due to several advantageous properties that make them suitable for this field. Bioceramics are biocompatible materials, meaning they are well-tolerated by the body and elicit minimal immune response or rejection when implanted into living tissue. This property is crucial for orthopedic implants, as they need to integrate seamlessly with bone tissue without causing adverse reactions. Some bioceramics are bio-active, meaning they have the ability to chemically bond with bone tissue and stimulate bone regeneration.

Europe to be the second-largest market for Bioceramics during the forecast period, in terms of value.

The European bioceramics market is a mature market. Currently, bioceramics are increasingly used to produce orthopedic and dental implants. There is a forecasted growth of opportunities in the medical industry in the European market due to the biocompatible nature of the material and increasing change in the consumer behavior.

Bioceramics Market by Region

To know about the assumptions considered for the study, download the pdf brochure

Bioceramics Market Players

The bioceramic market is dominated by a few globally established players,Coorstek, Inc . (US), Kyocera Corporation (Japan), Morgan Advanced Materials Plc (UK), CeramTec GmbH (Germany), Tosoh Ceramics Co., Ltd. (Japan), Institut Straumann AG (Switzerland), Berkeley Advanced Biomaterials Inc. (US), DSM (Netherlands), CTL Amedica (US), and 3M (US). among others, are the main producers in the global market.

These companies are attempting to establish themselves in the bioceramic market by employing a range of inorganic and organic approaches. A thorough competitive analysis of these major bioceramic market participants is included in the research, along with information on their company profiles, most recent advancements, and important market strategies.

Bioceramics Market Report Scope

Report Metric

Details

Market Size Value in 2022

USD 7.1 Billion

Revenue Forecast in 2028

USD 10.2 Billion

CAGR

6.7%

Market size available for years

2018–2028

Base year considered

2022

Forecast period

2023–2028

Units considered

Value (USD Million), Volume (Kiloton)

Segments Covered

By Type, By Form, By Material Type, By Application, By Region

Geographies covered

Europe, North America, Asia Pacific, Latin America, Middle East, and Africa

Companies covered

Coorstek, Inc. (US), Kyocera Corporation (Japan), Morgan Advanced Materials Plc (UK), CeramTec GmbH (Germany), Tosoh Ceramics Co., Ltd. (Japan), Institut Straumann AG (Switzerland), Berkeley Advanced Biomaterials Inc. (US), DSM (Netherlands), CTL Amedica (US), and 3M (US).

The study categorizes the bioceramics market based on Type, Application, and Region.

Bioceramics Market by Type
  • Bio-inert
  • Bio-active
  • Bio-resorbable
Bioceramics Market by Material Type
  • Aluminum Oxide
  • Zirconia
  • Calcium Phosphate
  • Calcium Sulfate
  • Bio-active Glass
  • Others (Carbon, Silicon Nitride, Boron Nitride, Barium Titanate)
Bioceramics Market by Application
  • Orthopedic
  • Dental
  • Bio-medical
Bioceramics Market by Form
  • Powder
  • Liquid
Bioceramics Market by Region
  • North America
  • Asia Pacific
  • Europe
  • Latin America
  • Middle East & Africa

Recent Developments in Bioceramics Market

  • In January 2021, The CeramTec Group had announced the acquisition of the Swiss specialist for ceramic dental implants, Dentalpoint AG.
  • In May 2021, CeramTec GmbH launched BIOLOX Contura, femoral heads that retain the outer diameter profile of conventional implants and incorporate a contoured shoulder with a lesser radius.
  • In August 2021, Kyocera Corporation announced that it has entered into an agreement with Osteon Digital Japan Co., Ltd. for continuous sales transactions, and will begin sales of customized dental prostheses for implants utilizing Implant Solutions digital technology starting in September 2021.
  • In December 2021, Tosoh Ceramics Co., Ltd. introduced Zgaia, a next-gen, higher grade zirconia powder developed to achieve a perfect balance of high fracture toughness and high bending strength that opens a new world of applications.
  • In June 2022, CoorsTek, announced the expansion of the Advanced Materials Processing (AMP) center at its Benton, Arkansas facility.
  • In August 2023, Smith + Nephew launched OR3O Dual Mobility System in India for use in primary and revision hip arthroplasty.
  • In September 2023, Straumann Group acquired AlliedStar to complement its intraoral scanner portfolio across different price points and expand market access of its digital solutions.

Frequently Asked Questions (FAQ):

To speak to our analyst for a discussion on the above findings, click Speak to Analyst

TABLE OF CONTENTS
 
1 INTRODUCTION (Page No. - 31)
    1.1 STUDY OBJECTIVES 
    1.2 MARKET DEFINITION 
    1.3 INCLUSIONS AND EXCLUSIONS 
    1.4 MARKET SCOPE 
           FIGURE 1 BIOCERAMICS MARKET SEGMENTATION
           1.4.1 REGIONS COVERED
           1.4.2 YEARS CONSIDERED
    1.5 CURRENCY CONSIDERED 
    1.6 UNITS CONSIDERED 
    1.7 LIMITATIONS 
    1.8 STAKEHOLDERS 
    1.9 IMPACT OF RECESSION 
 
2 RESEARCH METHODOLOGY (Page No. - 36)
    2.1 RESEARCH DATA 
    2.2 RESEARCH DESIGN 
    2.3 BASE NUMBER CALCULATION 
           2.3.1 APPROACH 1: SUPPLY-SIDE APPROACH
           2.3.2 APPROACH 2: DEMAND-SIDE APPROACH
    2.4 IMPACT OF RECESSION 
    2.5 FORECAST NUMBER CALCULATION 
           2.5.1 SUPPLY SIDE
           2.5.2 DEMAND SIDE
           2.5.3 SECONDARY DATA
                    2.5.3.1 Key data from secondary sources
           2.5.4 PRIMARY DATA
                    2.5.4.1 Key data from primary sources
                    2.5.4.2 Interviews with top manufacturers of bioceramics
                    2.5.4.3 Breakdown of interviews with experts
                    2.5.4.4 Key industry insights
    2.6 MARKET SIZE ESTIMATION 
           2.6.1 BOTTOM UP APPROACH
                    FIGURE 2 MARKET SIZE ESTIMATION METHODOLOGY: BOTTOM UP APPROACH
           2.6.2 TOP DOWN APPROACH
                    FIGURE 3 TOP DOWN APPROACH
    2.7 DATA TRIANGULATION 
          FIGURE 4 DATA TRIANGULATION
    2.8 FACTOR ANALYSIS 
    2.9 RESEARCH ASSUMPTIONS 
    2.10 MARKET GROWTH RATE ASSUMPTION 
    2.11 LIMITATIONS IN MARKET SIZE ESTIMATION 
    2.12 ASSOCIATED RISKS 
 
3 EXECUTIVE SUMMARY (Page No. - 46)
    FIGURE 5 BIO-INERT TYPE SEGMENT LED BIOCERAMICS MARKET IN 2022
    FIGURE 6 POWDER FORM DOMINATED BIOCERAMICS MARKET IN 2022
    FIGURE 7 ZIRCONIA MATERIAL TYPE LED BIOCERAMICS MARKET IN 2022
    FIGURE 8 DENTAL APPLICATION SEGMENT DOMINATED BIOCERAMICS MARKET IN 2022
    FIGURE 9 NORTH AMERICA LED BIOCERAMICS MARKET IN 2022
 
4 PREMIUM INSIGHTS (Page No. - 50)
    4.1 ATTRACTIVE OPPORTUNITIES FOR PLAYERS IN BIOCERAMICS MARKET 
          FIGURE 10 SIGNIFICANT GROWTH EXPECTED IN BIOCERAMICS MARKET BETWEEN 2023 AND 2028
    4.2 BIOCERAMICS MARKET, BY APPLICATION AND REGION, 2022 
          FIGURE 11 DENTAL APPLICATION AND NORTH AMERICA LED MARKET IN 2022
    4.3 BIOCERAMICS MARKET, BY TYPE 
          FIGURE 12 BIO-ACTIVE BIOCERAMICS TYPE DOMINATED MARKET IN 2022
    4.4 BIOCERAMICS MARKET, BY FORM 
          FIGURE 13 POWDER FORM DOMINATED MARKET IN 2022
    4.5 BIOCERAMICS MARKET, BY MATERIAL TYPE 
          FIGURE 14 CALCIUM PHOSPHATE MATERIAL TYPE DOMINATED MARKET IN 2022
    4.6 BIOCERAMICS MARKET GROWTH, BY KEY COUNTRY 
          FIGURE 15 CHINA TO BE FASTEST-GROWING MARKET DURING FORECAST PERIOD
 
5 MARKET OVERVIEW (Page No. - 54)
    5.1 INTRODUCTION 
    5.2 MARKET DYNAMICS 
          FIGURE 16 DRIVERS, RESTRAINTS, OPPORTUNITIES, AND CHALLENGES IN BIOCERAMICS MARKET
           5.2.1 DRIVERS
                    5.2.1.1 Growing demand for implantable devices
                                TABLE 1 GERIATRIC POPULATION (MILLION), BY REGION, 2022 VS. 2050
                    5.2.1.2 Increasing demand for plastic surgeries and wound healing applications
                    5.2.1.3 Rising number of hip and knee replacement surgeries
                                FIGURE 17 TOTAL REPLACEMENT PROCEDURES PERFORMED IN US FROM 2012 TO 2022
           5.2.2 RESTRAINTS
                    5.2.2.1 Stringent clinical and regulatory processes
                    5.2.2.2 High manufacturing cost
           5.2.3 OPPORTUNITIES
                    5.2.3.1 Growing healthcare industry in emerging economies
                    5.2.3.2 3D printed ceramics
                    5.2.3.3 Gradual shift toward new materials and products
                    5.2.3.4 Growing research activities in nanoparticle applications
           5.2.4 CHALLENGES
                    5.2.4.1 Issues related to repairability and recyclability
                    5.2.4.2 Shortage of skilled surgeons and dental professionals
    5.3 PORTER'S FIVE FORCES 
          FIGURE 18 PORTER'S FIVE FORCES ANALYSIS
           5.3.1 THREAT OF NEW ENTRANTS
           5.3.2 THREAT OF SUBSTITUTES
           5.3.3 BARGAINING POWER OF BUYERS
           5.3.4 BARGAINING POWER OF SUPPLIERS
           5.3.5 INTENSITY OF COMPETITIVE RIVALRY
                    TABLE 2 BIOCERAMICS MARKET: PORTER'S FIVE FORCES ANALYSIS
    5.4 ECOSYSTEM MAPPING 
          FIGURE 19 ECOSYSTEM MAP/MARKET MAP
    5.5 PRICING ANALYSIS 
           5.5.1 AVERAGE SELLING PRICE, BY APPLICATION (KEY PLAYERS)
                    FIGURE 20 AVERAGE SELLING PRICE FOR TOP 3 APPLICATIONS (USD/KG)
           5.5.2 AVERAGE SELLING PRICE TREND, BY REGION
                    FIGURE 21 AVERAGE SELLING PRICE OF BIOCERAMICS, BY REGION, 2022
                    TABLE 3 AVERAGE SELLING PRICE OF BIOCERAMICS, BY REGION
           5.5.3 AVERAGE SELLING PRICE TREND, BY MATERIAL TYPE
                    FIGURE 22 AVERAGE SELLING PRICE OF BIOCERAMICS, BY MATERIAL TYPE, 2022
                    TABLE 4 AVERAGE SELLING PRICE OF BIOCERAMICS, BY MATERIAL TYPE
           5.5.4 AVERAGE SELLING PRICE TREND, BY FORM
                    FIGURE 23 AVERAGE SELLING PRICE OF BIOCERAMICS, BY FORM
                    TABLE 5 AVERAGE SELLING PRICE OF BIOCERAMICS, BY FORM
    5.6 VALUE CHAIN ANALYSIS 
          FIGURE 24 VALUE CHAIN ANALYSIS
    5.7 SUPPLY CHAIN ANALYSIS 
           5.7.1 RAW MATERIALS
                    FIGURE 25 LEADING BIOCERAMIC RAW MATERIAL MANUFACTURERS AND SUPPLIERS
           5.7.2 PRODUCT MANUFACTURERS
                    FIGURE 26 LEADING PRODUCT MANUFACTURERS
           5.7.3 END USERS
                    FIGURE 27 MAJOR END USERS OF BIOCERAMIC PRODUCTS
    5.8 TRADE ANALYSIS 
           5.8.1 TOP 25 EXPORTING COUNTRIES IN 2022
                    TABLE 6 TOP 25 EXPORTING COUNTRIES IN 2022
           5.8.2 TOP 25 IMPORTING COUNTRIES IN 2022
                    TABLE 7 TOP 25 IMPORTING COUNTRIES IN 2022
    5.9 TECHNOLOGY ANALYSIS 
    5.10 KEY STAKEHOLDERS AND BUYING CRITERIA 
           5.10.1 KEY STAKEHOLDERS IN BUYING PROCESS
                     FIGURE 28 INFLUENCE OF STAKEHOLDERS ON BUYING PROCESS FOR TOP THREE APPLICATIONS
                     TABLE 8 INFLUENCE OF STAKEHOLDERS ON BUYING PROCESS FOR TOP THREE APPLICATIONS
           5.10.2 BUYING CRITERIA
                     FIGURE 29 KEY BUYING CRITERIA FOR TOP THREE APPLICATIONS
                     TABLE 9 KEY BUYING CRITERIA FOR TOP THREE APPLICATIONS
    5.11 PATENT ANALYSIS 
           5.11.1 INTRODUCTION
           5.11.2 METHODOLOGY
           5.11.3 DOCUMENT TYPE
                     TABLE 10 GLOBAL PATENTS
                     FIGURE 30 GLOBAL PATENT ANALYSIS, BY DOCUMENT TYPE
                     FIGURE 31 GLOBAL PATENT PUBLICATION TREND ANALYSIS
           5.11.4 INSIGHTS
           5.11.5 LEGAL STATUS OF PATENTS
                     FIGURE 32 LEGAL STATUS OF PATENTS
           5.11.6 JURISDICTION ANALYSIS
                     FIGURE 33 GLOBAL JURISDICTION ANALYSIS
           5.11.7 TOP APPLICANTS' ANALYSIS
                     FIGURE 34 MULTIPLE ENERGY TECH LLC HAS HIGHEST NUMBER OF PATENTS
           5.11.8 PATENTS BY MULTIPLE ENERGY TECH LLC
           5.11.9 PATENTS BY ABBOTT CARDIOVASCULAR SYSTEMS
                    5.11.10 PATENTS BY DSM IP ASSETS BV
                    5.11.11 TOP 10 PATENT OWNERS (US) IN LAST 10 YEARS
    5.12 REGULATORY LANDSCAPE 
           5.12.1 REGULATIONS IN BIOCERAMICS MARKET
           5.12.2 REGULATORY BODIES, GOVERNMENT AGENCIES, AND OTHER ORGANIZATIONS
                     TABLE 11 NORTH AMERICA: REGULATORY BODIES, GOVERNMENT AGENCIES, AND OTHER ORGANIZATIONS
                     TABLE 12 EUROPE: REGULATORY BODIES, GOVERNMENT AGENCIES, AND OTHER ORGANIZATIONS
                     TABLE 13 ASIA PACIFIC: REGULATORY BODIES, GOVERNMENT AGENCIES, AND OTHER ORGANIZATIONS
                     TABLE 14 REST OF THE WORLD: REGULATORY BODIES, GOVERNMENT AGENCIES,  AND OTHER ORGANIZATIONS
    5.13 KEY CONFERENCES AND EVENTS 2024–2025 
           TABLE 15 DETAILED LIST OF CONFERENCES AND EVENTS 2024–2025
    5.14 CASE STUDY ANALYSIS 
    5.15 TRENDS AND DISRUPTIONS IMPACTING CUSTOMER BUSINESS 
           FIGURE 35 REVENUE SHIFT OF BIOCERAMICS MARKET
    5.16 INVESTMENT AND FUNDING SCENARIO 
           FIGURE 36 INVESTMENT AND FUNDING SCENARIO
           FIGURE 37 LEADING BIOCERAMICS MANUFACTURERS IN 2024 (USD BILLION)
 
6 BIOCERAMICS MARKET, BY FORM (Page No. - 84)
    6.1 INTRODUCTION 
          TABLE 16 BIOCERAMICS MARKET, BY FORM, 2021–2028 (USD MILLION)
          TABLE 17 BIOCERAMICS MARKET, BY FORM, 2021–2028 (KILOTON)
    6.2 POWDER 
           6.2.1 WIDE USAGE IN AUTOMOTIVE OEMS TO DRIVE MARKET
                    TABLE 18 POWDER-BASED BIOCERAMICS MARKET, BY REGION, 2021–2028 (USD MILLION)
                    TABLE 19 POWDER-BASED BIOCERAMICS MARKET, BY REGION, 2021–2028 (KILOTON)
    6.3 LIQUID 
           6.3.1 DELIVERY TO SPECIFIC INTENDED LOCATION IN BODY TO DRIVE DEMAND
                    TABLE 20 LIQUID-BASED BIOCERAMICS MARKET, BY REGION, 2021–2028 (USD MILLION)
                    TABLE 21 LIQUID-BASED BIOCERAMICS MARKET, BY REGION, 2021–2028 (KILOTON)
 
7 BIOCERAMICS MARKET, BY TYPE (Page No. - 89)
    7.1 INTRODUCTION 
          TABLE 22 BIOCERAMICS MARKET, BY TYPE, 2021–2028 (USD MILLION)
          TABLE 23 BIOCERAMICS MARKET, BY TYPE, 2021–2028 (KILOTON)
    7.2 BIO-INERT 
           7.2.1 INCREASING USAGE IN ORTHOPEDIC AND DENTAL SURGERIES TO DRIVE MARKET
                    TABLE 24 BIO-INERT BIOCERAMICS MARKET, BY REGION, 2021–2028 (USD MILLION)
                    TABLE 25 BIO-INERT BIOCERAMICS MARKET, BY REGION, 2021–2028 (KILOTON)
           7.2.2 ZIRCONIA
           7.2.3 ALUMINUM OXIDE
           7.2.4 CARBON
           7.2.5 SILICON NITRIDE
    7.3 BIO-ACTIVE 
           7.3.1 OSTEOCONDUCTIVE PROPERTIES OF BIO-ACTIVE CERAMICS TO DRIVE MARKET
                    TABLE 26 BIO-ACTIVE BIOCERAMICS MARKET, BY REGION, 2021–2028 (USD MILLION)
                    TABLE 27 BIO-ACTIVE BIOCERAMICS MARKET, BY REGION, 2021–2028 (KILOTON)
           7.3.2 HYDROXYAPATITE
           7.3.3 BIO-ACTIVE GLASS
           7.3.4 OTHER BIO-ACTIVE BIOCERAMICS
    7.4 BIO-RESORBABLE 
           7.4.1 INCREASING PLASTIC SURGERY AND BODY TISSUE REGENERATION SURGERIES TO DRIVE MARKET
                    TABLE 28 BIO-RESORBABLE BIOCERAMICS MARKET, BY REGION, 2021–2028 (USD MILLION)
                    TABLE 29 BIO-RESORBABLE BIOCERAMICS MARKET, BY REGION, 2021–2028 (KILOTON)
           7.4.2 TRICALCIUM PHOSPHATE
           7.4.3 CALCIUM SULFATE
           7.4.4 OTHER BIO-RESORBABLE BIOCERAMICS
 
8 BIOCERAMICS MARKET, BY MATERIAL TYPE (Page No. - 98)
    8.1 INTRODUCTION 
          TABLE 30 BIOCERAMICS MARKET, BY MATERIAL TYPE, 2021–2028 (USD MILLION)
          TABLE 31 BIOCERAMICS MARKET, BY MATERIAL TYPE, 2021–2028 (KILOTON)
    8.2 ALUMINUM OXIDE 
           8.2.1 GROWING NUMBER OF ORTHOPEDIC IMPLANTS AND DENTAL RESTORATIONS TO DRIVE DEMAND
                    TABLE 32 ALUMINUM OXIDE BIOCERAMICS MARKET, BY REGION, 2021–2028 (USD MILLION)
                    TABLE 33 ALUMINUM OXIDE BIOCERAMICS MARKET, BY REGION, 2021–2028 (KILOTON)
    8.3 ZIRCONIA 
           8.3.1 HIGH PRODUCT LIFESPAN AND LOW MAINTENANCE TO DRIVE GROWTH
                    TABLE 34 ZIRCONIA BIOCERAMICS MARKET, BY REGION, 2021–2028 (USD MILLION)
                    TABLE 35 ZIRCONIA BIOCERAMICS MARKET, BY REGION, 2021–2028 (KILOTON)
    8.4 CALCIUM PHOSPHATE 
           8.4.1 WIDELY USED IN HYDROXYAPATITE AND TRICALCIUM PHOSPHATE FORMS
                    TABLE 36 CALCIUM PHOSPHATE BIOCERAMICS MARKET, BY REGION, 2021–2028 (USD MILLION)
                    TABLE 37 CALCIUM PHOSPHATE BIOCERAMICS MARKET, BY REGION, 2021–2028 (KILOTON)
    8.5 CALCIUM SULFATE 
           8.5.1 POTENTIAL FOR TREATMENT OF MUSCULOSKELETAL DISORDERS TO DRIVE MARKET
                    TABLE 38 CALCIUM SULFATE BIOCERAMICS MARKET, BY REGION, 2021–2028 (USD MILLION)
                    TABLE 39 CALCIUM SULFATE BIOCERAMICS MARKET, BY REGION, 2021–2028 (KILOTON)
    8.6 BIO-ACTIVE GLASS 
           8.6.1 HIGH STRENGTH FOR DENTAL AND ORTHOPEDIC IMPLANTS TO DRIVE MARKET
                    TABLE 40 BIO-ACTIVE GLASS-BASED BIOCERAMICS MARKET, BY REGION, 2021–2028 (USD MILLION)
                    TABLE 41 BIO-ACTIVE GLASS-BASED BIOCERAMICS MARKET, BY REGION, 2021–2028 (KILOTON)
    8.7 OTHER MATERIAL TYPES 
          TABLE 42 OTHER MATERIALS-BASED BIOCERAMICS MARKET, BY REGION, 2021–2028 (USD MILLION)
          TABLE 43 OTHER MATERIALS-BASED BIOCERAMICS MARKET, BY REGION, 2021–2028 (KILOTON)
 
9 BIOCERAMICS MARKET, BY APPLICATION (Page No. - 108)
    9.1 INTRODUCTION 
          TABLE 44 BIOCERAMICS MARKET, BY APPLICATION, 2021–2028 (USD MILLION)
          TABLE 45 BIOCERAMICS MARKET, BY APPLICATION, 2021–2028 (KILOTON)
    9.2 DENTAL 
           9.2.1 HIGH MECHANICAL STRENGTH, EXCELLENT BIOCOMPATIBILITY, TRIBOLOGICAL PROPERTIES, AND DIMENSIONAL STABILITY TO DRIVE MARKET
                    TABLE 46 BIOCERAMICS MARKET IN DENTAL APPLICATION, BY REGION,  2021–2028 (USD MILLION)
                    TABLE 47 BIOCERAMICS MARKET IN DENTAL APPLICATION, BY REGION, 2021–2028 (KILOTON)
    9.3 ORTHOPEDICS 
           9.3.1 INCREASING OSTEOARTHRITIS DISEASE AMONG GERIATRIC PEOPLE TO DRIVE MARKET
                    TABLE 48 BIOCERAMICS MARKET IN ORTHOPEDIC APPLICATION, BY REGION,  2021–2028 (USD MILLION)
                    TABLE 49 BIOCERAMICS MARKET IN ORTHOPEDIC APPLICATION, BY REGION,  2021–2028 (KILOTON)
    9.4 BIO-MEDICAL 
           9.4.1 INCREASING INVASIVE SURGERIES AND USAGE OF BIOCERAMICS IN DRUG DELIVERY TO DRIVE MARKET
                    TABLE 50 BIOCERAMICS MARKET IN BIOMEDICAL APPLICATION, BY REGION,  2021–2028 (USD MILLION)
                    TABLE 51 BIOCERAMICS MARKET IN BIOMEDICAL APPLICATION, BY REGION,  2021–2028 (KILOTON)
 
10 BIOCERAMICS MARKET, BY REGION (Page No. - 115)
     10.1 INTRODUCTION 
            FIGURE 42 CHINA TO BE FASTEST-GROWING BIOCERAMICS MARKET DURING FORECAST PERIOD
            TABLE 52 BIOCERAMICS MARKET, BY REGION, 2021–2028 (USD MILLION)
            TABLE 53 BIOCERAMICS MARKET, BY REGION, 2021–2028 (KILOTON)
     10.2 NORTH AMERICA 
             10.2.1 IMPACT OF RECESSION ON NORTH AMERICA
                        FIGURE 43 NORTH AMERICA: BIOCERAMICS MARKET SNAPSHOT
                        TABLE 54 NORTH AMERICA: BIOCERAMICS MARKET, BY TYPE, 2021–2028 (USD MILLION)
                        TABLE 55 NORTH AMERICA: BIOCERAMICS MARKET, BY TYPE, 2021–2028 (KILOTON)
                        TABLE 56 NORTH AMERICA: BIOCERAMICS MARKET, BY FORM, 2021–2028 (USD MILLION)
                        TABLE 57 NORTH AMERICA: BIOCERAMICS MARKET, BY FORM, 2021–2028 (KILOTON)
                        TABLE 58 NORTH AMERICA: BIOCERAMICS MARKET, BY MATERIAL TYPE,  2021–2028 (USD MILLION)
                        TABLE 59 NORTH AMERICA: BIOCERAMICS MARKET, BY MATERIAL TYPE, 2021–2028 (KILOTON)
                        TABLE 60 NORTH AMERICA: BIOCERAMICS MARKET, BY APPLICATION, 2021–2028 (USD MILLION)
                        TABLE 61 NORTH AMERICA: BIOCERAMICS MARKET, BY APPLICATION, 2021–2028 (KILOTON)
                        TABLE 62 NORTH AMERICA: BIOCERAMICS MARKET, BY COUNTRY, 2021–2028 (USD MILLION)
                        TABLE 63 NORTH AMERICA: BIOCERAMICS MARKET, BY COUNTRY, 2021–2028 (KILOTON)
             10.2.2 US
                        10.2.2.1 Superior performance & persistent characteristics and growing medical & biomedical industries to drive market
                                      TABLE 64 US: BIOCERAMICS MARKET, BY APPLICATION, 2021–2028 (USD MILLION)
                                      TABLE 65 US: BIOCERAMICS MARKET, BY APPLICATION, 2021–2028 (KILOTON)
             10.2.3 CANADA
                        10.2.3.1 Strong growth of medical device industry to drive market
                                      TABLE 66 CANADA: BIOCERAMICS MARKET, BY APPLICATION, 2021–2028 (USD MILLION)
                                      TABLE 67 CANADA: BIOCERAMICS MARKET, BY APPLICATION, 2021–2028 (KILOTON)
     10.3 EUROPE 
             10.3.1 IMPACT OF RECESSION ON EUROPE
                        FIGURE 44 EUROPE: BIOCERAMICS MARKET SNAPSHOT
                        TABLE 68 EUROPE: BIOCERAMICS MARKET, BY TYPE, 2021–2028 (USD MILLION)
                        TABLE 69 EUROPE: BIOCERAMICS MARKET, BY TYPE, 2021–2028 (KILOTON)
                        TABLE 70 EUROPE: BIOCERAMICS MARKET, BY FORM, 2021–2028 (USD MILLION)
                        TABLE 71 EUROPE: BIOCERAMICS MARKET, BY FORM, 2021–2028 (KILOTON)
                        TABLE 72 EUROPE: BIOCERAMICS MARKET, BY MATERIAL TYPE, 2021–2028 (USD MILLION)
                        TABLE 73 EUROPE: BIOCERAMICS MARKET, BY MATERIAL TYPE, 2021–2028 (KILOTON)
                        TABLE 74 EUROPE: BIOCERAMICS MARKET, BY APPLICATION, 2021–2028 (USD MILLION)
                        TABLE 75 EUROPE: BIOCERAMICS MARKET, BY APPLICATION, 2021–2028 (KILOTON)
                        TABLE 76 EUROPE: BIOCERAMICS MARKET, BY COUNTRY, 2021–2028 (USD MILLION)
                        TABLE 77 EUROPE: BIOCERAMICS MARKET, BY COUNTRY, 2021–2028 (KILOTON)
             10.3.2 FRANCE
                        10.3.2.1 Rising life expectancy to drive market
                                      TABLE 78 FRANCE: BIOCERAMICS MARKET, BY APPLICATION, 2021–2028 (USD MILLION)
                                      TABLE 79 FRANCE: BIOCERAMICS MARKET, BY APPLICATION, 2021–2028 (KILOTON)
             10.3.3 GERMANY
                        10.3.3.1 Increasing knee replacement surgeries to drive market
                                      TABLE 80 GERMANY: BIOCERAMICS MARKET, BY APPLICATION, 2021–2028 (USD MILLION)
                                      TABLE 81 GERMANY: BIOCERAMICS MARKET, BY APPLICATION, 2021–2028 (KILOTON)
             10.3.4 UK
                        10.3.4.1 Government support for research and development to drive market
                                      TABLE 82 UK: BIOCERAMICS MARKET, BY APPLICATION, 2021–2028 (USD MILLION)
                                      TABLE 83 UK: BIOCERAMICS MARKET, BY APPLICATION, 2021–2028 (KILOTON)
             10.3.5 ITALY
                        10.3.5.1 Demand for orthopedic and surgical implants to drive market
                                      TABLE 84 ITALY: BIOCERAMICS MARKET, BY APPLICATION, 2021–2028 (USD MILLION)
                                      TABLE 85 ITALY: BIOCERAMICS MARKET, BY APPLICATION, 2021–2028 (KILOTON)
             10.3.6 SPAIN
                        10.3.6.1 Research and development in new bio-active nanocomposites and ceramic materials to drive market
                                      TABLE 86 SPAIN: BIOCERAMICS MARKET, BY APPLICATION, 2021–2028 (USD MILLION)
                                      TABLE 87 SPAIN: BIOCERAMICS MARKET, BY APPLICATION, 2021–2028 (KILOTON)
             10.3.7 REST OF EUROPE
                        TABLE 88 REST OF EUROPE: BIOCERAMICS MARKET, BY APPLICATION, 2021–2028 (USD MILLION)
                        TABLE 89 REST OF EUROPE: BIOCERAMICS MARKET, BY APPLICATION, 2021–2028 (KILOTON)
     10.4 ASIA PACIFIC 
             10.4.1 IMPACT OF RECESSION ON ASIA PACIFIC
                        FIGURE 45 ASIA PACIFIC: BIOCERAMICS MARKET SNAPSHOT
                        TABLE 90 ASIA PACIFIC: BIOCERAMICS MARKET, BY TYPE, 2021–2028 (USD MILLION)
                        TABLE 91 ASIA PACIFIC: BIOCERAMICS MARKET, BY TYPE, 2021–2028 (KILOTON)
                        TABLE 92 ASIA PACIFIC: BIOCERAMICS MARKET, BY FORM, 2021–2028 (USD MILLION)
                        TABLE 93 ASIA PACIFIC: BIOCERAMICS MARKET, BY FORM, 2021–2028 (KILOTON)
                        TABLE 94 ASIA PACIFIC: BIOCERAMICS MARKET, BY MATERIAL TYPE, 2021–2028 (USD MILLION)
                        TABLE 95 ASIA PACIFIC: BIOCERAMICS MARKET, BY MATERIAL TYPE, 2021–2028 (KILOTON)
                        TABLE 96 ASIA PACIFIC: BIOCERAMICS MARKET, BY APPLICATION, 2021–2028 (USD MILLION)
                        TABLE 97 ASIA PACIFIC: BIOCERAMICS MARKET, BY APPLICATION, 2021–2028 (KILOTON)
                        TABLE 98 ASIA PACIFIC: BIOCERAMICS MARKET, BY COUNTRY, 2021–2028 (USD MILLION)
                        TABLE 99 ASIA PACIFIC: BIOCERAMICS MARKET, BY COUNTRY, 2021–2028 (KILOTON)
             10.4.2 CHINA
                        10.4.2.1 Growing aging population and increased government investments in medical infrastructure to drive market
                                      TABLE 100 CHINA: BIOCERAMICS MARKET, BY APPLICATION, 2021–2028 (USD MILLION)
                                      TABLE 101 CHINA: BIOCERAMICS MARKET, BY APPLICATION, 2021–2028 (KILOTON)
             10.4.3 JAPAN
                        10.4.3.1 Growing medical equipment and healthcare-related services to drive market
                                      TABLE 102 JAPAN: BIOCERAMICS MARKET, BY APPLICATION, 2021–2028 (USD MILLION)
                                      TABLE 103 JAPAN: BIOCERAMICS MARKET, BY APPLICATION, 2021–2028 (KILOTON)
             10.4.4 INDIA
                        10.4.4.1 Increasing prevalence of chronic ailments due to changing lifestyles to drive market
                                      TABLE 104 INDIA: BIOCERAMICS MARKET, BY APPLICATION, 2021–2028 (USD MILLION)
                                      TABLE 105 INDIA: BIOCERAMICS MARKET, BY APPLICATION, 2021–2028 (KILOTON)
             10.4.5 SOUTH KOREA
                        10.4.5.1 Government investments in research and development of medical devices to drive market
                                      TABLE 106 SOUTH KOREA: BIOCERAMICS MARKET, BY APPLICATION, 2021–2028 (USD MILLION)
                                      TABLE 107 SOUTH KOREA: BIOCERAMICS MARKET, BY APPLICATION, 2021–2028 (KILOTON)
             10.4.6 AUSTRALIA-NEW ZEALAND
                        10.4.6.1 Significant healthcare sector to drive market
                                      TABLE 108 AUSTRALIA-NEW ZEALAND: BIOCERAMICS MARKET, BY APPLICATION,  2021–2028 (USD MILLION)
                                      TABLE 109 AUSTRALIA -NEW ZEALAND: BIOCERAMICS MARKET, BY APPLICATION,  2021–2028 (KILOTON)
             10.4.7 REST OF ASIA PACIFIC
                        TABLE 110 REST OF ASIA PACIFIC: BIOCERAMICS MARKET, BY APPLICATION,  2021–2028 (USD MILLION)
                        TABLE 111 REST OF ASIA PACIFIC: BIOCERAMICS MARKET, BY APPLICATION, 2021–2028 (KILOTON)
     10.5 LATIN AMERICA 
             10.5.1 IMPACT OF RECESSION ON LATIN AMERICA
                        TABLE 112 LATIN AMERICA: BIOCERAMICS MARKET, BY TYPE, 2021–2028 (USD MILLION)
                        TABLE 113 LATIN AMERICA: BIOCERAMICS MARKET, BY TYPE, 2021–2028 (KILOTON)
                        TABLE 114 LATIN AMERICA: BIOCERAMICS MARKET, BY FORM, 2021–2028 (USD MILLION)
                        TABLE 115 LATIN AMERICA: BIOCERAMICS MARKET, BY FORM, 2021–2028 (KILOTON)
                        TABLE 116 LATIN AMERICA: BIOCERAMICS MARKET, BY MATERIAL TYPE, 2021–2028 (USD MILLION)
                        TABLE 117 LATIN AMERICA: BIOCERAMICS MARKET, BY MATERIAL TYPE, 2021–2028 (KILOTON)
                        TABLE 118 LATIN AMERICA: BIOCERAMICS MARKET, BY APPLICATION, 2021–2028 (USD MILLION)
                        TABLE 119 LATIN AMERICA: BIOCERAMICS MARKET, BY APPLICATION, 2021–2028 (KILOTON)
                        TABLE 120 LATIN AMERICA: BIOCERAMICS MARKET, BY COUNTRY, 2021–2028 (USD MILLION)
                        TABLE 121 LATIN AMERICA: BIOCERAMICS MARKET, BY COUNTRY, 2021–2028 (KILOTON)
             10.5.2 BRAZIL
                        10.5.2.1 Growing healthcare industry to drive market
                                      TABLE 122 BRAZIL: BIOCERAMICS MARKET, BY APPLICATION, 2021–2028 (USD MILLION)
                                      TABLE 123 BRAZIL: BIOCERAMICS MARKET, BY APPLICATION, 2021–2028 (KILOTON)
             10.5.3 MEXICO
                        10.5.3.1 Improvements in laws and initiatives by government to drive market
                                      TABLE 124 MEXICO: BIOCERAMICS MARKET, BY APPLICATION, 2021–2028 (USD MILLION)
                                      TABLE 125 MEXICO: BIOCERAMICS MARKET, BY APPLICATION, 2021–2028 (KILOTON)
             10.5.4 REST OF LATIN AMERICA
                        TABLE 126 REST OF LATIN AMERICA: BIOCERAMICS MARKET, BY APPLICATION,  2021–2028 (USD MILLION)
                        TABLE 127 REST OF LATIN AMERICA: BIOCERAMICS MARKET, BY APPLICATION,  2021–2028 (KILOTON)
     10.6 MIDDLE EAST & AFRICA 
             10.6.1 IMPACT OF RECESSION ON MIDDLE EAST & AFRICA
                        TABLE 128 MIDDLE EAST & AFRICA: BIOCERAMICS MARKET, BY TYPE, 2021–2028 (USD MILLION)
                        TABLE 129 MIDDLE EAST & AFRICA: BIOCERAMICS MARKET, BY TYPE, 2021–2028 (KILOTON)
                        TABLE 130 MIDDLE EAST & AFRICA: BIOCERAMICS MARKET, BY FORM, 2021–2028 (USD MILLION)
                        TABLE 131 MIDDLE EAST & AFRICA: BIOCERAMICS MARKET, BY FORM, 2021–2028 (KILOTON)
                        TABLE 132 MIDDLE EAST & AFRICA: BIOCERAMICS MARKET, BY MATERIAL TYPE,  2021–2028 (USD MILLION)
                        TABLE 133 MIDDLE EAST & AFRICA: BIOCERAMICS MARKET, BY MATERIAL TYPE,  2021–2028 (KILOTON)
                        TABLE 134 MIDDLE EAST & AFRICA: BIOCERAMICS MARKET, BY APPLICATION,  2021–2028 (USD MILLION)
                        TABLE 135 MIDDLE EAST & AFRICA: BIOCERAMICS MARKET, BY APPLICATION,  2021–2028 (KILOTON)
                        TABLE 136 MIDDLE EAST & AFRICA: BIOCERAMICS MARKET, BY COUNTRY,  2021–2028 (USD MILLION)
                        TABLE 137 MIDDLE EAST & AFRICA: BIOCERAMICS MARKET, BY COUNTRY, 2021–2028 (KILOTON)
             10.6.2 GCC COUNTRIES
                        10.6.2.1 UAE
                                     10.6.2.1.1 Thriving medical tourism industry and growing aging population to drive market
                                                     TABLE 138 UAE: BIOCERAMICS MARKET, BY APPLICATION, 2021–2028 (USD MILLION)
                                                     TABLE 139 UAE: BIOCERAMICS MARKET, BY APPLICATION, 2021–2028 (KILOTON)
                        10.6.2.2 Saudi Arabia
                                     10.6.2.2.1 Strong growth of medical device industry to drive market
                                                     TABLE 140 SAUDI ARABIA: BIOCERAMICS MARKET, BY APPLICATION, 2021–2028 (USD MILLION)
                                                     TABLE 141 SAUDI ARABIA: BIOCERAMICS MARKET, BY APPLICATION, 2021–2028 (KILOTON)
                        10.6.2.3 Rest of GCC countries
                                     10.6.2.3.1 Increase in number of dental surgeries to drive market
                                                     TABLE 142 REST OF GCC COUNTRIES: BIOCERAMICS MARKET, BY APPLICATION,  2021–2028 (USD MILLION)
                                                     TABLE 143 REST OF GCC COUNTRIES: BIOCERAMICS MARKET, BY APPLICATION,  2021–2028 (KILOTON)
             10.6.3 SOUTH AFRICA
                        10.6.3.1 Rising awareness about oral health and adoption of new technologies to drive market
                                      TABLE 144 SOUTH AFRICA: BIOCERAMICS MARKET, BY APPLICATION, 2021–2028 (USD MILLION)
                                      TABLE 145 SOUTH AFRICA: BIOCERAMICS MARKET, BY APPLICATION, 2021–2028 (KILOTON)
             10.6.4 REST OF MIDDLE EAST & AFRICA
                        TABLE 146 REST OF MIDDLE EAST & AFRICA: BIOCERAMICS MARKET, BY APPLICATION,  2021–2028 (USD MILLION)
                        TABLE 147 REST OF MIDDLE EAST & AFRICA: BIOCERAMICS MARKET, BY APPLICATION,  2021–2028 (KILOTON)
 
11 COMPETITIVE LANDSCAPE (Page No. - 160)
     11.1 INTRODUCTION 
     11.2 KEY PLAYER STRATEGIES/RIGHT TO WIN, 2022 
             11.2.1 OVERVIEW OF STRATEGIES ADOPTED BY BIOCERAMIC MANUFACTURERS
     11.3 REVENUE ANALYSIS 
            FIGURE 46 REVENUE ANALYSIS OF TOP 5 MARKET PLAYERS
     11.4 MARKET SHARE ANALYSIS 
            FIGURE 47 SHARE OF TOP COMPANIES IN BIOCERAMICS MARKET
            TABLE 148 DEGREE OF COMPETITION
     11.5 COMPANY EVALUATION MATRIX 
             11.5.1 STARS
             11.5.2 EMERGING LEADERS
             11.5.3 PERVASIVE PLAYERS
             11.5.4 PARTICIPANTS
                        FIGURE 48 COMPANY EVALUATION MATRIX
             11.5.5 COMPANY FOOTPRINT
                        FIGURE 49 COMPANY PRODUCT FOOTPRINT
                        TABLE 149 COMPANY TYPE FOOTPRINT
                        TABLE 150 COMPANY FORM FOOTPRINT
     11.6 STARTUP/SME EVALUATION MATRIX 
             11.6.1 PROGRESSIVE COMPANIES
             11.6.2 RESPONSIVE COMPANIES
             11.6.3 DYNAMIC COMPANIES
             11.6.4 STARTING BLOCKS
                        FIGURE 50 SMALL AND MEDIUM-SIZED ENTERPRISES MAPPING, 2022
             11.6.5 COMPETITIVE BENCHMARKING, 2022
                        TABLE 154 COMPETITIVE BENCHMARKING OF KEY STARTUPS/SMES
     11.7 BRAND/PRODUCT COMPARATIVE ANALYSIS 
     11.8 VALUATION AND FINANCIAL METRICS OF MANUFACTURERS OF BIOCERAMICS 
             FIGURE 53 YEAR TO DATE (YTD) PRICE TOTAL RETURN AND 5-YEAR STOCK BETA OF KEY MANUFACTURERS
     11.9 COMPETITIVE SCENARIO AND TRENDS 
             11.9.1 PRODUCT LAUNCHES, 2018–2023
                        TABLE 155 PRODUCT LAUNCHES/DEVELOPMENTS, 2018–2023
             11.9.2 DEALS, 2018–2023
             11.9.3 OTHER DEVELOPMENTS, 2018–2023
 
12 COMPANY PROFILES (Page No. - 178)
(Business overview, Products/Services/Solutions offered, Recent Developments, MNM view)*
     12.1 KEY COMPANIES 
             12.1.1 COORSTEK, INC.
                        TABLE 156 COORSTEK, INC.: COMPANY OVERVIEW
                        TABLE 157 COORSTEK, INC.: PRODUCTS/SOLUTIONS/SERVICES OFFERED
                        TABLE 158 COORSTEK, INC.: OTHER DEVELOPMENTS
             12.1.2 KYOCERA CORPORATION
                        TABLE 159 KYOCERA CORPORATION: COMPANY OVERVIEW
                        FIGURE 54 KYOCERA CORPORATION: COMPANY SNAPSHOT
                        TABLE 160 KYOCERA CORPORATION: PRODUCTS/SOLUTIONS/SERVICES OFFERED
                        TABLE 161 KYOCERA CORPORATION: DEALS
             12.1.3 MORGAN ADVANCED MATERIALS PLC
                        TABLE 162 MORGAN ADVANCED MATERIALS PLC: COMPANY OVERVIEW
                        FIGURE 55 MORGAN ADVANCED MATERIALS PLC: COMPANY SNAPSHOT
                        TABLE 163 MORGAN ADVANCED MATERIALS PLC: PRODUCTS/SOLUTIONS/SERVICES OFFERED
             12.1.4 CERAMTEC GMBH
                        TABLE 164 CERAMTEC GMBH: COMPANY OVERVIEW
                        TABLE 165 CERAMTEC GMBH: PRODUCTS/SOLUTIONS/SERVICES OFFERED
                        TABLE 166 CERAMTEC GMBH: PRODUCT LAUNCHES
                        TABLE 167 CERAMTEC GMBH: DEALS
             12.1.5 TOSOH CERAMICS CO., LTD.
                        TABLE 168 TOSOH CERAMICS CO., LTD.: COMPANY OVERVIEW
                        TABLE 169 TOSOH CERAMICS CO., LTD.: PRODUCTS/SOLUTIONS/SERVICES OFFERED
                        TABLE 170 TOSOH CERAMICS CO., LTD.: PRODUCT LAUNCHES
             12.1.6 INSTITUT STRAUMANN AG
                        TABLE 171 INSTITUT STRAUMANN AG: COMPANY OVERVIEW
                        FIGURE 57 INSTITUT STRAUMANN AG: COMPANY SNAPSHOT
                        TABLE 172 INSTITUT STRAUMANN AG: PRODUCTS/SOLUTIONS/SERVICES OFFERED
                        TABLE 173 INSTITUT STRAUMANN AG: DEALS
                        TABLE 174 INSTITUT STRAUMANN AG: OTHER DEVELOPMENTS
             12.1.7 BERKELEY ADVANCED BIOMATERIALS INC.
                        TABLE 175 BERKELEY ADVANCED BIOMATERIALS INC.: COMPANY OVERVIEW
                        TABLE 176 BERKELEY ADVANCED BIOMATERIALS INC.: PRODUCTS/SOLUTIONS/SERVICES OFFERED
             12.1.8 DSM
                        TABLE 177 DSM: COMPANY OVERVIEW
                        FIGURE 58 DSM: COMPANY SNAPSHOT
                        TABLE 178 DSM: PRODUCTS/SOLUTIONS/SERVICES OFFERED
             12.1.9 CTL AMEDICA
                        TABLE 179 CTL AMEDICA: COMPANY OVERVIEW
                        TABLE 180 CTL AMEDICA: PRODUCTS/SOLUTIONS/SERVICES OFFERED
             12.1.10 3M
                        TABLE 181 3M: COMPANY OVERVIEW
                        FIGURE 59 3M: COMPANY SNAPSHOT
                        TABLE 182 3M: PRODUCTS/SOLUTIONS/SERVICES OFFERED
                        TABLE 183 3M: OTHER DEVELOPMENTS
             12.1.11 SUPERIOR TECHNICAL CERAMICS
                        TABLE 184 SUPERIOR TECHNICAL CERAMICS: COMPANY OVERVIEW
                        TABLE 185 SUPERIOR TECHNICAL CERAMICS: PRODUCTS/SOLUTIONS/SERVICES OFFERED
             12.1.12 NITERRA INDIA PVT. LTD.
                        TABLE 186 NITERRA INDIA PVT. LTD.: COMPANY OVERVIEW
                        FIGURE 60 NITERRA INDIA PVT. LTD.: COMPANY SNAPSHOT
                        TABLE 187 NITERRA INDIA PVT. LTD.: PRODUCTS/SOLUTIONS/SERVICES OFFERED
             12.1.13 BONESUPPORT AB
                        TABLE 188 BONESUPPORT AB: COMPANY OVERVIEW
                        FIGURE 61 BONESUPPORT AB: COMPANY SNAPSHOT
                        TABLE 189 BONESUPPORT AB: PRODUCTS/SOLUTIONS/SERVICES OFFERED
             12.1.14 SMITH+NEPHEW
                        TABLE 190 SMITH+NEPHEW: COMPANY OVERVIEW
                        FIGURE 62 SMITH+NEPHEW: COMPANY SNAPSHOT
                        TABLE 191 SMITH+NEPHEW: PRODUCTS/SOLUTIONS/SERVICES OFFERED
                        TABLE 192 SMITH+NEPHEW: PRODUCT LAUNCHES
                        TABLE 193 SMITH+NEPHEW: OTHER DEVELOPMENTS
             12.1.15 DENTSPLY SIRONA INC.
                        TABLE 194 DENTSPLY SIRONA INC.: COMPANY OVERVIEW
                        FIGURE 63 DENTSPLY SIRONA INC.: COMPANY SNAPSHOT
                        TABLE 195 DENTSPLY SIRONA INC.: PRODUCTS/SOLUTIONS/SERVICES OFFERED
                        TABLE 196 DENTSPLY SIRONA INC.: DEALS
     12.2 OTHER COMPANIES 
             12.2.1 CAM BIOCERAMICS B.V.
                        TABLE 197 CAM BIOCERAMICS B.V.: COMPANY OVERVIEW
             12.2.2 PAUL RAUSCHERT GMBH & CO. KG.
                        TABLE 198 PAUL RAUSCHERT GMBH & CO. KG.: COMPANY OVERVIEW
             12.2.3 H.C. STARCK GMBH
                        TABLE 199 H.C. STARCK GMBH: COMPANY OVERVIEW
             12.2.4 NOBEL BIOCARE SERVICES AG
                        TABLE 200 NOBEL BIOCARE SERVICES AG: COMPANY OVERVIEW
             12.2.5 MERZ NORTH AMERICA, INC.
                        TABLE 201 MERZ NORTH AMERICA, INC.: COMPANY OVERVIEW
             12.2.6 CUMI
                        TABLE 202 CUMI: COMPANY OVERVIEW
             12.2.7 SAGEMAX BIOCERAMICS, INC.
                        TABLE 203 SAGEMAX BIOCERAMICS, INC.: COMPANY OVERVIEW
             12.2.8 DENTAL DIREKT GMBH
                        TABLE 204 DENTAL DIREKT GMBH: COMPANY OVERVIEW
             12.2.9 FKG DENTAIRE
                        TABLE 205 FKG DENTAIRE: COMPANY OVERVIEW
             12.2.10 COLLAGEN MATRIX (REGENITY)
                        TABLE 206 COLLAGEN MATRIX (REGENITY): COMPANY OVERVIEW
 
*Details on Business overview, Products/Services/Solutions offered, Recent Developments, MNM view might not be captured in case of unlisted companies.
 
13 APPENDIX (Page No. - 227)
     13.1 DISCUSSION GUIDE 
     13.2 KNOWLEDGESTORE: MARKETSANDMARKETS’  SUBSCRIPTION PORTAL 
     13.3 CUSTOMIZATION OPTIONS 
     13.4 RELATED REPORTS 
     13.5 AUTHOR DETAILS 

The study involves two major activities in estimating the current market size for the bioceramics market. Exhaustive secondary research was done to collect information on the market, peer market, and parent market. The next step was to validate these findings, assumptions, and sizing with industry experts across the value chain through primary research. Both top-down and bottom-up approaches were employed to estimate the complete market size. After that, market breakdown and data triangulation were used to estimate the market size of segments and subsegments.

Secondary Research

Secondary sources referred to for this research study include financial statements of companies offering bioceramic products and information from various trade, business, and professional associations. Secondary research has been used to obtain critical information about the industry’s value chain, the total pool of key players, market classification, and segmentation according to industry trends to the bottom-most level and regional markets. The secondary data was collected and analyzed to arrive at the overall size of the bioceramic market, which was validated by primary respondents.

Primary Research

Extensive primary research was conducted after obtaining information regarding the bioceramics market scenario through secondary research. Several primary interviews were conducted with market experts from both the demand and supply sides across major countries of North America, Europe, Asia Pacific, the Middle East & Africa, and Latin America. Primary data was collected through questionnaires, emails, and telephonic interviews. The primary sources from the supply side included various industry experts, such as Chief X Officers (CXOs), Vice Presidents (VPs), Directors from business development, marketing, product development/innovation teams, and related key executives from bioceramic industry vendors; system integrators; component providers; distributors; and key opinion leaders. Primary interviews were conducted to gather insights such as market statistics, data on revenue collected from the products and services, market breakdowns, market size estimations, market forecasting, and data triangulation. Primary research also helped in understanding the various trends related to type, application, and region. Stakeholders from the demand side, such as CIOs, CTOs, CSOs, and installation teams of the customer/end users who are using bioceramic products were interviewed to understand the buyer’s perspective on the suppliers, products, component providers, and their current usage of bioceramic and outlook of their business which will affect the overall market.

The Breakup of Primary Research:
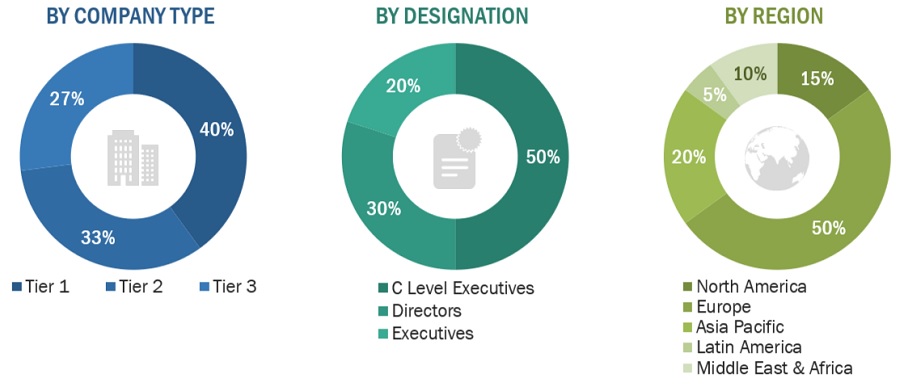
Bioceramics Market Size, and Share

To know about the assumptions considered for the study, download the pdf brochure

Market Size Estimation

The research methodology used to estimate the size of the bioceramics market includes the following details. The market sizing of the market was undertaken from the demand side. The market was upsized based on procurements and modernizations in bioceramic products in different applications at a regional level. Such procurements provide information on the demand aspects of the bioceramic industry for each application. For each application, all possible segments of the bioceramics market were integrated and mapped.

Bioceramics Market Size: Botton Up Approach

Bioceramics Market Size, and Share

To know about the assumptions considered for the study, Request for Free Sample Report

Bioceramics Market Size: Top-Down Approach

Bioceramics Market Size, and Share

Data Triangulation

After arriving at the overall size from the market size estimation process explained above, the total market was split into several segments and subsegments. The data triangulation and market breakdown procedures explained below were implemented, wherever applicable, to complete the overall market engineering process and arrive at the exact statistics for various market segments and subsegments. The data was triangulated by studying various factors and trends from the demand and supply sides. Along with this, the market size was validated using both the top-down and bottom-up approaches.

Market Definition

The bioceramics are biocompatible materials and used for repairing or replacing damaged bone tissues, as well as other medical applications such as dental implants, joint replacements, pacemakers, kidney dialysis machines, and respirators. Bioceramics can be composed of various materials and dopants to achieve specific properties, such as zirconia, alumina, hydroxyapatite, and bioactive glasses. The market is driven by factors such as increasing demand in medical applications, rising healthcare expenditure, growing geriatric population, increasing research and development activities, and geographical factors. The bioceramics market is segmented by material type, form, type, application, and geography, with major players including CoorsTek Inc., DSM, KYOCERA Corporation, and CeramTec GmbH. The market is expected to continue expanding in the coming years, driven by technological advancements, changing consumer behaviors, regulatory shifts, and global trends.

Key Stakeholders

  • Bioceramic Manufacturers
  • Raw Materials Suppliers
  • Distributors and Suppliers
  • End-use Industries
  • Industry Associations
  • R&D Institutions
  • Environment Support Agencies

Report Objectives

  • To define, describe, and forecast the bioceramic market size in terms of volume and value.
  • To provide detailed information regarding the key factors, such as drivers, restraints, opportunities, and challenges influencing market growth
  • To analyze and project the global bioceramics market by type, form, material type, application, and region.
  • To forecast the market size concerning five main regions (along with country-level data), namely, North America, Europe, Asia Pacific, Latin America, and the Middle East & Africa, and analyze the significant region-specific trends.
  • To strategically analyze micro markets with respect to individual growth trends, prospects, and contributions of the submarkets to the overall market
  • To analyze the market opportunities and the competitive landscape for stakeholders and market leaders
  • To assess recent market developments and competitive strategies, such as agreements, contracts, acquisitions, and new product developments/new product launches, to draw the competitive landscape.
  • To strategically profile the key market players and comprehensively analyze their core competencies.

Available Customizations

MarketsandMarkets offers following customizations for this market report:

  • Additional country-level analysis of the bioceramic market

Product Analysis

  • Product matrix, which provides a detailed comparison of the product portfolio of each company's market.
Custom Market Research Services

We will customize the research for you, in case the report listed above does not meet with your exact requirements. Our custom research will comprehensively cover the business information you require to help you arrive at strategic and profitable business decisions.

Request Customization
Report Code
CH 8964
Published ON
Mar, 2024
Choose License Type
BUY NOW
  • SHARE
X
Request Customization
Speak to Analyst
Speak to Analyst
OR FACE-TO-FACE MEETING
PERSONALIZE THIS RESEARCH
  • Triangulate with your Own Data
  • Get Data as per your Format and Definition
  • Gain a Deeper Dive on a Specific Application, Geography, Customer or Competitor
  • Any level of Personalization
REQUEST A FREE CUSTOMIZATION
LET US HELP YOU!
  • What are the Known and Unknown Adjacencies Impacting the Bioceramics Market
  • What will your New Revenue Sources be?
  • Who will be your Top Customer; what will make them switch?
  • Defend your Market Share or Win Competitors
  • Get a Scorecard for Target Partners
CUSTOMIZED WORKSHOP REQUEST
+1-888-600-6441
  • Call Us
  • +1-888-600-6441 (Corporate office hours)
  • +1-888-600-6441 (US/Can toll free)
  • +44-800-368-9399 (UK office hours)
CONNECT WITH US
ABOUT TRUST ONLINE
©2024 MarketsandMarkets Research Private Ltd. All rights reserved
DMCA.com Protection Status Website Feedback