Automotive Engine and Engine Mounts Market by Fuel Type (Gasoline, Diesel, Natural Gas, & Hybrid), Engine Size, Engine Type (L4, L6, V6, and V8), Engine Mounts, Vehicle Type (PC, LCV, HCV, and Two-Wheeler), & by Region - Global Trends & Forecast to 2020


[151 Pages Report] The global automotive engine market is projected to grow at a CAGR of 6.03%, from USD 63.36 Billion in 2015 to USD 84.91 Billion by 2020. Meanwhile, the global engine mounts market is projected to grow at a CAGR of 6.38%, from USD 3.62 Billion in 2015 to USD 4.93 Billion by 2020. In this study, 2014 has been considered as the base year, and 2015 to 2020 as the forecast period for estimating the market size of the automotive engine and engine mounts market. The study segments the automotive engine and engine mount market on the basis of fuel type, engine type, vehicle type, and region.
The market has been segmented by fuel type into gasoline, diesel, natural gas, and hybrid. The increasing production of passenger cars in Asia-pacific, mainly in China, India, and Japan, is expected to drive the automotive engine market in the region. The Asia-pacific region is estimated to lead the market, in terms of value, in 2015.
Technological advancements in automotive engines have led to the development of technology such as multi-fuel engines, turbocharger technology, variable valve technology (VVT), and common rail direct injection (CRDI), which can produce the high power and high torque required for luxury segment vehicles. OEMs are developing engines that are lightweight and able to produce high power; this will likely boost the demand for automotive engines, thereby driving the market for the same
The research methodology used in the report involves various secondary sources, including paid databases and directories. Experts from related industries and suppliers have been interviewed to understand the future trends of the automotive engine market. The bottom-up approach has been used to estimate the market size, whereby country-wise vehicle sales statistics have been taken into account for each vehicle type.
The average number of automotive engines that go into each vehicle category has been identified and multiplied by vehicle sale numbers to derive the country-level automotive engine volume to arrive at the market size, in terms of volume, for automotive engines. This country-wise market size, in terms of volume, for each vehicle type is then multiplied with the country-wise average of price (AOP) of automotive engines required for each application. This results in the country-wise market size, in terms of value. The summation of the country-wise market provides the regional market, and further summation of the regional market results in the global automotive engine market.
The figure below illustrates the break-up of the profile of industry experts who participated in primary discussions.
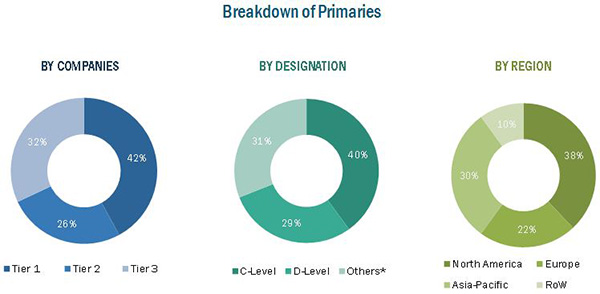
The automotive engine ecosystem consists of manufacturers such as Mitsubishi Heavy Industries Ltd. (Japan), Cummins Inc. (U.S.), Fiat S.p.A. (Italy), and MAHLE GmbH (Germany), research institutes such as the Automotive Research Association of India (ARAI), European Automotive Research Partners Association (EARPA), and the United States Council for Automotive Research (USCAR), and regional automobile associations such as China Association of Automobile Manufacturers (CAAM), Japan Automobile Manufacturers Association (JAMA), and the European Automobile Manufacturers Association (ACEA).
Target Audience
- Manufacturers of automotive engines
- Dealers and distributors of automotive engines
- Industry associations
- Investment firms
- Equity research firms
- Private equity firms
Scope of the Report
-
By Fuel Type
- Gasoline
- Diesel
- Hybrid
- Natural Gas
-
By Engine Type
- L4
- L6
- V6
- V8
-
By Vehicle Type
- Passenger Car
- LCV
- HCV
- Two-Wheeler
-
By Engine Mount
- Elastomer
- Hydraulic
- Electrohydraulic
-
By Region
- North America
- Asia-Pacific
- Europe
- RoW
Available Customizations
MarketsandMarkets offers the following customizations for this market:
- Automotive engine market, by region
- Detailed analysis and profiling of additional market players (up to 3)
The global automotive engine market is projected to grow at a CAGR of 6.03%, from USD 63.36 Billion in 2015 to USD 84.91 Billion by 2020, while the global engine mounts market is projected to grow at a CAGR of 6.38%, from USD 3.62 Billion in 2015 to USD 4.93 Billion by 2020. Asia-Pacific is the largest market for automotive engines, followed by North America and Europe. Market growth is fueled by the increasing vehicle production and the growing demand for high-torque, high-power engines for the racing and luxury segments. However, the increasing demand for electric vehicles and high R&D costs incurred when developing advanced technologies will likely hinder the growth of the market.
The automotive engine market has been segmented on the basis of fuel type into gasoline, diesel, hybrid, and natural gas. The natural gas segment is set to grow at the highest CAGR during the forecast period, owing to the growing adoption of hybrid vehicles across the globe. However, the diesel segment is expected to account for the largest share, in terms of value, of the global automotive engine market in 2015.
The automotive engine market has been segmented on the basis of engine type into L4, L6, V6, and V8 engines. Automotive L4 engines account for a larger market share than automotive V6 engines. This can be mainly attributed to the growing demand for high-power engines for racing. The Asia-Pacific region is estimated to account for the largest market share, in terms of value, in 2015.
The automotive engine mounts market has also been segmented on the basis of vehicle type into passenger car, light commercial vehicle (LCV), and heavy commercial vehicle (HCV). The passenger car segment is estimated to account for the largest share, in terms of volume, of the global engine mounts market in 2015. This can be credited to the increasing demand for high-grade natural rubber for engine mounts with high load-carrying capacity.
Two-wheeler systems have been segmented on the basis of CC into 100CC, 101CC–150CC, 151CC–250CC, 251CC–500CC, and 501CC and above. The 101CC–150CC segment is estimated to account for the largest share, in terms of volume, of the global two-wheeler market in 2015. The improving economic conditions and standard of living in developing countries and the favorable demographics in the Asia-Pacific region are key factors propelling the growth of the two-wheeler engine market.
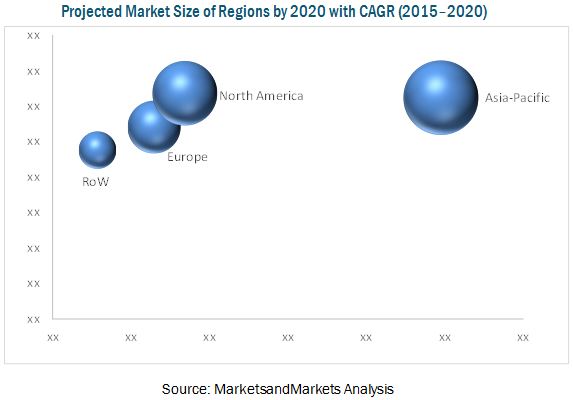
The automotive engine market has also been categorized on the basis of region as follows: Europe, Asia-Pacific, North America, and RoW. Asia-Pacific is estimated to account for the largest share, in terms of volume, of the global engine market in 2015. This can be attributed to the increasing demand for high-power and fuel-efficient engines in the region.
Mitsubishi Heavy Industries Ltd. (Japan) is a key player in the automotive engine market. Its wide product portfolio and R&D capabilities have helped it become a leading player in the industry. The company is constantly launching state-of-the-art products on a global scale; this has increased its customer base and expanded its presence in the global market.
Cummins Inc. (U.S.), another major player, focuses on actively collaborating and developing partnerships with global market leaders, including Nissan (Japan), Maruti Suzuki (India), and Tata Motors (India), to develop advanced engines and technologies for the automotive engine market.
Fiat S.p.A (Italy) mainly focuses on developing new and advanced products to meet the requirements of its various customers and to retain its technological advantage. For instance, the company’s gross R&D expenditure was USD 3080.7 Million in 2014.
 Exclusive indicates content/data unique to MarketsandMarkets and not available with any competitors.
Table of Contents
1 Introduction (Page No. - 14)
1.1 Objective of the Study
1.2 Market Definition
1.2.1 Gasoline Engine
1.2.2 Diesel Engine
1.2.3 Hybrid Engines
1.2.4 Natural Gas Engines
1.2.5 Engine Mounts
1.3 Market Scope
1.3.1 Market Covered
1.3.2 Years Considered for the Study
1.4 Currency
1.5 Package Size
1.6 Limitation
1.7 Stakeholders
2 Research Methodology (Page No. - 18)
2.1 Research Data
2.2 Secondary Data
2.2.1 Key Secondary Sources
2.2.2 Key Data From Secondary Sources
2.3 Primary Data
2.3.1 Sampling Techniques and Data Collection Methods
2.3.2 Primary Participants
2.3.2.1 Key Industry Insights
2.4 Factor Analysis
2.4.1 Introduction
2.4.2 Demand Side Analysis
2.4.2.1 Impact of GDP on Total Vehicle Sales
2.4.2.2 Urbanization vs Passenger Cars Per 1000 People
2.4.2.3 Infrastructure: Roadways
2.4.3 Supply Side Analysis
2.4.3.1 Technological Advancements
2.4.3.2 Increased R&D Activities
2.5 Market Size Estimation
2.6 Data Triangulation
2.7 Assumptions
3 Executive Summary (Page No. - 30)
4 Premium Insights (Page No. - 34)
4.1 Opportunities in the Automotive Engine Market
4.2 Regional Analysis for Market, 2015 & 2020
4.3 Market, By Type, 2015 & 2020
4.4 Two Wheeler Engine Market, By Type 2015 & 2020
4.5 Gasoline Engine to Occupy the Largest Share in the Market, 2015
4.6 Market, By Region
5 Market Overview (Page No. - 39)
5.1 Introduction
5.2 Market Segmentation
5.2.1 Automotive Engine and Engine Mounts Market, By Type
5.2.2 Automotive Engine and Engine Mounts Market, By Vehicle Type
5.2.3 Automotive Engine and Engine Mounts Market, By Region
5.2.4 Automotive Engine Market, By Fuel Type
5.3 Market Dynamics
5.3.1 Drivers
5.3.1.1 Increasing Vehicle Production
5.3.1.2 Increasing Demand of High Torque and High Power Engines for High End Cars
5.3.1.3 Increasing Demand for High Grade Natural Rubber, With High Load Carrying Capacity Engines.
5.3.2 Restraints
5.3.2.1 Higher Aftermarket Cost
5.3.2.2 High R&D Cost for Engine and Engine Mounts
5.3.2.3 Increase in Demand for Electric Vehicle
5.3.3 Opportunities
5.3.3.1 Growing Demand for Engine Downsizing With High Engine Power and Fuel Efficiency
5.3.4 Challenges
5.3.4.1 Stringent Emission Norms to Reduce Carbon Footprints
5.3.5 Burning Issue
5.3.5.1 Broken Engine Mounts Can Damage the Engine
5.4 Value Chain Analysis
5.5 Porter’s Five Force Analysis
5.5.1 Threat of New Entrants
5.5.2 Threat From Substitutes
5.5.3 Bargaining Power of Suppliers
5.5.4 Bargaining Power of Buyers
5.5.5 Intensity of Competitive Rivalry
6 Technical Overview (Page No. - 52)
6.1 Engine Downsizing and Downspeeding
6.2 Electric Vehicle Initiative
6.3 Advances in Internal Combustion Engine
6.4 Variable Valve Timing
6.5 Emission Norms
7 Automotive Engine Market, By Engine Type (Page No. - 55)
7.1 Introduction
7.2 L4 Engine
7.3 L6 Engine
7.4 V6 Engine
7.5 V8 Engine
8 Automotive Engine Market, By Fuel Type (Page No. - 63)
8.1 Introduction
8.2 By Region
8.2.1 Asia-Pacific
8.2.2 Europe
8.2.3 North America
8.2.4 RoW
9 Automotive Engine Mounts Market, By Technology (Page No. - 71)
9.1 Introduction
9.2 Passenger Car, By Technology
9.3 LCV, By Technology
9.4 HCV, By Technology
10 Two-Wheeler Engine Market, By Engine Size (Page No. - 77)
10.1 Introduction
10.2 Region
10.2.1 Asia-Pacific
10.2.2 Europe
10.2.3 North America
10.2.4 RoW
11 Automotive Engine Market, By Region (Page No. - 85)
11.1 Pest Analysis
11.1.1 Political Factors
11.1.1.1 Europe
11.1.1.2 Asia-Pacific
11.1.1.3 North America
11.1.1.4 Rest of the World
11.1.2 Economic Factors
11.1.2.1 Europe
11.1.2.2 Asia-Pacific
11.1.2.3 North America
11.1.2.4 Rest of the World
11.1.3 Social Factors
11.1.3.1 Europe
11.1.3.2 Asia-Pacific
11.1.3.3 North America
11.1.3.4 Rest of the World
11.1.4 Technological Factors
11.1.4.1 Europe
11.1.4.2 Asia-Pacific
11.1.4.3 North America
11.1.4.4 Rest of the World
11.2 Introduction
11.3 Asia-Pacific
11.3.1 China Automotive Engine Market, By Vehicle Type
11.3.2 Japan Market, By Vehicle Type
11.3.3 South Korea Market, By Vehicle Type
11.3.4 India Market, By Vehicle Type
11.4 Europe
11.4.1 Germany Market, By Vehicle Type
11.4.2 France Market, By Vehicle Type
11.4.3 U.K. Market, By Vehicle Type
11.4.4 Spain Market, By Vehicle Type
11.5 North America
11.5.1 U.S. Market, By Vehicle Type
11.5.2 Mexico Market, By Vehicle Type
11.5.3 Canada Market, By Vehicle Type
11.6 RoW
11.6.1 Brazil Market, By Vehicle Type
11.6.2 Russia Automotive Engine Market, By Vehicle Type
12 Competitive Landscape (Page No. - 108)
12.1 Overview
12.2 Market Share Analysis: Automotive Engine & Engine Mounts Market
12.3 Battle for Market Share: Expansion Was the Key Strategy
12.4 Expansions
12.5 New Product Launches
12.6 Agreements and Supply Contracts
12.7 Mergers/Acquisitions
13 Company Profiles (Page No. - 115)
(Company at A Glance, Business Overview, Products Offered, Key Strategy, Recent Developments, SWOT Analysis & Mnm View)*
13.1 Introduction
13.2 Cummins Inc
13.3 Hyundai Motor Company
13.4 Mitsubishi Heavy Industries Ltd
13.5 Mahle GmbH
13.6 Scania AB
13.7 Fiat S.P.A
13.8 Hutchinson SA
13.9 Cooper-Standard
13.10 Trelleborg AB
13.11 Toyo Tire & Rubber Co. Ltd
*Details on Company at A Glance, Recent Financials, Products Offered, Strategies & Insights, & Recent Developments Might Not Be Captured in Case of Unlisted Companies.
14 Appendix (Page No. - 144)
14.1 Insights of Industry Experts
14.2 Discussion Guide
14.3 Introducing RT: Real Time Market Intelligence
14.4 Available Customizations
14.5 Related Report
14.6 Other Developments
List of Tables (83 Tables)
Table 1 Drivers of the Automotive Engine and Engine Mounts Market
Table 2 Restraints of the Automotive Engine and Engine Mounts Market
Table 3 Opportunities of the Automotive Engine and Engine Mounts Market
Table 4 Challenges of the Automotive Engine and Engine Mounts Market
Table 5 Type of Engines Provied By Top Oems to Meet Emission Norms
Table 6 Global Automotive Engine Market, By Engine Type 2013-2020 (Million Units)
Table 7 Market, By Engine Type 2013-2020 (USD Million)
Table 8 L4 Market, By Region, 2013-2020 (Million Units)
Table 9 L4 Market, By Region, 2013-2020 (USD Million)
Table 10 L6 Market, By Region, 2013-2020 (‘000 Units)
Table 11 L6 Market, By Region, 2013-2020 (USD Million)
Table 12 V6 Market, By Region, 2013-2020 (‘000 Units)
Table 13 V6 Market, By Region, 2013-2020 (USD Million)
Table 14 V8 Engine Market, By Region, 2013-2020 (‘000 Units)
Table 15 V8 Market, By Region, 2013-2020 (USD Million)
Table 16 Automotive Engine Market, By Region 2013-2020 (Million Units)
Table 17 Market, By Region 2013-2020 (USD Million)
Table 18 Asia-Pacific Market, By Fuel Type, 2013-2020 (‘000 Units)
Table 19 Asia-Pacific Market, By Fuel Type, 2013-2020 (USD Million)
Table 20 Europe Market, By Fuel Type, 2013-2020 (‘000 Units)
Table 21 Europe Market, By Fuel Type, 2013-2020 (USD Million)
Table 22 North America Market, By Fuel Type, 2013-2020 (‘000 Units)
Table 23 North America Market, By Fuel Type , 2013-2020 (USD Million)
Table 24 RoW Market, By Fuel Type, 2013-2020 (‘000 Units)
Table 25 RoW Automotive Engine Market, By Fuel Type, 2013-2020 (USD Million)
Table 26 Automotive Engine Mounts Market, By Vehicle Type, 2013-2020 (Million Units)
Table 27 Automotive Engine Mounts Market, By Vehicle Type, 2013-2020 (USD Million)
Table 28 Passenger Car Automotive Engine Mounts Market Size, By Technology, 2013-2020 (Million Units)
Table 29 Passenger Car Automotive Engine Mounts Market Size, By Technology, 2013-2020 (USD Million)
Table 30 LCV Automotive Engine Mounts Market Size, By Technology, 2013-2020 (Million Units)
Table 31 LCV Automotive Engine Mounts Market Size, By Technology, 2013-2020 (USD Million)
Table 32 HCV Automotive Engine Mounts Market Size, By Technology, 2013-2020 (‘000 Units)
Table 33 HCV Automotive Engine Mounts Market Size, By Technology, 2013-2020 (USD Million)
Table 34 Two-Wheeler Engine Market, By Engine Size, 2012-2019 (Million Units)
Table 35 Two-Wheeler Engine Market, By Engine Size, 2012-2019 (USD Million)
Table 36 Asia-Pacific: Two-Wheeler Engine Market, By Engine Size, 2013-2020 (Million Units)
Table 37 Asia-Pacific: Two-Wheeler Engine Market, By Engine Size, 2012-2019 (USD Million)
Table 38 Europe: Two-Wheeler Engines Market, By Engine Size, 2012-2019 (000’ Units)
Table 39 Europe: Two-Wheeler Engines Market, By Engine Size, 2012-2019 (USD Million)
Table 40 North America: Two-Wheeler Engines Market, By Engine Size, 2012-2019 (000’ Units)
Table 41 North America: Two-Wheeler Engines Market, By Engine Size, 2012-2019 (USD Million)
Table 42 RoW: Two-Wheeler Engines Market, By Engine Size, 2013-2020 (000’ Units)
Table 43 RoW: Two-Wheeler Engines Market, By Engine Size, 2012-2019 (USD Million)
Table 44 Automotive Engine Market, By Region, 2013–2020 ('000 Units)
Table 45 Market, By Region, 2013–2020 (USD Million)
Table 46 Asia-Pacific: Market, By Country, 2013–2020 ('000 Units)
Table 47 Asia-Pacific: Market, By Country, 2013–2020 (USD Million)
Table 48 China: Market, By Vehicle Type, 2013–2020 ('000 Units)
Table 49 China: Market, By Vehicle Type, 2013–2020 (USD Million)
Table 50 Japan: Market, By Vehicle Type, 2013–2020 ('000 Units)
Table 51 Japan: Market, By Vehicle Type, 2013–2020 (USD Million)
Table 52 South Korea: Market, By Vehicle Type,2013–2020 ('000 Units)
Table 53 South Korea: Market, By Vehicle Type, 2013–2020 (USD Million)
Table 54 India: Market, By Vehicle Type, 2013–2020 ('000 Units)
Table 55 India: Market, By Vehicle Type, 2013–2020 (USD Million)
Table 56 Europe: Automotive Engine Market, By Country, 2013–2020 ('000 Units)
Table 57 Europe: Market, By Country, 2013–2020 (USD Million)
Table 58 Germany: Market, By Vehicle Type, 2013–2020 ('000 Units)
Table 59 Germany: Market, By Vehicle Type, 2013–2020 (USD Million)
Table 60 France: Market, By Vehicle Type, 2013–2020 ('000 Units)
Table 61 France: Market, By Vehicle Type, 2013–2020 (USD Million)
Table 62 U.K.: Market ,By Vehicle Type, 2013–2020 ('000 Units)
Table 63 U.K.: Market, By Vehicle Type, 2013–2020 (USD Million)
Table 64 Spain: Market, By Vehicle Type, 2013–2020 ('000 Units)
Table 65 Spain: Market, By Vehicle Type, 2013–2020 (USD Million)
Table 66 North America: Automotive Engine Market, By Country, 2013–2020 ('000 Units)
Table 67 North America: Market, By Country, 2013–2020 (USD Million)
Table 68 U.S.: Market, By Vehicle Type, 2013–2020 ('000 Units)
Table 69 U.S.: Market, By Vehicle Type, 2013–2020 (USD Million)
Table 70 Mexico: Market, By Vehicle Type, 2013–2020 ('000 Units)
Table 71 Mexico: Market, By Vehicle Type, 2013–2020 (USD Million)
Table 72 Canada: Market, By Vehicle Type, 2013–2020 ('000 Units)
Table 73 Canada: Market By Vehicle Type 2013–2020 (USD Million)
Table 74 RoW: Market, By Country, 2013–2020 ('000 Units)
Table 75 RoW: Market, By Country, 2013–2020 (USD Million)
Table 76 Brazil: Market, By Vehicle Type, 2013–2020 ('000 Units)
Table 77 Brazil: Market, By Vehicle Type,2013–2020 (USD Million)
Table 78 Russia: Automotive Engine Market, By Vehicle Type, 2013–2020 ('000 Units)
Table 79 Russia: Market, By Vehicle Type, 2013–2020 (USD Million)
Table 80 Expansions/Investment, 2012–2015
Table 81 New Product Launches, 2012–2015
Table 82 Agreements/Joint Ventures & Supply Contracts, 2012–2015
Table 83 Merger/Acquisitions/Joint Venture, 2012–2015
List of Figures (55 Figures)
Figure 1 Automotive Engine and Engine Mounts Market: Market Covered
Figure 2 Automotive Engine and Engine Mounts Market: Stakeholders
Figure 3 Research Design
Figure 4 Research Methodology Model:
Figure 5 Breakdown of Primary Interviews: By Company Type, Designation, and Region
Figure 6 Gross Domestic Product (GDP) vs Total Vehicle Sales, 2013 & 2014
Figure 7 Urbanization vs Passenger Cars Per 1,000 People, 2010-2014
Figure 8 Market Size Estimation Methodology: Bottom Up Approach
Figure 9 Automotive Engines Market, By Value, 2015 vs 2020
Figure 10 100 Cc-150 Cc Engines Would Dominate the Two Wheeler Engine Market, 2015 to 2020
Figure 11 Passenger Car: the Largest Contributor to the Automotive Engine Mounts Market, 2015 & 2020
Figure 12 North America is Growing at Highest CAGR From 2015 to 2020
Figure 13 Advanced Technology and Growth of the Automotive Industry Will Drive the Automotive Engine Market, 2015 & 2020
Figure 14 Asia-Pacific Holds the Major Share in the Market, 2015 & 2020
Figure 15 L4 Engines is Projected to Grow at the Highest CAGR During the Forecast Period, 2015 & 2020
Figure 16 101cc-150cc Segment Holds the Maximum Share in theMarket From 2015 to 2020
Figure 17 Gasoline Engine Holds the Maximum Share in the Market in 2015
Figure 18 PLC of Automotive Engine Market
Figure 19 Engine Market, By Type
Figure 20 Engine Mounts Market, By Type
Figure 21 Automotive Engine & Engine Mounts Market, By Vehicle Type
Figure 22 Increasing Vehicle Production Would Drive the Market for Automotive Engine and Engine Mounts in the Future
Figure 23 Global Vehicle Production, 2012-2020
Figure 24 Value Chain Analysis: Major Value is Added During Manufacturing and Assembly Phases
Figure 25 Porter’s Five Forces Analysis : Automotive Engine and Engine Mounts Market
Figure 26 Automotive Engine Market Growth, 2015-2020
Figure 27 L4 Engine Market, By Region
Figure 28 North America is Growing at A Highest CAGR in the Market Growth, 2015-2020
Figure 29 Asia-Pacific Engine Market, By Fuel Type, 2015 vs 2020
Figure 30 Automotive Engine Mounts Market Growth, 2015-2020
Figure 31 151cc-250cc is the Fastest Growing Segment in the Global Two Wheeler Engines Market, 2015 & 2020
Figure 32 China to Be the Fastest-Growing Market for Automotive Engines During the Forecast Period, 2015 & 2020
Figure 33 China to Lead the Asia-Pacific Market
Figure 34 Spain to Register the Highest CAGR in the European Region, 2015 & 2020
Figure 35 U.S. to Capture the Largest Share of the North American Automotive Engine Market
Figure 36 Brazil to Occupy the Largest Share in the RoW Market, 2015 & 2020
Figure 37 Companies Adopted Expansion as the Key Growth Strategy Over the Last Three Years, 2012-2015
Figure 38 Automotive Engine and Engine Mounts Module Market, By Key Players Ranking, 2014
Figure 39 Market Evaluation Framework: Expansions, Launches Fuelled Market Growth From 2012 to 2015
Figure 40 Region-Wise Mix of Top Five Players
Figure 41 Cummins Inc: Business Overview
Figure 42 Cummins Inc: SWOT Analysis
Figure 43 Hyundai Motor Company : Business Overview
Figure 44 Mitsubishi Heavy Industries Ltd : Business Overview
Figure 45 Mitsubishi Heavy Industries Ltd: SWOT Analysis
Figure 46 Mahle GmbH: Company Snapshot
Figure 47 Mahle GmbH: SWOT Analysis
Figure 48 Scania AB: Company Snapshot
Figure 49 Scania AB: SWOT Analysis
Figure 50 Fiat S.P.A.: Company Snapshot
Figure 51 Fiat S.P.A.: SWOT Analysis
Figure 52 Hutchinson SA: Company Snapshot
Figure 53 Cooper-Standard : Company Snapshot
Figure 54 Trelleborg AB: Company Snapshot
Figure 55 Toyo Tires & Rubber Co. Ltd : Company Snapshot


Growth opportunities and latent adjacency in Automotive Engine and Engine Mounts Market