Augmented Reality Automotive Market by Function (AR HUD Navigation, AR HUD ACC, AR HUD LDW & Advanced AR HUD), Sensor Technology, Display Technology, Level of Autonomous Driving, Electric Vehicle, Vehicle Type, and Region - Global Forecast to 2025


The global augmented reality automotive market is estimated to grow at a CAGR of 17.60% during the forecast period, to reach USD 6.79 Billion in 2025. The base year for the report is 2018 and the forecast period is 2020–2025. The market for augmented reality automotive applications is primarily driven by the increase in adoption of advanced driving assistance systems by OEMs across different vehicle types and consumer demand for in-vehicle safety features that potentially reduce collisions and injuries caused by human-driver errors. Additionally, the market is also influenced by the increasing level of driving automation and progress toward fully autonomous vehicles.
Objectives of the Report
- To define, describe, and project the augmented reality automotive market (2018–2025), in terms of volume (‘000 units) and value (USD million/billion)
- To provide detailed information regarding the major factors such as drivers, restraints, opportunities, and industry-specific challenges influencing the growth of the market
- To analyze and forecast the market and forecast the market size, by volume and value, based on function, sensor technology, display technology, electric vehicle, level of autonomous driving, vehicle type, and region
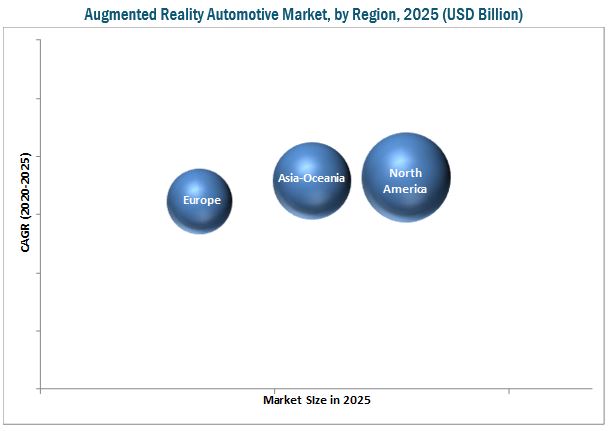
- To forecast the market size, by volume and value, of the market for four regions, namely, North America, Europe, Asia-Oceania, and the Rest of the World (RoW)
- To track and analyze competitive developments such as joint ventures, mergers & acquisitions, new product development, and expansions in the market
The research methodology used in the report involves primary and secondary sources and follows bottom-up and top-down approaches for data triangulation. The study involves country-level OEM and model-wise analysis of augmented reality automotive head-up displays. This analysis involves historical trends as well as existing penetrations by country as well as vehicle type. The analysis is projected based on various factors such as growth trends in vehicle production and regulations or mandates on the implementation of automotive electronics that drive the augmented reality head-up display (AR HUD) system. The analysis has been discussed and validated by primary respondents, which include experts from the augmented reality automotive industry, manufacturers, and suppliers. Secondary sources include associations such as International Organization of Motor Vehicle Manufacturers (OICA), American Association of Motor Vehicle Administrators (AAMVA), Automotive Component Manufacturers Association of India (ACMA), and paid databases and directories such as Factiva and Bloomberg.
The below figure illustrates the break-up of the profile of industry experts who participated in primary discussions.
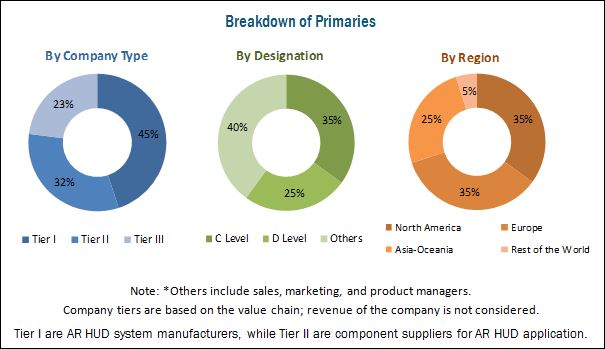
To know about the assumptions considered for the study, download the pdf brochure
The ecosystem of the augmented reality automotive market consists of automotive AR HUD system providers such as Continental AG (Germany), Visteon Corporation (U.S.), and Panasonic Corporation (Japan) among others. The AR HUD systems are supplied to automotive OEMs such as BMW Group (Germany), Daimler AG (Germany), Volkswagen AG (Germany), and others.
Target Audience
- Automotive AR HUD system manufacturers and component suppliers
- Automotive display panel manufacturers
- Automotive OEMs
- Industry associations and other driver assistance systems manufacturers
- The automobile industry and related end-user industries
Scope of the report
By Function
By Sensor Technology
By Display Technology
By Electric Vehicle
By Level of Autonomous Driving
By Vehicle Type
By Region
-
- Standard AR HUD
- AR HUD based Navigation
- AR HUD based Adaptive Cruise Control
- AR HUD based Lane Departure Warning
- Radar
- LiDar
- CCD/CMOS Image Sensor
- Sensor Fusion
- TFT-LCD
- Other Advanced Technologies
- Battery Electric Vehicle
- Others (Hybrid)
- Conventional
- Semi-autonomous
- Passenger Cars
- Commercial Vehicles
- Asia-Oceania (China, Japan, India, and South Korea)
- Europe (Germany, France, Italy, and the U.K.)
- North America (Canada, Mexico, and the U.S.)
- Rest of the World (Brazil, Russia, and South Africa)
Available Customizations
By Components & Region (Volume & Value)
Company Information
Detailed analysis and profiling of additional market players (up to 5)
Augmented Reality Automotive Market Ranking
The augmented reality automotive market is projected to grow at a CAGR of 17.60% from 2020 to 2025, to reach a market size of USD 6.79 Billion by 2025. The key drivers for the market are the increasing adoption rate of advanced technologies by OEMs, rising consumer demand for enhanced in-vehicle safety, faster generation of real-time and reliable data from advanced driver assistance systems, and the growth of connected vehicles.
The augmented reality head-up display (AR HUD) for automotive application is expected to be launched in the market during the forecast period from 2018 to 2025. The advanced AR HUD is projected to be the largest segment of the market, in terms of volume and value, during the forecast period. The growth of this function can be attributed to the increased use of sensing systems for in-car monitoring, external environment monitoring, safety functions, and driving analysis. The use of sensing technologies in vehicles is ideal if the data gathered from it is projected on a single platform in the driver’s field of view. The AR HUD will reduce driver distraction by providing information on the vehicle’s windshield, directly in the driver’s line of sight.
The sensor fusion technology is estimated to be the largest segment of the augmented reality automotive market. The active development of semi-autonomous and autonomous vehicles will boost the demand for sensor fusion based AR HUD by 2025. Sensors play a critical part in the optimum functioning of the AR HUD and blending the sensor technologies will provide data accuracy for critical safety applications such as higher levels of autonomous driving.
North America is expected to dominate the augmented reality automotive market during the forecast period. The demand for augmented reality automotive functions is directly linked to the vehicle production in this region and the growing demand for luxury vehicles equipped with advanced technologies.
A key factor restraining the growth of the augmented reality automotive market is the high cost of developing the display system and its related technologies. The AR HUD involves the complex interlinking of electronic and mechanical components and vehicle sensors. The system enables the vehicle windshield to become an advanced display with computational abilities. The AR HUD would play a key role in the automotive cockpit and, with increasing level of autonomous driving, the system is expected to play a larger role in autonomous vehicles. Due to this, companies entering the market will have to invest heavily in research and development for developing and testing prototypes of AR HUD with advanced augmented display technologies. The high costs involved could restrain the development of the augmented reality automotive applications. The market is dominated by a few global players and comprises several regional players. Some of the key manufacturers operating in the market are Continental AG (Germany), Panasonic Corporation (Japan), and Visteon Corporation (U.S.).
To speak to our analyst for a discussion on the above findings, click Speak to Analyst
-
- Asia-Oceania
- Europe
- North America
- Rest of the World
 Exclusive indicates content/data unique to MarketsandMarkets and not available with any competitors.
Table of Contents
1 Introduction (Page No. - 16)
1.1 Objectives of the Study
1.2 Augmented reality automotive Market Definition
1.3 Market Scope
1.3.1 Markets Covered
1.3.2 Years Considered in the Study
1.4 Currency
1.5 Units Considered
1.6 Limitations
1.7 Stakeholders
2 Research Methodology (Page No. - 21)
2.1 Research Data
2.2 Secondary Data
2.2.1 Key Secondary Sources
2.2.2 Key Data From Secondary Sources
2.2.3 Primary Data
2.2.4 Sampling Techniques & Data Collection Methods
2.2.5 Primary Participants
2.3 Factor Analysis
2.3.1 Introduction
2.3.2 Demand Side Analysis
2.3.2.1 Increased Demand for Luxury Vehicles
2.3.2.2 Increased Adoption of In-Vehicle Advanced Driver Assistance Systems
2.3.3 Supply Side Analysis
2.3.3.1 Significant Focus By Oems Focus on Convenience and Comfort Systems in Vehicles
2.3.3.2 Technological Advancements in Vehicle Safety and Security
2.4 Augmented reality automotive market Size Estimation
2.5 Data Triangulation
2.6 Assumptions
3 Executive Summary (Page No. - 34)
4 Premium Insights (Page No. - 40)
4.1 Attractive Opportunities in the Global Market
5 Market Overview (Page No. - 44)
5.1 Introduction
5.2 Market Dynamics
5.2.1 Drivers
5.2.1.1 Increasing Demand for Connected Vehicles
5.2.1.2 Increase in Awareness About Road Safety
5.2.1.3 Rising Investments in the Augmented Reality Market
5.2.2 Restraints
5.2.2.1 High Dependence on Internet Connectivity
5.2.2.2 Continuous Development in Digital Network
5.2.2.3 Cyber Security Threats Due to Increasing Vehicle Telematics
5.2.3 Opportunities
5.2.3.1 Advent of Semi-Autonomous and Electric Vehicles in the Automotive Industry
5.2.3.2 Increasing Digital Content in Automotive Cockpits
5.2.3.3 New Heads-Up Display Functions Due to Reducing Dashboard Electronics
5.2.4 Challenges
5.2.4.1 High Cost of Augmented Reality Heads-Up Display Systems
5.2.4.2 Requirement of Greater Space in the Automotive Cockpit
5.2.4.3 Integration of Several Adas Functions in AR HUD Could Potentially Increase Driver Distraction
5.3 Porter’s Five Forces Analysis
5.3.1 Market
5.3.2 Threat of New Entrants
5.3.3 Threat of Substitutes
5.3.4 Bargaining Power of Suppliers
5.3.5 Bargaining Power of Buyers
5.3.6 Intensity of Competitive Rivalry
6 Technological Overview (Page No. - 63)
6.1 Introduction
6.2 Head-Up Display Evolution – Field of View
6.3 Current Functions of Augmented Reality Head-Up Display
6.3.1 Instrument Cluster Function
6.3.2 Navigation Function
6.3.3 Adaptive Cruise Control Function
6.3.4 Lane Departure Warning
6.4 Technological Advancement in the Future
7 Market, By Function (Page No. - 66)
7.1 Introduction
7.2 AR HUD With Navigation
7.3 AR HUD With Adaptive Cruise Control (ACC)
7.4 AR HUD With Standard Functions
7.5 AR HUD With Lane Departure Warning (LDW)
7.6 Advanced AR HUD
8 By Sensor Technology (Page No. - 77)
8.1 Introduction
8.2 LiDAR
8.3 Radar
8.4 Sensor Fusion
8.5 CCD/CMOS Image Sensors
9 By Display Technology (Page No. - 86)
9.1 Introduction
9.2 TFT-LCD
9.3 Other Advanced Technologies
10 By Electric Vehicle (Page No. - 92)
10.1 Introduction
10.2 Battery Electric Vehicle (BEV)
10.3 Others (Hybrid)
11 By Level of Autonomous Driving (Page No. - 97)
11.1 Introduction
11.2 Conventional Level of Driving
11.3 Semi-Autonomous Level of Driving
12 By Vehicle Type & Region (Page No. - 103)
12.2 Asia-Oceania
12.2.1 China
12.2.2 India
12.2.3 Japan
12.2.4 South Korea
12.2.5 Rest of Asia-Oceania
12.3 Europe
12.3.1 France
12.3.2 Germany
12.3.3 Italy
12.3.4 U.K.
12.3.5 Rest of Europe
12.4 North America
12.4.1 Canada
12.4.2 Mexico
12.4.3 U.S.
12.5 Rest of the World
12.5.1 Brazil
12.5.2 Russia
12.5.3 South Africa
13 Competitive Landscape (Page No. - 132)
13.1 Market: Market Ranking
14 Company Profiles (Page No. - 133)
(Company Overview, Strength of Product Portfolio, Product Offerings, Business Strategy Excellence, Recent Developments)*
14.1 Robert Bosch GmbH
14.2 Panasonic Corporation
14.3 Continental AG
14.4 Denso Corporation
14.5 Visteon Corporation
14.6 Nippon Seiki Co., Ltd.
14.7 Pioneer Corporation
14.8 Yazaki Corporation
14.9 Harman International Industries Inc.
14.10 Garmin Ltd.
14.11 Texas Instruments Inc.
14.12 Microvision, Inc.
*Details on Company Overview, Strength of Product Portfolio, Product Offerings, Business Strategy Excellence, Recent Developments Might Not Be Captured in Case of Unlisted Companies.
15 Appendix (Page No. - 176)
15.1 Insights of Industry Experts
15.2 Discussion Guide
15.3 Knowledge Store: Marketsandmarkets’ Subscription Portal
15.4 Introducing RT: Real Time Market Intelligence
15.5 Available Customizations
15.5.1 Augmented Reality Automotive Market, By Components and Region (Volume & Value)
15.5.2 Company Information
15.5.2.1 Detailed Analysis and Profiling of Additional Market Players (Up to 5)
15.5.3 Market Ranking
15.6 Related Reports
15.7 Author Details
List of Tables (95 Tables)
Table 1 US Dollar Exchange Rates (W.R.T USD)
Table 2 Porter’s Five Forces Analysis
Table 3 Augmented Reality Automotive Market Size, By Function, 2018–2025 (‘000 Units)
Table 4 Market Size, By Function, 2018-2025 (USD Million)
Table 5 AR HUD With Navigation: Market Size, By Region, 2018–2025 (‘000 Units)
Table 6 AR HUD With Navigation: Market Size, By Region, 2018–2025 (USD Million)
Table 7 AR HUD With Adaptive Cruise Control (ACC): Market Size, By Region, 2018–2025 (‘000 Units)
Table 8 AR HUD With Adaptive Cruise Control (ACC): Market Size, By Region, 2018–2025 (USD Million)
Table 9 AR HUD With Standard Functions: Market Size, By Region, 2018–2025 (‘000 Units)
Table 10 AR HUD With Standard Functions: Market Size, By Region, 2018–2025 (USD Million)
Table 11 AR HUD With Lane Departure Warning (LDW): Market Size, By Region, 2018–2025 (‘000 Units)
Table 12 AR HUD With Lane Departure Warning (LDW): Market Size, 2018–2025 (USD Million)
Table 13 Advanced AR HUD: Market Size, By Region, 2018–2025 (‘000 Units)
Table 14 Advanced AR HUD: Market Size, By Region, 2018–2025 (USD Million)
Table 15 Market, By Sensor Technology, 2018–2025 (‘000 Units)
Table 16 Market, By Sensor Technology, 2018–2025 (USD Million)
Table 17 LiDAR: Market, By Region, 2018–2025 (‘000 Units)
Table 18 LiDAR: Market, By Region, 2018–2025 (USD Million)
Table 19 Radar: Market, By Region, 2018–2025 (‘000 Units)
Table 20 Radar: Market, By Region, 2018–2025 (USD Million)
Table 21 Sensor Fusion: Market, By Region, 2018–2025 (‘000 Units)
Table 22 Sensor Fusion: Market, By Region, 2018–2025 (USD Million)
Table 23 CCD/CMOS Image Sensors: Market, By Region, 2018–2025 (‘000 Units)
Table 24 CCD/CMOS Image Sensors: Market, By Region, 2018–2025 (USD Million)
Table 25 Ideal Operating Conditions for Automotive Display Panels
Table 26 Augmented Reality Automotive Market, By Display Technology, 2018–2025 (‘000 Units)
Table 27 Market, By Display Technology, 2018–2025 (USD Million)
Table 28 TFT-LCD: Market, By Region, 2018–2025 (‘000 Units)
Table 29 TFT-LCD: Market, By Region, 2018–2025 (USD Million)
Table 30 Other Advanced Technologies: Market, By Region, 2018–2025 (‘000 Units)
Table 31 Other Advanced Technologies: Market, By Region, 2018–2025 (USD Million)
Table 32 Market Size, By Electric Vehicle, 2018–2025 (‘000 Units)
Table 33 Market Size, By Electric Vehicle, 2018–2025 (USD Million)
Table 34 Battery Electric Vehicle (BEV): Market Size, By Region, 2018–2025 (‘000 Units)
Table 35 Battery Electric Vehicle (BEV): Market Size, By Region, 2018–2025 (USD Million)
Table 36 Others (Hybrid): Market Size, By Region, 2018–2025 (‘000 Units)
Table 37 Others (Hybrid): Market Size, By Region, 2018–2025 (USD Million)
Table 38 Market, By Level of Autonomous Driving, 2018–2025 (‘000 Units)
Table 39 Market, By Level of Autonomous Driving, 2018–2025 (USD Million)
Table 40 Conventional Level of Driving: Market, By Region, 2018–2025 (‘000 Units)
Table 41 Conventional Level of Driving: Market, By Region, 2018–2025 (USD Million)
Table 42 Semi-Autonomous Level of Driving: Market, By Region, 2018–2025 (‘000 Units)
Table 43 Semi-Autonomous Level of Driving: Market, By Region, 2018–2025 (USD Million)
Table 44 Market, By Vehicle Type, 2018-2025 (‘000 Units)
Table 45 Market, By Vehicle Type, 2018-2025 (USD Million)
Table 46 Market, By Region, 2018-2025 (‘000 Units)
Table 47 Augmented Reality Automotive Market, By Region, 2018-2025 (USD Million)
Table 48 Asia-Oceania: Market, By Country, 2018–2025 (‘000 Units)
Table 49 Asia-Oceania: Market, By Country, 2018–2025 (USD Million)
Table 50 Asia-Oceania: Market, By Vehicle Type, 2018–2025 (000’ Units)
Table 51 Asia-Oceania: Market, By Vehicle Type, 2018–2025 (USD Million)
Table 52 China: Market, By Vehicle Type, 2018–2025 (‘000 Units)
Table 53 China: Market, By Vehicle Type, 2018–2025 (USD Million)
Table 54 India: Market, By Vehicle Type, 2018–2025 (‘000 Units)
Table 55 India: Market, By Vehicle Type, 2018–2025 (USD Million)
Table 56 Japan: Market, By Vehicle Type, 2018–2025 (‘000 Units)
Table 57 Japan: Market, By Vehicle Type, 2018–2025 (USD Million)
Table 58 South Korea: Market, By Vehicle Type, 2018-2025 (‘000 Units)
Table 59 South Korea: Market, By Vehicle Type, 2018-2025 (USD Million)
Table 60 Rest of Asia-Oceania: Market, By Vehicle Type, 2018–2025 (‘000 Units)
Table 61 Rest of Asia-Oceania: Market, By Vehicle Type, 2018–2025 (USD Million)
Table 62 Europe: Market, By Country, 2018–2025 (‘000 Units)
Table 63 Europe: Market, By Country, 2018–2025 (USD Million)
Table 64 Europe: Market, By Vehicle Type, 2018–2025 (000’ Units)
Table 65 Europe: Market, By Vehicle Type, 2018–2025 (USD Million)
Table 66 France: Market, By Vehicle Type, 2018–2025 (‘000 Units)
Table 67 France: Market, By Vehicle Type, 2018–2025 (USD Million)
Table 68 Germany: Market, By Vehicle Type, 2018–2025 (‘000 Units)
Table 69 Germany: Market, By Vehicle Type, 2018–2025 (USD Million)
Table 70 Italy: Market, By Vehicle Type, 2018–2025 (‘000 Units)
Table 71 Italy: Market, By Vehicle Type, 2018–2025 (USD Million)
Table 72 U.K.: Market, By Vehicle Type, 2018–2025 (‘000 Units)
Table 73 U.K.: Market, By Vehicle Type, 2018–2025 (USD Million)
Table 74 Rest of Europe: Market, By Vehicle Type, 2018–2025 (‘000 Units)
Table 75 Rest of Europe: Market, By Vehicle Type, 2018–2025 (USD Million)
Table 76 North America: Market, By Country, 2018–2025 (‘000 Units)
Table 77 North America: Market, By Country, 2018–2025 (USD Million)
Table 78 North America: Market, By Vehicle Type, 2018–2025 (‘000 Units)
Table 79 North America: Market, By Vehicle Type, 2018–2025 (USD Million)
Table 80 Canada: Market, By Vehicle Type, 2018–2025 (‘000 Units)
Table 81 Canada: Market, By Vehicle Type, 2018–2025 (USD Million)
Table 82 Mexico: Market, By Vehicle Type, 2018–2025 (‘000 Units)
Table 83 Mexico: Market, By Vehicle Type, 2018–2025 (USD Million)
Table 84 U.S.: Market, By Vehicle Type, 2018–2025 (‘000 Units)
Table 85 U.S.: Market, By Vehicle Type, 2018–2025 (USD Million)
Table 86 RoW: Market, By Country, 2018–2025 (‘000 Units)
Table 87 RoW: Market, By Country, 2018–2025 (USD Million)
Table 88 RoW: Market, By Vehicle Type, 2018–2025 (‘000 Units)
Table 89 RoW: Market, By Vehicle Type, 2018-2025(USD Million)
Table 90 Brazil: Market, By Vehicle Type, 2018-2025(‘000 Units)
Table 91 Brazil: Market, By Vehicle Type, 2018-2025(USD Million)
Table 92 Russia: Market, By Vehicle Type, 2018-2025(‘000 Units)
Table 93 Russia: Market, By Vehicle Type, 2018-2025(USD Million)
Table 94 South Africa: Market, By Vehicle Type, 2018-2025 (‘000 Units)
Table 95 South Africa: Market, By Vehicle Type, 2018-2025 (USD Million)
List of Figures (62 Figures)
Figure 1 Augmented Reality Automotive Market: Research Design
Figure 2 Research Methodology Model
Figure 3 Breakdown of Primary Interviews: By Company Type, Designation, & Region
Figure 4 Global Luxury Vehicle Sales 2015 vs 2016
Figure 5 Market: Bottom-Up Approach
Figure 6 Market: Top Down Approach
Figure 7 Data Triangulation
Figure 8 Market, By Function, 2018–2025 (Value)
Figure 9 Market, By Sensor Technology, 2020 vs 2025 (Value)
Figure 10 Market, By Region, 2020–2025
Figure 11 Market, By Display Technologies, 2018-2025 (Value)
Figure 12 Market, By Level of Autonomous Driving, 2020 (Value)
Figure 13 Market, By Electric Vehicle, 2020 vs 2025 (Value)
Figure 14 Market, By Vehicle Type, 2020 (Value)
Figure 15 Advanced AR HUD Estimated to Account for the Largest Share of the Market in 2020
Figure 16 Sensor Fusion is Estimated to Be the Largest Market, in Terms of Value, 2020
Figure 17 North America Estimated to Be the Largest and Fastest Growing Market During the Forecast Period
Figure 18 TFT-LCD is Projected to Be the Largest Display Technology Segment, 2020 vs 2025
Figure 19 BEV Segment is Projected to Witness the Highest Growth During the Forecast Period 2020 vs 2025
Figure 20 Semi-Autonomous Vehicles Segment Projected to Witness the Highest Growth During the Forecast Period, 2020 vs 2025
Figure 21 Passenger Car is Projected to Be the Largest Segment of the Market, 2020
Figure 22 Augmented Reality Automotive Market: Market Dynamics
Figure 23 Global Connected Car Market, 2016 & 2021 (USD Billion)
Figure 24 Projected Increasing Demand for Connected Cars, 2015, 2020 & 2025 (Percentage of Cars Sold)
Figure 25 Recent Investments in the Augmented Reality Industry – Automotive and Others
Figure 26 Connected Car – Advanced Automotive Functions
Figure 27 Global Vehicle Telematics Market, 2016 - 2022 (USD Billion)
Figure 29 Integration of Several Adas Functions in AR HUD
Figure 30 Market: Porter’s Five Forces Analysis
Figure 31 Porter’s Five Forces Analysis: Presence of Established Global Players Increases the Degree of Competition
Figure 32 Threat of New Entrants is Considered Medium Due to High R&D Cost and Capital Investment
Figure 33 Threat of Substitutes in the Automotive Augmented Reality Market is Considered Low Due to Low Availability of Substitutes
Figure 34 Bargaining Power of Suppliers in Market is Considered Medium
Figure 35 Bargaining Power of Buyers in Market is Considered Low
Figure 36 Intensity of Competitive Rivalry to Have A Medium Impact on the Market
Figure 37 Market Growth Prospective: Market (2018-2025)
Figure 38 Market, By Function, 2020 vs 2025 (USD Million)
Figure 39 Market, By Sensor Technology
Figure 40 Market, By Sensor Technology, 2020 vs 2025 (USD Million)
Figure 41 Market, By Display Technology
Figure 42 Market, By Display Technology, 2020 vs 2025 (‘000 Units)
Figure 43 Market, By Electric Vehicle, 2020 vs 2025 (‘000 Units)
Figure 44 Market, By Level of Autonomous Driving
Figure 45 Market, By Level of Autonomous Driving, 2020 vs 2025 (‘000 Units)
Figure 46 Augmented Reality Automotive Market, By Region, 2020 vs 2025
Figure 47 Asia-Oceania: Market Snapshot
Figure 48 Europe: Market, By Country, 2020 vs 2025 (‘000 Units)
Figure 49 North America: Market Snapshot
Figure 50 RoW: Market, By Country, 2020 vs 2025 (‘000 Units)
Figure 51 Robert Bosch GmbH: Company Snapshot
Figure 52 Panasonic Corporation: Company Snapshot
Figure 53 Continental AG: Company Snapshot
Figure 54 Denso Corporation: Company Snapshot
Figure 55 Visteon Corporation: Company Snapshot
Figure 56 Nippon Seiki Co., Ltd.: Company Snapshot
Figure 57 Pioneer Corporation: Company Snapshot
Figure 58 Yazaki Corporation: Company Snapshot
Figure 59 Harman International Industries Inc.: Company Snapshot
Figure 60 Garmin Ltd.: Company Snapshot
Figure 61 Texas Instruments Inc.: Company Snapshot
Figure 62 Microvision, Inc.: Company Snapshot


Growth opportunities and latent adjacency in Augmented Reality Automotive Market