
Automotive AI Market Size, Share & Trends

Automotive AI Market by Offerings (Compute, Memory, Software), Level of Autonomy (L1, L2, L3, L4, L5), Technology (Deep Learning, ML, Computer Vision, Context-aware Computing, NLP), Application (ADAS, Infotainment, Telematics) - Global Forecast to 2030


OVERVIEW
Source: Secondary Research, Interviews with Experts, MarketsandMarkets Analysis
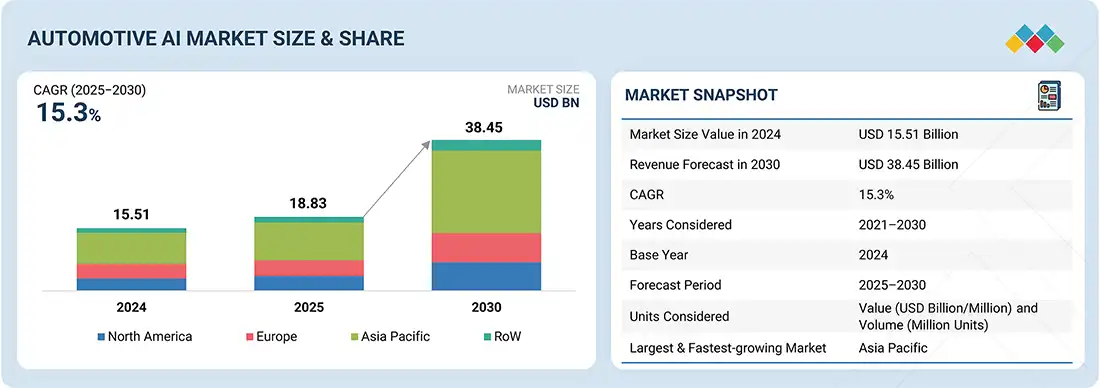
The automotive AI market is projected to reach USD 38.45 billion in 2030 from USD 18.83 billion in 2025, growing at a CAGR of 15.3% from 2025 to 2030. Automotive AI refers to the use of artificial intelligence technologies, such as machine learning, computer vision, and natural language processing, to enable advanced driver assistance, autonomous driving, predictive maintenance, and personalized in-vehicle experiences. The market is driven by the rising demand for autonomous and semi-autonomous vehicles, alongside increasing integration of ADAS features to enhance safety and efficiency. Additionally, growing consumer expectations for connected, intelligent mobility solutions and regulatory pushes for safer driving environments are accelerating adoption.
KEY TAKEAWAYS
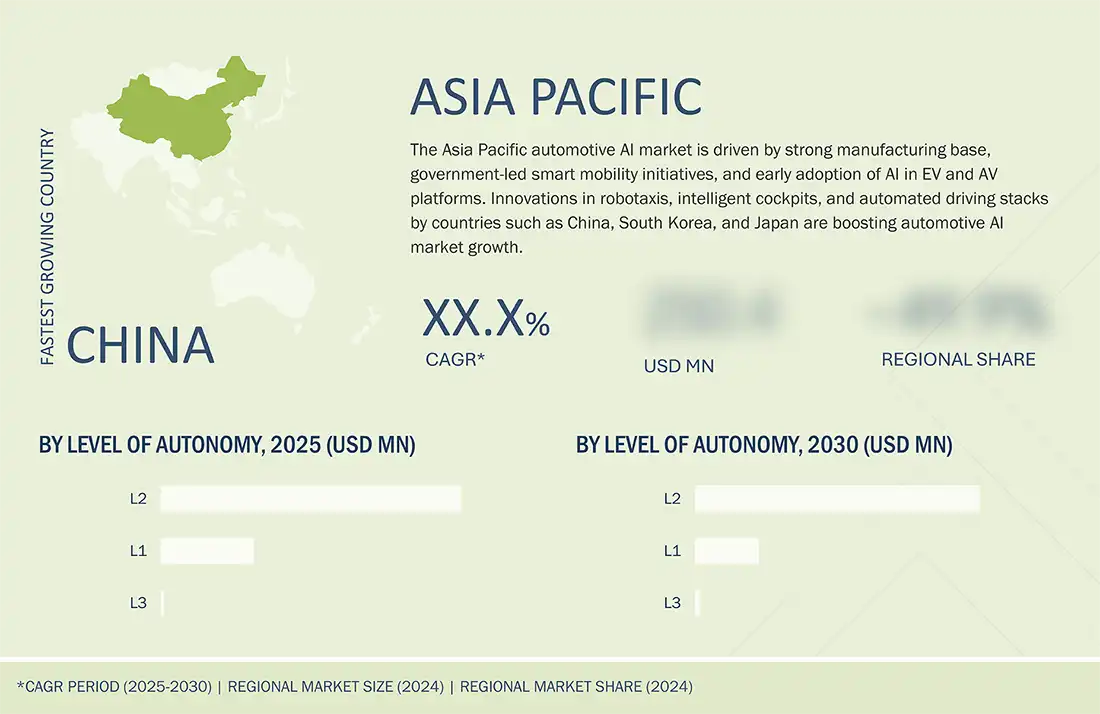
- The Asia Pacific automotive AI market accounted for a 50.9% revenue share in 2024.
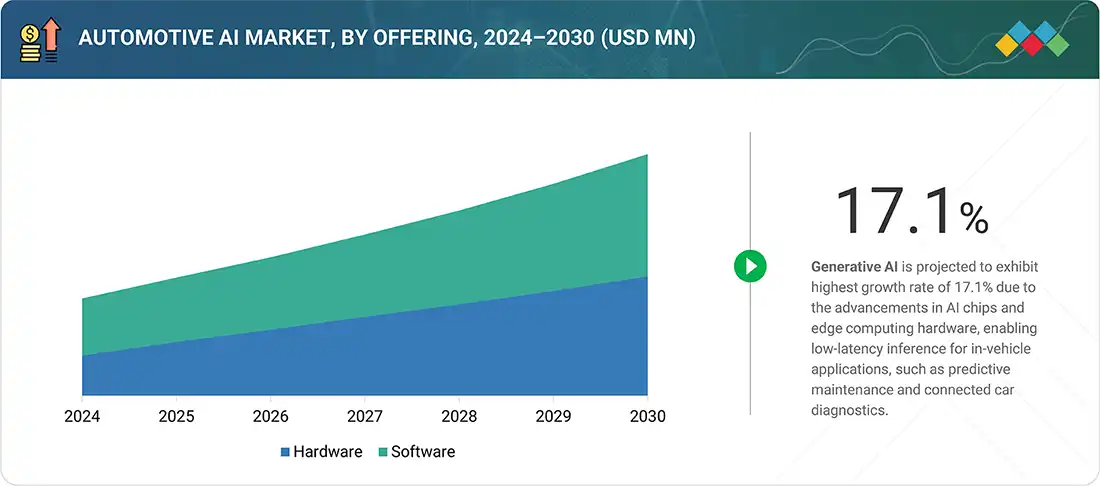
- By offering, the hardware segment is expected to register the highest CAGR of 17.1%.
- By technology, the deep learning segment is expected to dominate the market.
- By level of autonomy, the L3 segment is projected to grow at the fastest rate from 2025 to 2030.
- By application, the vehicle telematics segment is expected to dominate the market, growing at the highest CAGR of 33.8%.
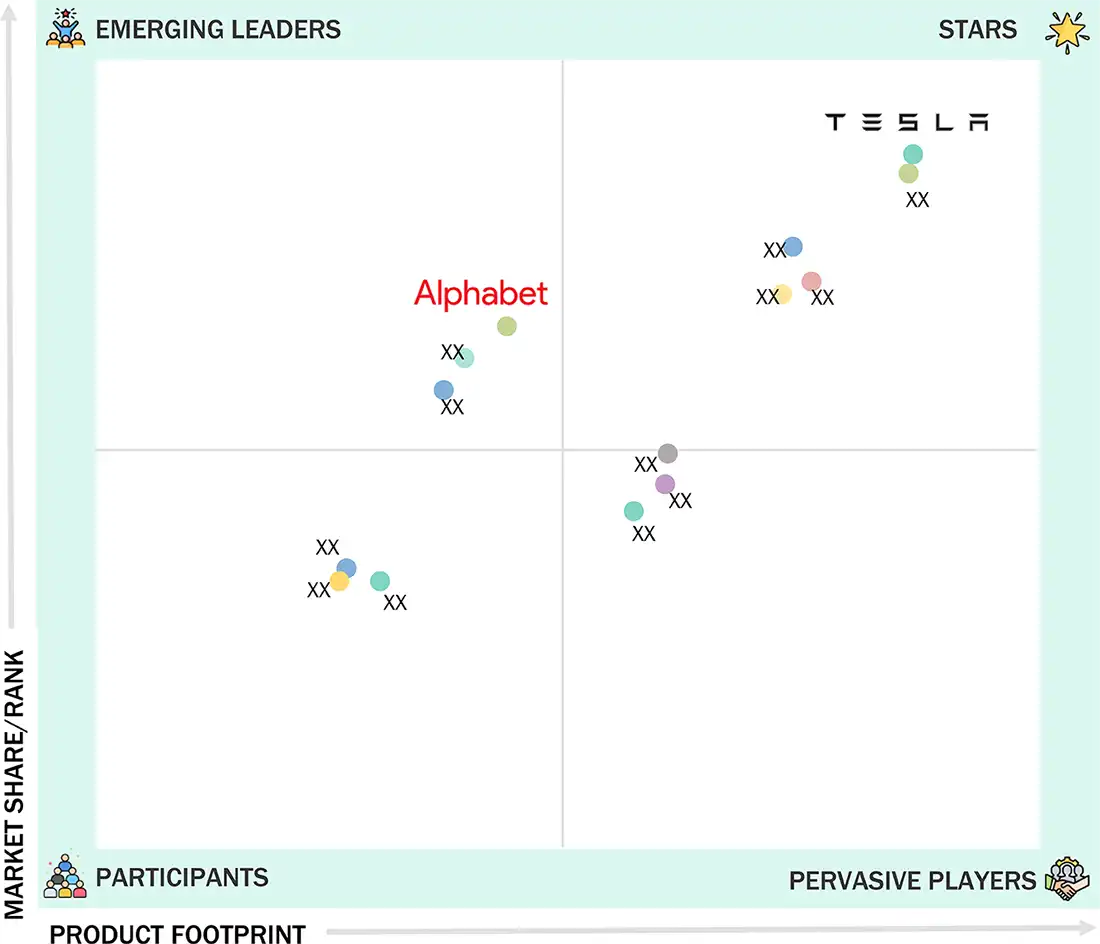
- Tesla, NVIDIA Corporation, Mobileye were identified as some of the star players in the automotive AI market, given their strong market share and product footprint.
- Alphabet Inc. and Aptiv have distinguished themselves among startups and SMEs by securing strong footholds in specialized niche areas, underscoring their potential as emerging market leaders
The automotive AI market is set for strong expansion over the next decade, underpinned by the growing demand for intelligent, connected, and autonomous vehicles. Rising adoption of ADAS and autonomous driving features and the advancements in deep learning and real-time decision-making hardware accelerate AI integration into the automotive value chain. Additionally, stringent safety regulations, rising consumer expectations for convenience, and government-backed smart mobility initiatives are fueling market growth. As the industry transitions from assisted driving to higher levels of autonomy, AI will be pivotal in shaping next-generation automotive innovation, positioning it as a cornerstone of future mobility ecosystems.
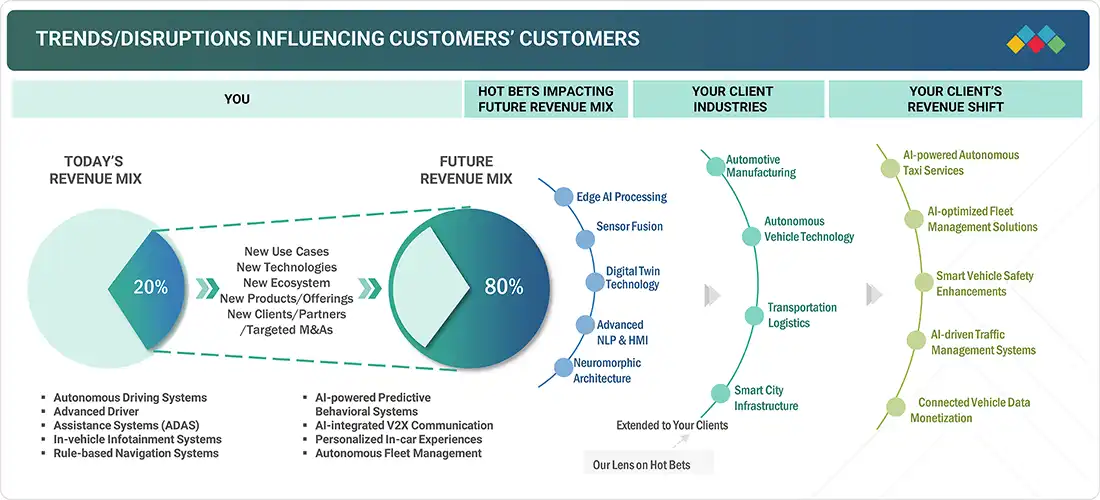
TRENDS & DISRUPTIONS IMPACTING CUSTOMERS' CUSTOMERS
The automotive AI industry is undergoing a significant transformation, driven by disruptive technologies and evolving customer expectations. Traditional revenue sources, such as rule-based navigation systems and standard infotainment solutions, are gradually being replaced by advanced AI-driven innovations. Key trends shaping this shift include edge AI processing, sensor fusion, digital twin technology, advanced natural language processing (NLP), and neuromorphic computing. These "hot bets" are redefining future revenue mixes by enabling capabilities like AI-powered predictive behavioral systems, AI-integrated V2X communication, and personalized in-car experiences. As these technologies mature, they are extending their impact beyond core automotive manufacturing into adjacent domains such as autonomous vehicle technology, transportation logistics, and smart city infrastructure. For clients, this means a strategic revenue shift toward AI-powered autonomous taxi services, fleet management solutions, traffic optimization, and monetization of connected vehicle data. These trends not only accelerate innovation but also demand that businesses realign their offerings and ecosystems around intelligent, scalable, and secure automotive AI solutions.
Source: Secondary Research, Interviews with Experts, MarketsandMarkets Analysis
MARKET DYNAMICS
Level
-
Growing adoption of ADAS technology by OEMs

-
Rising demand for enhanced user experience and convenience features

Level
-
Increase in overall cost of vehicles

-
Threat to vehicle-related cybersecurity

Level
-
Increasing demand for premium vehicles

-
Growing need for sensor fusion

Level
-
Limited real-world testing and validation frameworks

-
AI model explainability and trust issues

Source: Secondary Research, Interviews with Experts, MarketsandMarkets Analysis
Driver: Growing adoption of ADAS technology by OEMs
The rapid integration of advanced driver assistance systems (ADAS) by automotive OEMs is a key driver for the automotive AI market. Features such as adaptive cruise control, lane-keeping assistance, collision avoidance, and automated parking are increasingly becoming standard in mid-range and premium vehicles, propelled by consumer demand for safety and convenience. Regulatory mandates around road safety further accelerate adoption, pushing automakers to embed AI-driven ADAS solutions as differentiators in global markets.
Restraint: Increase in overall cost of vehicles
A major restraint to the widespread adoption of automotive AI lies in the significant cost implications it brings. The integration of AI-powered processors, GPUs, NPUs, and high-end sensors, such as LiDAR and radar, adds to vehicle manufacturing costs, directly impacting affordability for mass-market buyers. For OEMs, balancing cost pressures with innovation remains a challenge, especially in price-sensitive regions where consumers prioritize affordability over advanced features, thereby slowing adoption of AI-driven functionalities.
Opportunity: Growing need for sensor fusion
The increasing complexity of autonomous systems creates a strong opportunity for sensor fusion technologies, where data from cameras, LiDAR, radar, and ultrasonic sensors is combined to deliver precise situational awareness. AI-powered sensor fusion improves object detection, environmental mapping, and decision-making accuracy, making it vital for higher levels of autonomy. OEMs and Tier-1 suppliers are investing heavily in fusion platforms to reduce false positives and enhance reliability, positioning this as a major growth avenue for automotive AI adoption.
Challenge: Limited real-world testing and validation frameworks
One of the most critical challenges facing the automotive AI market is the lack of comprehensive real-world testing and validation frameworks. While AI algorithms perform well in simulated environments, they struggle with edge cases, unpredictable driving conditions, and regional traffic variations. Developing globally scalable validation frameworks is resource-intensive and time-consuming. This limits OEMs from confidently deploying higher autonomy levels, creating a bottleneck for large-scale commercialization of AI-driven self-driving technologies in the near term.
Automotive AI Market: COMMERCIAL USE CASES ACROSS INDUSTRIES
| COMPANY | USE CASE DESCRIPTION | BENEFITS |
|---|---|---|
 |
Implemented generative AI with large multimodal models (LMMs) to extract knowledge from diagram-heavy PowerPoint files and convert them into structured text for reuse in collision-safety vehicle development | 67% reduction in documentation modeling time, 30–50% savings in development and planning work, handbook creation time reduced from three years to one, and improved scalability of knowledge reuse |
 |
Developed the Makalu Computing Platform using AMD processors and GPUs to power immersive in-vehicle digital cockpits supporting 8K/4K displays, 3D HMI, AR/VR, and spatial audio | Delivered 394K DMIPS and 10.1T FLOPS performance, supported 32 GB memory & 8 GB VRAM, enabled AAA gaming and immersive experiences, designed for mass production with integrated safety and power optimization |
|
|
Integrated adaptive SoCs into EyeSight ADAS to deliver advanced AI inference, stereo vision processing, and sensor fusion for real-time safety-critical functions | Up to 3X AI processing power, improved recognition and perception accuracy, support for firmware upgrades, enhanced real-time safety features like braking and steering, positioned Subaru toward 2030 zero-fatality vision |
Logos and trademarks shown above are the property of their respective owners. Their use here is for informational and illustrative purposes only.
MARKET ECOSYSTEM
The automotive AI ecosystem is a dynamic and interconnected network that drives innovation in intelligent vehicle technologies. This ecosystem comprises various key players, including component suppliers who provide essential hardware, software providers who develop advanced algorithms and AI solutions, system integrators who design and integrate platforms, and original equipment manufacturers (OEMs) who incorporate these technologies into vehicles. The synergy among these segments fosters the development of autonomous driving, enhanced safety features, and improved user experiences.
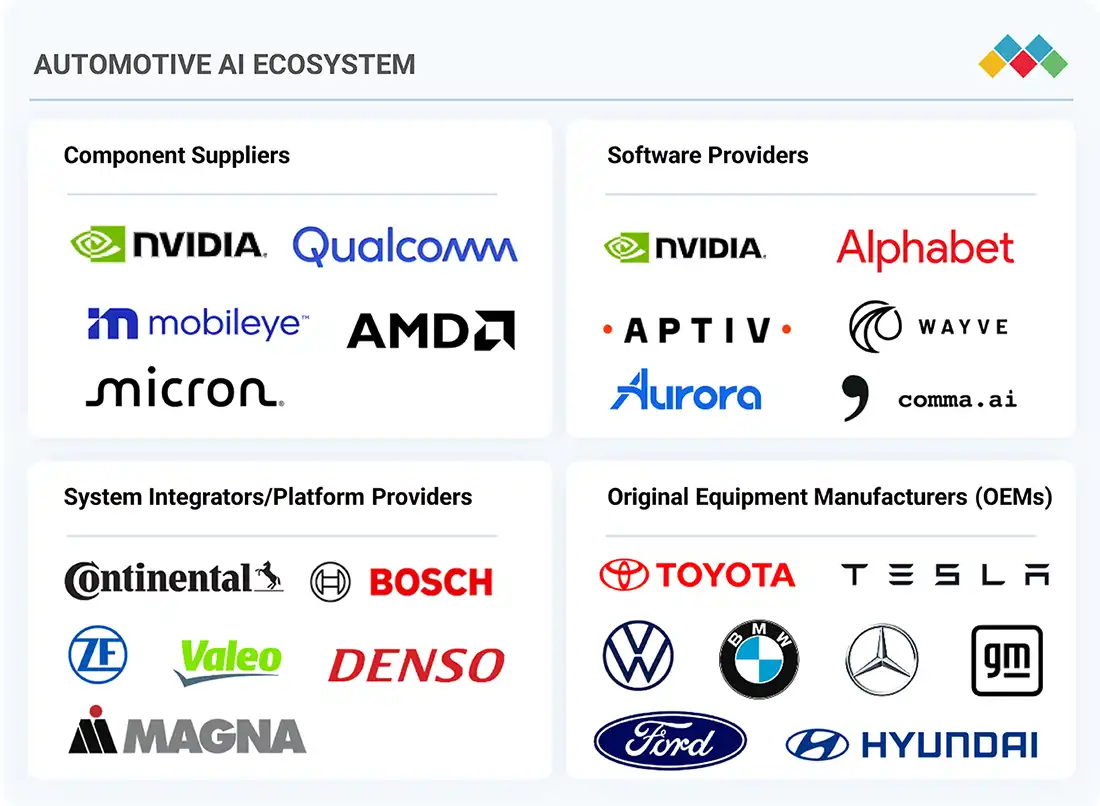
Logos and trademarks shown above are the property of their respective owners. Their use here is for informational and illustrative purposes only.
MARKET SEGMENTS
Source: Secondary Research, Interviews with Experts, MarketsandMarkets Analysis
Automotive AI Market, By Offering
The software segment dominates the automotive AI market, as AI-driven applications rely heavily on middleware, operating systems, and advanced application software to enable autonomous driving, predictive maintenance, and in-vehicle infotainment. OEMs and Tier-1 suppliers increasingly invest in AI-powered software platforms that integrate perception, decision-making, and control. Growing demand for over-the-air (OTA) updates, advanced analytics, and cloud connectivity further boosts adoption.
Automotive AI Market, By Technology
Deep learning leads the automotive AI technology landscape due to its unmatched capability in processing complex driving scenarios, object recognition, and natural language interactions. It underpins key applications such as ADAS, autonomous driving, and driver monitoring systems. The technology’s ability to learn from vast datasets enables continuous improvements in perception accuracy and decision-making. With rapid advancements in neural networks and availability of powerful GPUs/NPUs, deep learning adoption is set to expand at a high rate, becoming the core enabler of next-generation autonomous mobility.
Automotive AI Market, By Level of Autonomy
Level 2 autonomy currently holds the largest market share, driven by widespread adoption of partially automated driving functions such as adaptive cruise control, lane keeping assist, and traffic jam assist. OEMs are aggressively integrating L2 features as standard or optional offerings in mid-range and premium vehicles to enhance driver convenience and safety. Consumer acceptance of semi-automated features, combined with regulatory encouragement for ADAS adoption, reinforces the dominance of L2 systems.
Automotive AI Market, By Application
Advanced driver assistance systems (ADAS) dominate the automotive AI market, with features such as automatic emergency braking, lane departure warning, and blind spot detection becoming mainstream. OEMs integrate ADAS not only to comply with safety regulations but also to differentiate products in competitive markets. Rising consumer demand for safer driving experiences, coupled with falling sensor costs and AI-powered perception systems, drives growth.
REGION
Asia Pacific to be fastest-growing region in global automotive AI market during forecast period
Asia Pacific leads the automotive AI market, fueled by strong automotive production in China, Japan, South Korea, and India. Regional OEMs are aggressively investing in AI-driven ADAS, electric vehicles, and connected car platforms. Government initiatives promoting smart mobility, safety regulations mandating ADAS, and rapid expansion of 5G infrastructure further accelerate adoption. With a growing middle-class consumer base demanding advanced safety and convenience features, the region is expected to witness the fastest growth, consolidating its leadership position in the global automotive AI landscape.
Automotive AI Market: COMPANY EVALUATION MATRIX
In the automotive AI market matrix, Tesla leads with a strong market presence and advanced AI integration across autonomous driving, ADAS, and connected vehicle platforms, driving large-scale adoption of next-generation mobility solutions. Alphabet Inc., through its Waymo division, is gaining traction with innovative autonomous driving technologies and pilot programs, particularly in ride-hailing and robo-taxi services.
Source: Secondary Research, Interviews with Experts, MarketsandMarkets Analysis
KEY MARKET PLAYERS - Top Automotive AI Companies
MARKET SCOPE
| REPORT METRIC | DETAILS |
|---|---|
| Market Size in 2024 (Value) | USD 15.51 Billion |
| Market Forecast in 2030 (Value) | USD 38.45 Billion |
| Growth Rate | CAGR of 15.3% from 2025–2030 |
| Years Considered | 2021–2030 |
| Base Year | 2024 |
| Forecast Period | 2025–2030 |
| Units Considered | Value (USD Million/Billion) and Volume (Million Units) |
| Report Coverage | Revenue Forecast, Company Ranking, Competitive Landscape, Growth Factors, and Trends |
| Segments Covered |
|
| Regional Scope | North America, Europe, Asia Pacific, and RoW |
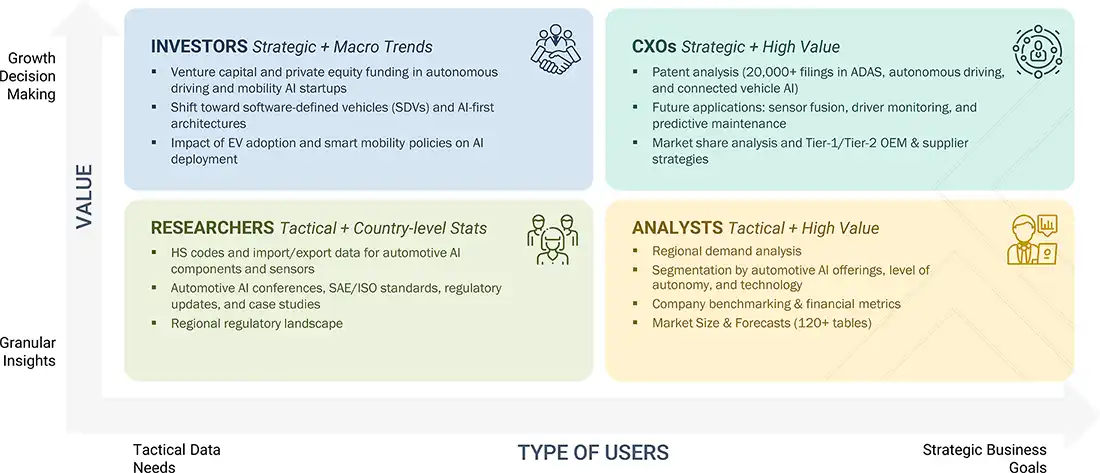
WHAT IS IN IT FOR YOU: Automotive AI Market REPORT CONTENT GUIDE
DELIVERED CUSTOMIZATIONS
We have successfully delivered the following deep-dive customizations:
| CLIENT REQUEST | CUSTOMIZATION DELIVERED | VALUE ADDS |
|---|---|---|
| Global Automotive OEM | • Competitive benchmarking of ADAS and autonomous driving AI platforms across leading OEMs and Tier-1 suppliers • Roadmap analysis for L2–L5 automation adoption • Partner ecosystem mapping (chipmakers, cloud providers, and software vendors) | • Identify leadership gaps in AI-enabled ADAS • Detect partnership white spaces for autonomy scaling • Enable strategic roadmap alignment for next-gen vehicles |
| Tier-1 Automotive Supplier | • Evaluation of AI hardware adoption (GPU, FPGA, ASIC, and NPU) in automotive electronics • Cost-performance benchmarking of AI accelerators • Forecast of in-vehicle AI compute requirements by 2030 | • Optimize R&D investment focus • Pinpoint cost-effective AI chip solutions • Strengthen positioning as preferred Tier-1 supplier for OEMs |
| EV Manufacturer | • AI integration analysis for EV-specific applications (battery management, powertrain optimization, and predictive maintenance) • Competitive insights into AI-enabled EV platforms • Forecast of AI-driven efficiency gains in EV lifecycle | • Support entry into AI-powered EV ecosystem • Identify long-term cost savings via predictive AI • Enhance customer experience with AI-driven EV performance |
| Automotive SoC Provider | • Market entry roadmap for automotive AI compute hardware • Regional demand mapping for AI chipsets in ADAS & infotainment • Analysis of OEM preferences for architectures | • Accelerate automotive AI chipset adoption • Detect regional OEM demand hotspots • Enable chipset positioning for autonomy and infotainment |
| Automotive AI Software Startup | • Market entry strategy for AI-based middleware and operating systems • Benchmarking software adoption trends across OEMs & Tier-1s • Competitive profiling of incumbents in automotive AI software | • Support scaling into OEM supply chain • Highlight niche opportunities in middleware & edge AI • Secure early positioning in the fast-growing software-defined vehicle market |
RECENT DEVELOPMENTS
- June 2025 : Micron Technology, Inc. (US) partnered with the US Department of Commerce (US) for a USD 200 billion investment to build memory chip manufacturing facilities in Idaho and New York, creating over 90,000 jobs. This supports automotive AI by enhancing domestic DRAM production critical for AI systems.
- March 2025 : NVIDIA Corporation (US) unveiled NVIDIA Halos, an all-encompassing safety system designed to accelerate the secure development of autonomous vehicles (AVs). Halos integrates NVIDIA's extensive range of automotive safety hardware and software solutions with its advanced AI research in AV safety.
- March 2025 : Mobileye (Israel) and Valeo (France) collaborated with Volkswagen Group (Germany) to enhance the advanced driver assistance systems in its upcoming MQB-based vehicles to Level 2+ ('enhanced partially automated driving'). This collaboration aims to boost safety and driving comfort in high-volume cars by integrating features like hands-free driving, traffic jam assist, and parking assist, while streamlining procurement and improving efficiency.
- January 2025 : Google (US) and Mercedes-Benz Group AG (Germany) expanded their partnership to enhance the MBUX Virtual Assistant. They will use Google Cloud's new Automotive AI Agent, powered by Gemini on Vertex AI, to provide Mercedes-Benz owners with more detailed and personalized conversational responses about navigation and points of interest.
- October 2024 : Qualcomm Technologies, Inc. (US) unveiled Snapdragon Cockpit Elite, an AI-powered chip designed for next-generation vehicle dashboards. Leveraging the Hexagon NPU with 12x AI performance, it enables generative AI-driven in-cabin experiences, including advanced voice assistants, immersive multimedia, optimized gaming, and 3D graphics.
Table of Contents
 Exclusive indicates content/data unique to MarketsandMarkets and not available with any competitors.
Methodology
The study involved four major activities in estimating the current size of the automotive AI market. Exhaustive secondary research collected information on the market, peer, and parent markets. The next step was to validate these findings, assumptions, and sizing with industry experts across the value chain through primary research. Both top-down and bottom-up approaches were employed to estimate the complete market size. After that, market breakdown and data triangulation techniques were used to estimate the market size of segments and subsegments.
Secondary Research
The secondary research process has referred to various secondary sources to identify and collect necessary information for this study. The secondary sources include annual reports, press releases, and investor presentations of companies; white papers; journals and certified publications; and articles from recognized authors, websites, directories, and databases. Secondary research was conducted to obtain critical information about the industry’s supply chain, the market’s value chain, the total pool of key players, market segmentation according to the industry trends (to the bottom-most level), regional markets, and key developments from market- and technology-oriented perspectives. Secondary data was collected and analyzed to determine the overall market size, which was further validated through primary research.
Primary Research
Extensive primary research was conducted after gaining knowledge about the current scenario of the automotive AI market through secondary research. Several primary interviews were conducted with experts from the demand and supply sides across four major regions: North America, Europe, Asia Pacific, and RoW. This primary data was collected through questionnaires, emails, and telephone interviews.

Notes: Other designations include technology heads, media analysts, sales managers, marketing managers, and product managers.
The three tiers of the companies are based on their total revenues as of 2024; Tier 1: >USD 1 billion, Tier 2: USD 500 million–1 billion, and Tier 3: USD 500 million.
To know about the assumptions considered for the study, download the pdf brochure
Market Size Estimation
Both top-down and bottom-up approaches were used to estimate and validate the totalIn the complete market engineering process, top-down and bottom-up approaches and several data triangulation methods were used to estimate and forecast the overall market segments and subsegments listed in this report. Key players in the market were identified through secondary research, and their market shares in the respective regions were determined through primary and secondary research. This entire procedure includes the study of annual and financial reports of the top market players and extensive interviews for key insights (quantitative and qualitative) with industry experts (CEOs, VPs, directors, and marketing executives).
All percentage shares, splits, and breakdowns were determined using secondary sources and verified through primary sources. All the parameters affecting the markets covered in this research study were accounted for, viewed in detail, verified through primary research, and analyzed to obtain the final quantitative and qualitative data. This data was consolidated and supplemented with detailed inputs and analysis from MarketsandMarkets and presented in this report.
Automotive AI Market : Top-Down and Bottom-Up Approach

Data Triangulation
After arriving at the overall market size, the market was split into several segments and subsegments using the market size estimation processes explained above. Data triangulation and market breakdown procedures were employed to complete the entire market engineering process and determine the exact statistics of each market segment and subsegment. The data was triangulated by studying various factors and trends from the demand and supply sides in the automotive AI market.
Market Definition
The automotive AI market refers to the integration and deployment of artificial intelligence technologies across various systems and functions within vehicles to enable intelligent, automated, and data-driven mobility. It encompasses the use of AI in autonomous driving (AD) and advanced driver assistance systems (ADAS), infotainment, vehicle telematics, and other domains such as body control, comfort systems, engine management, and powertrain optimization. These applications leverage technologies such as machine learning, deep learning, computer vision, natural language processing, and context-aware computing to enhance decision-making, improve driver and passenger safety, optimize vehicle performance, and deliver personalized in-vehicle experiences.
Key Stakeholders
- Government bodies and policymakers
- Industry organizations, forums, alliances, and associations
- Market research and consulting firms
- Raw material suppliers and distributors
- Research institutes and organizations
- Traders and suppliers
- Raw material suppliers
- System integrators
- AI solution providers
- AI platform providers
- Original equipment manufacturers (OEMS)
- OEM technology solution providers
- Technology, service, and solution providers
- Intellectual property (IP) core and licensing providers
- Suppliers and distributors
- Forums, alliances, and associations
- Technology investors
- Research institutes and organizations
- Analysts and strategic business planners
- Market research and consulting firms
Report Objectives
- To describe and forecast the automotive AI market, by offering, architecture, technology, level of autonomy, application, and region
- To forecast the automotive AI market by offering in terms of volume
- To provide the market size estimation for North America, Europe, Asia Pacific, and Rest of the World (RoW), along with their respective country-level market sizes, in terms of value
- To provide detailed information regarding the drivers, restraints, opportunities, and challenges influencing the market growth
- To provide value chain analysis, ecosystem analysis, case study analysis, patent analysis, trade analysis, technology analysis, pricing analysis, key conferences and events, key stakeholders and buying criteria, Porter’s Five Forces analysis, regulations, and impact of US tariff pertaining to the market
- To strategically analyze micromarkets1 with regard to individual growth trends, prospects, and contributions to the total market
- To analyze opportunities for stakeholders by identifying high-growth segments of the market
- To strategically profile the key players, comprehensively analyze their market positions in terms of ranking and core competencies2, and provide a competitive market landscape
- To analyze strategic approaches, such as product launches, expansions, and partnerships, in the automotive AI market
- To analyze the impact of the macroeconomic outlook for each region
Available customizations:
With the given market data, MarketsandMarkets offers customizations according to the specific requirements of companies. The following customization options are available for the report:
Country-wise Information:
- Country-wise breakdown for North America, Europe, Asia Pacific, and Rest of the World
Company Information:
- Detailed analysis and profiling of additional market players (up to five)
Key Questions Addressed by the Report
Which are the major companies in the automotive AI market?
Major companies in the automotive AI market are Tesla (US), NVIDIA Corporation (US), Mobileye (Israel), Qualcomm Technologies, Inc. (US), and Advanced Micro Devices, Inc. (US).
Which application in the automotive AI market is likely to hold the largest market share during the forecast period?
The autonomous driving (AD)/advanced driver assistance systems (ADAS) application is expected to hold the largest market share due to its critical role in enabling real-time perception, decision-making, and vehicle control for enhanced safety and autonomous driving functionality.
Which level of autonomy in the automotive AI market is likely to drive the growth over the coming years?
Level 3 autonomy will drive the growth of the automotive AI market as it marks a key transition point where vehicles can make informed driving decisions without human input under certain conditions, demanding advanced AI capabilities.
What are the drivers and opportunities for the automotive AI market?
Growing adoption of ADAS technology by OEMS, rising demand for enhanced user experience and convenience features, increasing demand for premium vehicles, and growing need for sensor fusion are the major drivers and opportunities for the automotive AI market.
What are the restraints and challenges for the players in the automotive AI market?
Increase in the overall cost of vehicles, threat to vehicle-related cybersecurity, limited real-world testing and validation frameworks, and AI model explainability and trust issues are the key challenges faced by the market players.
Need a Tailored Report?
Customize this report to your needs
Get 10% FREE Customization
Customize This ReportPersonalize This Research
- Triangulate with your Own Data
- Get Data as per your Format and Definition
- Gain a Deeper Dive on a Specific Application, Geography, Customer or Competitor
- Any level of Personalization
Let Us Help You
- What are the Known and Unknown Adjacencies Impacting the Automotive AI Market
- What will your New Revenue Sources be?
- Who will be your Top Customer; what will make them switch?
- Defend your Market Share or Win Competitors
- Get a Scorecard for Target Partners

Custom Market Research Services
We Will Customise The Research For You, In Case The Report Listed Above Does Not Meet With Your Requirements
Get 10% Free Customisation


Growth opportunities and latent adjacency in Automotive AI Market