Automated Fare Collection Market by Application (Rail and Transport, Parking), by Service Type (Consulting, System Implementation), by Technology, by Industry, by Region - Global Forecast to 2021


[157 Pages Report] AFC is generally used to replace public transportation tickets printed on paper with electronic tickets. AFC system designed for public transportation and micro-payment operations is a stored value-based, contactless smart card application, which can be augmented with the mobile ticketing application. AFC is generally used to easily collect the usage data by automatically logging transactions, for better planning and optimization of services, flexible pricing schemes, easy access to combined services, and customer convenience. AFC prevents illegal generation and manipulation of data stored on cards. It prevents reading from one card and writing on another one. It prevents the cloning of cards.
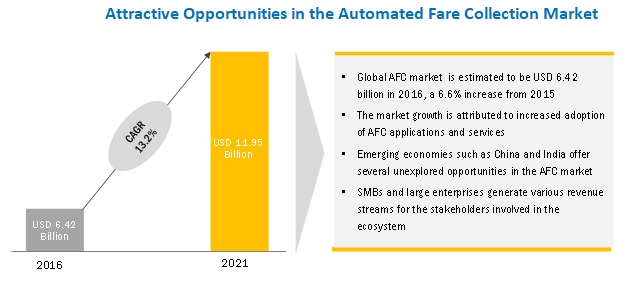
The overall AFC market size is expected to grow from USD 6.42 billion in 2016 to USD 11.95 billion by 2021, at a Compound Annual Growth Rate (CAGR) of 13.2% during the forecast period. Compatible features and better accessibility to the AFC network are some of the factors that are expected to drive the adoption trends of AFC in the coming years. The need for solutions that allow congestion-free traffic and reduce environmental pollution avenues in organizations is expected to drive the adoption trends of AFC in the years to come. Rising usage of AFC solutions has further increased the adoption of AFC services.
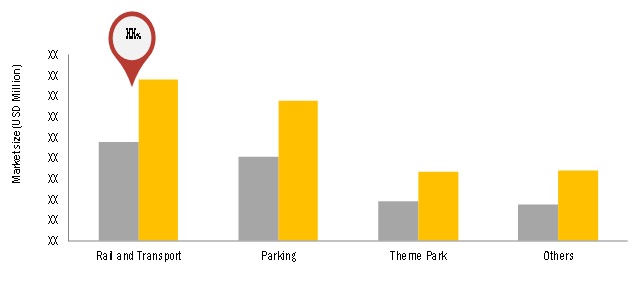
The Rail and Transport sub-segment in the application segment is expected to hold the largest market size during the forecast period
The dominant force driving the adoption of AFC is the need among service providers to have products that enable intercity operability, with no revenue leakages
The training, support, and maintenance services segment is expected to have the largest market size during the forecast period
Training, support, and maintenance services include the fundamental topics that will help one understand the more advanced concepts of AFC technologies. It is recommended for business owners, application developers and operators, and other technical professionals who want to have a clear understanding of AFC. The implementation of a proper maintenance regime is essential to the efficient performance of an AFC system. Maintenance and support allow users to perform tasks without any digression. It involves fixing operational issues or performing periodic inspections to avoid the occurrence of any unscheduled or unfocused event. These AFC training, support, and maintenance services enable users to understand the various technological concepts and how to use them effectively.
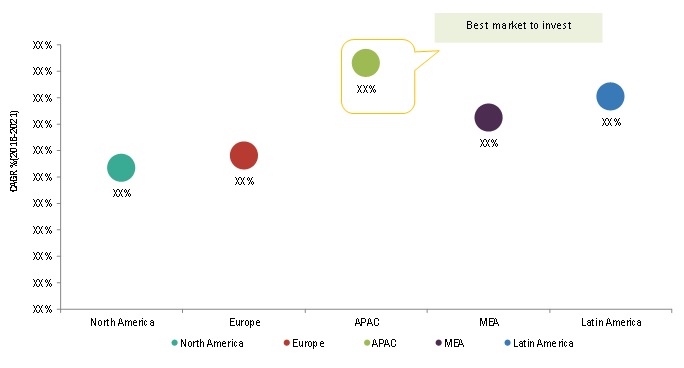
The AFC market in APAC is expected to grow at the highest CAGR from 2016 to 2021
The transportation and logistics, government, and media & entertainment industries are the largest adopters of AFC products, mainly due to the presence of large numbers of fare collection systems present within these industries. APAC is the fastest-growing region for the AFC market in most industries, including retail, media & entertainment, and government.
Market Dynamics
Driver: Benefit of cashless travel facility
The facility of cashless travel can be obtained with the AFC system as it directly debits from a bank account of the driver/owner of a car, for the services used by the owner. This gives them the freedom and convenience to travel as and when they want without the need to carry cash around. Nowadays, the trend is shifting toward card payments, where making payments through debit and credit cards has become very common. This is a strong driver of the AFC system, and its impact is medium at present.
Restraint: High installation cost
One of the major factors limiting the growth of the AFC system market is the high installation cost. AFC system installation requires a higher cost than other toll collection systems, such as manual tolling. The system also requires high maintenance, which further increases the expenses. In the traditional method, the expenses are compensated either by tax payment on fuel or rubber or by a budget allocation from the national income. An AFC system comprises equipment and products based on advanced technologies, making the system complex and expensive. The system gives a solution to traffic congestion issues; however, it simultaneously increases the cost of the tolling process, which ultimately increases the toll price. Moreover, a large centralized Traffic Management Centre (TMC) is required to be co-located with transportation managers, system operators, dispatchers, and response agencies in the AFC system. All these lead to a huge investment.
Thus, it has become essential to consider other control strategies to decrease the overall system cost to a reasonable level without compromising the system performance or modifying the public perception of the services offered. The implementation of AFC includes installation of Closed Circuit Television (CCTV) cameras, microwave detectors, Dynamic Message Signs (DMS), Advanced Traveler Information System (ATIS), Highway Advisory Radio (HAR), and others; for example, Mobile Data Terminals (MDTs) are an important component of the transit fleet management systems. The impact of this restraint is high at present but is expected to decrease in the coming years.
Opportunity: Shift toward open road tolling
AFC systems are installed on most of the roads in developed countries and are also being installed in developing countries to a great extent. The ORT system enables free-flow tolling and avoids the necessity of toll booths at toll plazas. This not only reduces the infrastructure and labor cost, but also helps in avoiding traffic congestion. According to subject matter experts, most of the upcoming toll projects of different countries are based on ORT. The impact of this opportunity is high.
Challenge: Lack of interoperability and standardization among automated fare collection products
Uniformity in the implementation of various AFC systems is an issue; for instance, an electronic toll collection On-Board Unit (OBU) does not have any display and only performs validation functions. Besides, it cannot receive or transmit any message. Moreover, every country has a different type of OBU device. The major problem in implementing AFC is integration with IT. The implementation and significant use of IT is a process of interrelated steps. Any error or redundancy in any of the stages during the implementation reduces its efficiency. In 2014, the European Commission introduced a new standard for AFCs: EN 302 637 3, which defines the Decentralized Environmental Notification (DEN) basic service that supports road hazard warning; this European standard is different from the US standard. DEN provides information related to a road hazard or an abnormal traffic condition, including AFC type and position. Typically, for an AFC application, a message is circulated to AFC stations that are located within a geographic area through direct V2V or V2I communication to alert drivers regarding a potentially dangerous event.
Scope of the Report
|
Report Metric |
Details |
|
Market size available for years |
2014�2021 |
|
Base year considered |
2015 |
|
Forecast period |
2016�2021 |
|
Forecast units |
USD million |
|
Segments covered |
Application, Service Type, Vertical, Technology Type,and Region |
|
Geographies covered |
North America, Europe, Asia-Pacific, Middle East & Africa, and Latin America |
|
Companies covered |
Cubic Corporation (US), Indra Sistemas (Spain), Thales (France), GMV (Spain), ST Electronics (Singapore), ATOS (France), Longbow Technologies S/B (Malaysia), Samsung SDS (Korea), Genfare (US), Advanced Card Systems Ltd. (Hong Kong) |
The automated fare collection market is a broad study of the global market and forecasts the market sizes and trends in the following sub-segments.
By Application:
- Rail and transport
- Parking applications
- Theme park applications
- Others
By Service Type:
- Consulting
- System implementation
- Training, support, and maintenance
- Managed service
By Vertical:
- Transportation and logistics
- Government
- Media and entertainment
- Retail
- Others
By Technology Type:
- Near field communication
- Magnetic stripes
- Others
By Region:
- North America
- Europe
- Asia-Pacific (APAC)
- The Middle East and Africa (MEA)
- Latin America
Note: Others in application include retail application
Others in technology include SMS and OCR
Others in industry include manufacturing, healthcare, and travel & hospitality
Key Market Players
Cubic Corporation (US), Thales (France), Samsung SDS (Korea), ST Electronics (Singapore), ATOS (France)
Recent Developments
- In June 2015, Indra installed a new Telemetry, Tracking and Command station in Papeete (French Polynesia). This enabled Indra to expand the ground segment of the European global positioning system, Galileo. These stations track the position of the orbiting satellites and transmit commands for their control.
- In June 2015, Thales launched TransCity, a cloud-ready range of evolutionary fare collection solutions, destined for public transport systems. TransCity, a web-oriented technology, simplifies both passengers� journeys and operators� day-to-day operations.
- In May 2015, Cubic Corporation�s real-time passenger information system named �NextBus� had a major expansion in the east corner of the Australian State of Queensland. This enables Queensland commuters to accurately track their bus and ferry services in real-time through Passenger Information Displays and on their mobile devices, including smartphones, tablets, or computers, taking the guesswork out of riding public transport.
Critical questions the report answers:
- What are the upcoming trends for the AFC market?
- Which segment in the AFC market provides the most opportunity for growth?
- Who are the leading vendors operating in this market?
- What are the opportunities for new market entrants in the AFC market?
To speak to our analyst for a discussion on the above findings, click Speak to Analyst
 Exclusive indicates content/data unique to MarketsandMarkets and not available with any competitors.
Table of Contents
1 Introduction (Page No. - 15)
1.1 Objectives of the Study
1.2 Automated Fare Collection Market Definition
1.3 Market Scope
1.3.1 Markets Covered
1.3.2 Years Considered for the Study
1.4 Currency
1.5 Limitations
1.6 Stakeholders
2 Research Methodology (Page No. - 18)
2.1 Research Data
2.1.1 Secondary Data
2.1.1.1 Key Content From Secondary Sources
2.1.2 Primary Data
2.1.2.1 Key Content From Primary Sources
2.1.2.2 Key Industry Insights
2.1.2.3 Breakdown of Primary Interviews
2.2 Market Size Estimation
2.2.1 Bottom-Up Approach
2.2.2 Top-Down Approach
2.3 Market Breakdown and Data Triangulation
2.4 Assumptions
3 Executive Summary (Page No. - 26)
4 Premium Insights (Page No. - 31)
4.1 Attractive Market Opportunities in the Market
4.2 Automated Fare Collection Market: Top Three Industries and Regions
4.3 Global Market Industry, By Region (2021)
4.4 Global Market, By Region
4.5 Life Cycle Analysis, By Region, 2016
5 Automated Fare Collection Market Overview (Page No. - 35)
5.1 Introduction
5.2 Market Evolution
5.3 Market Segmentation
5.3.1 By Application
5.3.2 By Industry
5.3.3 By Service Type
5.3.4 By Technology
5.3.5 By Region
5.4 Market Dynamics
5.4.1 Drivers
5.4.1.1 Need for Solutions Enabling Congestion-Free Traffic
5.4.1.2 Rise in Investment Emphasis on Automated Fare Collection By Various Governments
5.4.1.3 Benefit of Cashless Travel Facility
5.4.1.4 Decrease in Environmental Pollution
5.4.2 Restraints
5.4.2.1 High Installation Cost
5.4.2.2 Slow Growth in the Developing and Underdeveloped Countries
5.4.3 Opportunities
5.4.3.1 Requirement for Public-Private Partnerships
5.4.3.2 Shift Toward Open Road Tolling
5.4.4 Challenges
5.4.4.1 Lack of Inter-Operability and Standardization Among Automated Fare Collection Products
6 Automated Fare Collection Market: Industry Trends (Page No. - 45)
6.1 Introduction
6.2 Value Chain Analysis
6.3 Supply Chain Analysis
6.3.1 Key Influencers
6.4 Porter�s Five Forces Analysis
6.4.1 Threat of New Entrants
6.4.2 Threat of Substitutes
6.4.3 Bargaining Power of Suppliers
6.4.4 Bargaining Power of Buyers
6.4.5 Intensity of Competitive Rivalry
6.5 Automated Fare Collection Technologies, Standards, and Associations
6.5.1 Cloud Service
6.5.2 Global Positioning System
6.5.3 Dedicated Short Range Communication (DSRS)
6.5.4 Wireless and Sensor Network
6.5.5 Mobile Telephony
6.5.6 Roadside Camera Recognition
6.5.7 Radiowave and Infrared Beacon
6.5.8 Probe Vehicle
6.5.9 Near-Field Communication and Contactless Payments
6.5.10 Radio-Frequency Identification
6.5.11 Radio Data System-Traffic Message Channel
6.5.12 Cooperative Intelligent Transport System (C-AFC)
6.6 Standards and Associations
6.6.1 International
6.6.2 North America
6.6.3 Europe
6.6.4 Japan
7 Automated Fare Collection Market Analysis, By Application (Page No. - 56)
7.1 Introduction
7.2 Rail and Transport
7.2.1 Ticket Vending Machine
7.2.2 Automatic Collection Gate
7.2.3 Passenger Service Machine
7.2.4 Smart Card Ticketing
7.3 Parking
7.3.1 Parking Entry/Exit Barriers
7.3.2 Auto Pay Machine
7.3.3 Ticket Validating Machine
7.4 Theme Park
7.5 Others
8 Market Analysis, By Service Type (Page No. - 65)
8.1 Introduction
8.2 Consulting
8.3 System Implementation
8.4 Training, Support, and Maintenance
8.5 Managed Services
9 Market Analysis, By Technology (Page No. - 72)
9.1 Introduction
9.2 Near-Field Communication (NFC)
9.3 Magnetic Stripes
9.4 Others
10 Automated Fare Collection Market Analysis, By Industry (Page No. - 77)
10.1 Introduction
10.2 Transportation and Logistics
10.3 Government
10.4 Media and Entertainment
10.5 Retail
10.6 Others
11 Geographic Analysis (Page No. - 83)
11.1 Introduction
11.2 North America
11.2.1 United States
11.2.2 Canada
11.3 Europe
11.4 Asia-Pacific
11.5 Middle East and Africa
11.6 Latin America
12 Competitive Landscape (Page No. - 106)
12.1 Overview
12.2 Competitive Situations and Trends
12.2.1 New Product Launches
12.2.2 Partnerships and Collaborations
12.2.3 Business Expansions
12.2.4 Mergers and Acquisitions
13 Company Profiles (Page No. - 113)
(Overview, Products & Services, Strategies & Insights, Developments and MnM View)*
13.1 Introduction
13.2 Cubic Corporation
13.3 Indra
13.4 Thales Group
13.5 GMV
13.6 ST Electronics
13.7 ATOS
13.8 Longbow Technologies S/B
13.9 Samsung SDS
13.10 Genfare
13.11 Advanced Card Systems Holdings Limited
*Details on Overview, Products & Services, Strategies & Insights, Developments and MnM View Might Not Be Captured in Case of Unlisted Companies.
14 Appendix (Page No. - 146)
14.1 Other Developments
14.1.1 Partnerships and Collaborations, 2013�2015
14.1.2 New Product Launches, 2013�2015
14.1.3 Business Expansions, 2013�2015
14.2 Knowledge Store: MarketsandMarkets� Subscription Portal
14.3 Discussion Guide
14.4 Available Customizations
14.5 Related Reports
List of Tables (66 Tables)
Table 1 Global Automated Fare Collection Market Size and Growth, 2014�2021 (USD Million, Yoy %)
Table 2 Global Market Size, By Component, 2014�2021 (USD Million)
Table 3 Global Automated Fare Collection Main Market Size, 2014�2021 (USD Million)
Table 4 Global Market Size, By Application, 2014�2021 (USD Million)
Table 5 Rail and Transport: Market Size, By Region, 2014�2021 (USD Million)
Table 6 Parking: Market Size, By Region, 2014�2021 (USD Million)
Table 7 Theme Park: Market Size, By Region, 2014�2021 (USD Million)
Table 8 Others: Market Size, By Region, 2014�2021 (USD Million)
Table 9 Global Automated Fare Collection Main Market Size, 2014�2021 (USD Million)
Table 10 Global Automated Fare Collection Market Size, By Service Type, 2014�2021 (USD Million)
Table 11 Consulting: Market Size, By Region, 2014�2021 (USD Million)
Table 12 System Implementation: Market Size, By Region, 2014�2021 (USD Million)
Table 13 Training, Support, and Maintenance: Market Size, By Region, 2014�2021 (USD Million)
Table 14 Managed Services: Market Size, By Region, 2014�2021 (USD Million)
Table 15 Global Market Size, By Technology, 2014�2021 (USD Million)
Table 16 Near Field Communication: Market Size, By Region, 2014�2021 (USD Million)
Table 17 Magnetic Stripes: Market Size, By Region, 2014�2021 (USD Million)
Table 18 Others: Market Size, By Region, 2014�2021 (USD Million)
Table 19 Global Automated Fare Collection Market Size, By Industry, 2014�2021 (USD Million)
Table 20 Transportation and Logistics: Market Size, By Region, 2014�2021 (USD Million)
Table 21 Government: Market Size, By Region, 2014�2021 (USD Million)
Table 22 Media and Entertainment: Market Size, By Region, 2014�2021 (USD Million)
Table 23 Retail: Market Size, By Region, 2014�2021 (USD Million)
Table 24 Others: Market Size, By Region, 2014�2021 (USD Million)
Table 25 Global Market Size, By Region, 2014�2021 (USD Million)
Table 26 Applications: Market Size, By Region, 2014�2021 (USD Million)
Table 27 Services: Market Size, By Region, 2014�2021 (USD Million)
Table 28 North America: Automated Fare Collection Market Size, By Component, 2014�2021 (USD Million)
Table 29 North America: Market Size, By Application 2014�2021 (USD Million)
Table 30 North America: Market Size, By Service Type, 2014�2021 (USD Million)
Table 31 North America: Market Size, By Industry, 2014�2021 (USD Million)
Table 32 North America: Market Size, By Technology, 2014�2021 (USD Million)
Table 33 United States: Market Size, By Component, 2014�2021 (USD Million)
Table 34 United States: Market Size, By Application, 2014�2021 (USD Million)
Table 35 United States: Market Size, By Service Type, 2014�2021 (USD Million)
Table 36 United States: Market Size, By Industry, 2014�2021 (USD Million)
Table 37 United States: Market Size, By Technology, 2014�2021 (USD Million)
Table 38 Canada: Automated Fare Collection Market Size, By Component, 2014�2021 (USD Million)
Table 39 Canada: Market Size, By Application 2014�2021 (USD Million)
Table 40 Canada: Market Size, By Service Type, 2014�2021 (USD Million)
Table 41 Canada: Market Size, By Industry, 2014�2021 (USD Million)
Table 42 Canada: Market Size, By Technology, 2014�2021 (USD Million)
Table 43 Europe: Market Size, By Component, 2014�2021 (USD Million)
Table 44 Europe: Market Size, By Application, 2014�2021 (USD Million)
Table 45 Europe: Market Size, By Service Type, 2014�2021 (USD Million)
Table 46 Europe: Market Size, By Industry, 2014�2021 (USD Million)
Table 47 Europe: Market Size, By Technology, 2014�2021 (USD Million)
Table 48 Asia-Pacific: Automated Fare Collection Market Size, By Component, 2014�2021 (USD Million)
Table 49 Asia-Pacific: Market Size, By Application, 2014�2021 (USD Million)
Table 50 Asia-Pacific: Market Size, By Service Type, 2014�2021 (USD Million)
Table 51 Asia-Pacific: Market Size, By Industry, 2014�2021 (USD Million)
Table 52 Asia-Pacific: Market Size, By Technology, 2014�2021 (USD Million)
Table 53 Middle East and Africa: Market Size, By Component, 2014�2021 (USD Million)
Table 54 Middle East and Africa: Market Size, By Application, 2014�2021 (USD Million)
Table 55 Middle East and Africa: Automated Fare Collection Service Market Size, By Service Type, 2014�2021 (USD Million)
Table 56 Middle East and Africa: Market Size, By Industry, 2014�2021 (USD Million)
Table 57 Middle East and Africa: Market Size, By Technology, 2014�2021 (USD Million)
Table 58 Latin America: Automated Fare Collection Market Size, By Component, 2014�2021 (USD Million)
Table 59 Latin America: Market Size, By Application, 2014�2021 (USD Million)
Table 60 Latin America: Market Size, By Service Type, 2014�2021 (USD Million)
Table 61 Latin America: Market Size, By Industry, 2014�2021 (USD Million)
Table 62 Latin America: Market Size, By Technology, 2014�2021 (USD Million)
Table 63 New Product Launches, 2013�2016
Table 64 Partnerships and Collaborations, 2013�2016
Table 65 Business Expansions, 2013�2016
Table 66 Mergers and Acquisitions, 2013�2016
List of Figures (58 Figures)
Figure 1 Global Automated Fare Collection Market: Research Design
Figure 2 Market Size Estimation Methodology: Bottom-Up Approach
Figure 3 Market Size Estimation Methodology: Top-Down Approach
Figure 4 Market Breakdown and Data Triangulation
Figure 5 GlobalMarket, By Application (2016�2021)
Figure 6 Global Market, By Service Type (2016�2021)
Figure 7 Global Market, By Industry (2016-2021)
Figure 8 Global Market Share: North America is Expected to Hold the Largest Market Share in 2016
Figure 9 Emerging Economies Would Offer Attractive Market Opportunities in the Automated Fare Collection Market During the Forecast Period (2016�2021)
Figure 10 North America is Expected to Hold the Largest Share in the Market in 2016
Figure 11 North America is Expected to Have the Largest Market Share Across Most Industries in 2021
Figure 12 Asia-Pacific is Expected to Grow at the Highest CAGR During the Forecast Period (2016�2021)
Figure 13 Europe and Asia-Pacific are Expected to Show Exponential Growth During the Forecast Period (2016�2021)
Figure 14 Evolution of the Automated Fare Collection Market
Figure 15 Market Segmentation: By Application
Figure 16 Market Segmentation: By Industry
Figure 17 Market Segmentation: By Service Type
Figure 18 Market Segmentation: By Technology
Figure 19 Market Segmentation: By Region
Figure 20 Market: Drivers, Restraints, Opportunities, and Challenges
Figure 21 Value Chain Analysis: Automated Fare Collection Market
Figure 22 Figure 22 Supply Chain Analysis
Figure 23 Porter�s Five Forces Analysis: Diverse Set of Established Players is Increasing the Competition in the Industry
Figure 24 Rail and Transport is Expected to Hold the Largest Market Size During the Forecast Period (2016�2021)
Figure 25 North America is Expected to Dominate the Applications Segment During the Forecast Period (2016�2021)
Figure 26 Asia-Pacific is Expected to Grow at the Highest CAGR for Rail and Transport Application During the Forecast Period (2016�2021)
Figure 27 Asia-Pacific is Expected to Be the Fastest-Growing Region for Parking Application During the Forecast Period (2016�2021)
Figure 28 Asia-Pacific is Expected to Be the Fastest-Growing Region for Theme Park Application During the Forecast Period (2016�2021)
Figure 29 Managed Services Segment is Expected to Grow at the Highest CAGR During the Forecast Period (2016�2021)
Figure 30 North America is Expected to Hold A Major Market Share in Training, Support, and Maintenance Services Segment
Figure 31 Asia-Pacific is Expected to Be the Fastest-Growing Region for Managed Services
Figure 32 Near-Field Communication is Expected to Be the Fastest-Growing Technology Segment in the Automated Fare Collection Market
Figure 33 Magnetic Stripes Technology is Expected to Dominate the Market During the Forecast Period
Figure 34 Transportation & Logistics, Government, and Media & Entertainment Expected to Dominate the Market During the Forecast Period
Figure 35 Asia-Pacific is Expected to Be the Fastest-Growing Region for the Transportation and Logistics Industry
Figure 36 North America Region is Expected to Dominate the Market During the Forecast Period (2016�2021)
Figure 37 Regional Snapshot: Asia-Pacific is Emerging as A New Hotspot
Figure 38 Asia-Pacific: an Attractive Destination for Market
Figure 39 North America Market Snapshot
Figure 40 Asia-Pacific Market Snapshot
Figure 41 Asia-Pacific is Expected to Be the Fastest-Growing Region in the Automated Fare Collection Market
Figure 42 Companies Adopted Merger and Acquisition as the Key Growth Strategy During 2013�2016
Figure 43 Product Mix of Top Five Companies From 2013 to 2016
Figure 44 Market Evaluation Framework: Significant Number of New Product Developments Have Fueled the Growth From 2013 to 2016
Figure 45 Battle for Market Share: New Product Developments Was the Key Strategy During the Forecast Period (2016�2021)
Figure 46 Geographic Revenue Mix of Top Market Players in 2016
Figure 47 Cubic Corporation: Company Snapshot
Figure 48 Cubic Corporation: SWOT Analysis
Figure 49 Indra: Company Snapshot
Figure 50 Indra: SWOT Analysis
Figure 51 Thales Group: Company Snapshot
Figure 52 Thales Group: SWOT Analysis
Figure 53 GMV: SWOT Analysis
Figure 54 ST Electronics: Company Snapshot
Figure 55 ST Electronics: SWOT Analysis
Figure 56 Company Snapshot: ATOS
Figure 57 Samsung SDS: Company Snapshot
Figure 58 ACS: Company Snapshot


Growth opportunities and latent adjacency in Automated Fare Collection Market