Anomaly Detection Market by Solution (Network and User Behavior Anomaly Detection), Technology (Big Data Analytics, Data Mining and Business Intelligence, Machine Learning and Artificial Intelligence), Deployment, Service, Vertical - Global Forecast to 2022


[185 Pages Report] The anomaly detection market size is expected to grow from USD 2.08 Billion in 2017 to USD 4.45 Billion by 2022, at a Compound Annual Growth Rate (CAGR) of 16.4%.
Objectives of the Study
The main objective of the report is to define, describe, and forecast the anomaly detection market size on the basis of components (solutions and services), technology, deployment type, vertical, and region. The report provides detailed information on the major factors (drivers, restraints, opportunities, and challenges) influencing the growth of the market. It attempts to forecast the market size with respect to the 5 main regions, namely, North America, Europe, Asia Pacific (APAC), Middle East and Africa (MEA), and Latin America. The report profiles the key market players and comprehensively analyzes their core competencies. It also tracks and analyzes the competitive developments, such as joint ventures, mergers and acquisitions, and new product developments, in the market.
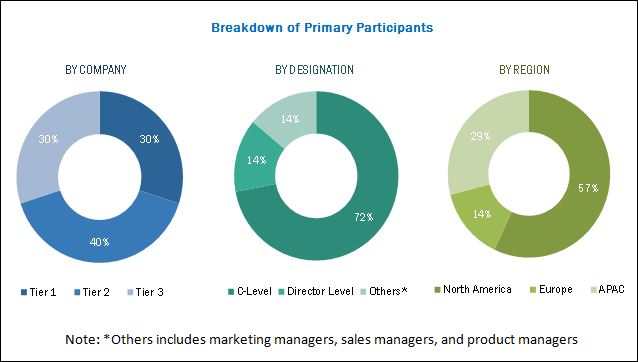
The research methodology used to estimate and forecast the anomaly detection market size began with collection and analysis of data on the key vendor revenues through secondary sources, including annual reports and press releases, investor presentations, conferences and associations (Fraud Analytics Conference 2017, TMA Conference 2017: Network Traffic Measurement and Analytics Conference, and AIE: Advances in Applied Artificial Intelligence), technology journals, certified publications, articles from recognized authors, directories, and databases. The vendor offerings were also taken into consideration to determine the market segmentations. The bottom-up procedure was employed to arrive at the overall market size of the market from the revenue of the key players and their market shares. The anomaly detection market spending across all the regions, along with the geographical split in various verticals, were considered to arrive at the overall market size. After arriving at the overall market size, the total market was split into several segments and sub segments, which were then verified through primary research by conducting extensive interviews with key people, such as Chief Executive Officers (CEOs), Vice Presidents (VPs), directors, and executives. The data triangulation and market breakdown procedures were employed to complete the overall market engineering process and arrive at the exact statistics for all the segments and sub segments. The breakdown of the profiles of the primary participants is depicted in the below figure:
To know about the assumptions considered for the study, download the pdf brochure
The anomaly detection market includes various vendors providing anomaly detection solutions, inclusive of network behavior anomaly detection and user behavior anomaly detection to commercial clients across globe. Companies such as International Business Machines Corporation (US), SAS Institute, Inc. (US), Cisco Systems, Inc. (US), Dell Technologies, Inc. (US), Hewlett Packard Enterprise Company (US), Symantec Corporation (US), Trend Micro, Inc. (Japan), Splunk, Inc. (US), Wipro Limited (India), Securonix, Inc. (US), Gurucul (US), Happiest Minds (India), and Guardian Analytics (US) have adopted partnerships, agreements, and collaborations as the key strategies to enhance their market reach.
Key Target Audience
- Network solution providers
- Data and network security providers
- Cloud service providers
- System integrators
- Third-party software testing service providers
- Managed Security Service Providers (MSSPs)
- Application design and software developers
- Consultancy firms and advisory firms
- Regulatory agencies
- Technology consultants
- Government
The study answers several questions for the stakeholders, primarily, which market segments to focus on in the next 2 to 5 years for prioritizing efforts and investments.
Scope of the Report
The research report segments the anomaly detection market into the following submarkets:
By Component:
- Solutions
- Services
By Solution:
- Network behavior anomaly detection
- User behavior anomaly detection
By Network Behavior Anomaly Detection:
- Network traffic analysis
- Network intelligence and security
- Risk mitigation and management
By User Behavior Anomaly Detection:
- Identity and Access Management (IAM)
- Threat intelligence and management
- Data Loss Prevention (DLP)
- Security Information and Event Management (SIEM)
By Service:
- Professional services
- Managed services
By Technology:
- Big data analytics
- Data mining and business intelligence
- Machine learning and artificial intelligence
By Deployment Type:
- Cloud
- On-premises
- Hybrid
By Vertical:
- Banking, Financial Services, and Insurance (BFSI)
- Retail
- Manufacturing
- IT and telecom
- Defense and government
- Healthcare
- Others (entertainment and education)
By Region:
- North America
- Europe
- APAC
- MEA
- Latin America
Available Customizations
With the given anomaly detection market data, MarketsandMarkets offers customizations as per the company�s specific needs. The following customization options are available for the report:
Geographic Analysis
- Further breakdown of the North American anomaly detection market into the US and Canada
- Further breakdown of the European market into the UK, Germany, and France
Company Information
- Detailed analysis and profiling of additional market players
MarketsandMarkets forecasts the global anomaly detection market size to grow from USD 2.08 Billion in 2017 to USD 4.45 Billion by 2022, at a Compound Annual Growth Rate (CAGR) of 16.4%.
The anomaly detection market is segmented on the basis of components (solutions and services), technologies, deployment types, verticals, and regions. The solutions segment is further segmented into Network Behavior Anomaly Detection (NBAD) and User Behavior Anomaly Detection (UBAD). The NBAD solution segment is further segmented into network traffic analysis, network intelligence and security, and risk mitigation and management. The user behavior anomaly detection solution segment is further categorized into Identity and Access Management (IAM), threat intelligence and management, Data Loss Prevention (DLP) and Security Information and Event Management (SIEM). The service segment is categorized into professional and managed.
The network behavior anomaly detection solution segment is expected to hold the largest market size during the forecast period, as the networking technology advances, the threat from spammers, and attackers and criminal enterprises has also grown accordingly. Additionally, the NBAD solution is used in conventional firewalls and applications for the detection of malware. The technology segment is further categorized into big data analytics, data mining and business intelligence, and machine learning and artificial intelligence. The deployment type segment is categorized into cloud, on-premises, and hybrid. The vertical segment is categorized into Banking, Financial Services, and Insurance (BFSI) retail, manufacturing, IT and telecom, defense and government, and healthcare.
The anomaly detection market is witnessing a traction due to the advent in the growth of data and emergence of High-Performance Data Analytics (HPDA) and increase in cyber espionage and fraudulent activities. The NBAD solution has been instrumental in continuously monitoring a complex network to identify unusual events or trends, or anomalies. They are majorly considered as an integral part of NBAD, which provides an additional layer of security to the existing network. UBAD is based on analyzing the user or entity behavior, and analyzes patterns of human behavior, and then applies algorithms and statistical analysis to detect meaningful anomalies from those generated patterns. It can also predict when an anomalous behavior is likely to occur and identify when a user�s account has been hacked.
The trending technologies, such as big data analytics, data mining and business intelligence, and machine learning and artificial intelligence, play vital roles in the anomaly detection arena. These technologies enable an enterprise to detect anomalies and reduce the risk of data loss and optimization of business processes. The emerging big data analytics-based anomaly detection solutions enable the processing of large volumes of data, learning of normal behavior of complex systems, and detection of anomalous behavior in data. These solutions continuously monitor data and help in the early detection of problems by identifying irregular behaviors.
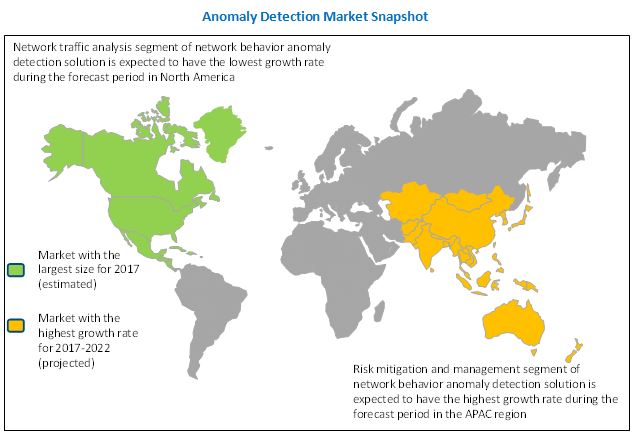
North America is expected to hold the largest market share and dominate the anomaly detection market during the forecast period. The region is witnessing trends, such as Bring Your Own Device (BYOD); increasing adoption of smart connected devices; and Industrial Internet of Everything (IIoE). North America has always topped the list for the most affected region in the world in terms of threats, intrusions, and security breaches, and as a result, it has the largest number of security vendors. Moreover, the increased budgets and grants have invited various big players to make significant investments in this region. These are some important factors driving the growth of the market in North America. Furthermore, the advent of Small and Medium-Sized Enterprises (SMEs) and the startup culture in North America is growing at a faster pace as compared to the other regions.
Asia Pacific (APAC) has witnessed advanced and dynamic adoption of new technologies and always been a lucrative region. The region is expected to grow at the highest CAGR during the forecast period in the anomaly detection market. In addition, owing to the rapid development in IT infrastructure and the adoption of new technologies, such as big data and analytics, augmented reality, industrial Internet of Things (IoT), remote asset management, cloud, and cyber security are driving the growth of the market. Moreover, the increased investments in large-scale infrastructure projects by vendors in the APAC region.
Competition from open-source alternatives hampering the demand for commercial solutions, and lack of skills and expertise are some of the restraining factors for the anomaly detection market. However, the recent developments, new product launches, and acquisitions undertaken by the major market players are boosting the growth of the market.
The study measures and evaluates the major offerings and key strategies of the major market vendors, including International Business Machines Corporation (US), SAS Institute, Inc. (US), Cisco Systems, Inc. (US), Dell Technologies, Inc. (US), Hewlett Packard Enterprise Company (US), Symantec Corporation (US), Trend Micro, Inc. (Japan), Splunk, Inc. (US), Wipro Limited (India), Securonix, Inc. (US), Gurucul (US), Happiest Minds (India), and Guardian Analytics (US). These companies have been at the forefront in offering reliable anomaly detection solutions to commercial clients across diverse locations.
To speak to our analyst for a discussion on the above findings, click Speak to Analyst
 Exclusive indicates content/data unique to MarketsandMarkets and not available with any competitors.
Table of Contents
1 Introduction (Page No. - 17)
1.1 Objectives of the Study
1.2 Anomaly Detection Market Definition
1.3 Market Scope
1.4 Years Considered for the Study
1.5 Currency
1.6 Stakeholders
2 Research Methodology (Page No. - 21)
2.1 Research Data
2.1.1 Secondary Data
2.1.2 Primary Data
2.1.2.1 Breakdown of Primaries
2.1.2.2 Key Industry Insights
2.2 Market Size Estimation
2.2.1 Bottom-Up Approach
2.2.2 Top-Down Approach
2.3 Market Breakdown and Data Triangulation
2.4 Microquadrant Research Methodology
2.4.1 Microquadrant: Weightage Criteria
2.4.2 Quadrant Description
2.4 Research Assumptions
2.5 Limitations
3 Executive Summary (Page No. - 29)
4 Premium Insights (Page No. - 33)
4.1 Attractive Market Opportunities in the Anomaly Detection Market
4.2 Market: Market Share of the Top 3 User Behavior Anomaly Detection Solutions and Regions, 2017
4.3 Lifecycle Analysis, By Region, 2017
4.4 Market, By Region, 2017 vs 2022
4.5 Market Investment Scenario
4.6 Anomaly Detection Market: Top 3 Verticals, 2017�2022
5 Anomaly Detection Market Overview (Page No. - 37)
5.1 Introduction
5.2 Anomaly Detection Market Dynamics
5.2.1 Drivers
5.2.1.1 Growth of Data and Emergence of HPDA
5.2.1.2 Increase in the Adoption of Anomaly Detection Solutions in Software Testing
5.2.1.3 Increase in Cyber Espionage and Fraudulent Activities
5.2.1.4 Rise in Internal Threats Among Enterprises
5.2.2 Restraints
5.2.2.1 Competition From Open-Source Alternatives Hampering the Demand for Commercial Solutions
5.2.2.2 Lack of Skills and Expertise
5.2.3 Opportunities
5.2.3.1 Detection of Anomalies in Streaming Data From Assets, and Optimization of Business Processes
5.2.3.2 Rise in the Adoption of Black Box Trading By Market Traders
5.2.4 Challenges
5.2.4.1 Detection of Asymmetric Faults
5.3 Anomaly Detection Market Adoption By Organization Size
5.3.1 SME�s
5.3.2 Large Enterprises
6 Anomaly Detection Market Analysis, By Component (Page No. - 43)
6.1 Introduction
6.2 Solutions
6.3 Services
7 Anomaly Detection Market Analysis, By Solution (Page No. - 47)
7.1 Introduction
7.2 Network Behavior Anomaly Detection
7.2.1 Network Traffic Analysis
7.2.2 Network Intelligence and Security
7.2.3 Risk Mitigation and Management
7.3 User Behavior Anomaly Detection
7.3.1 Identity and Access Management
7.3.2 Threat Intelligence and Management
7.3.3 Data Loss Prevention
7.3.4 Security Information and Event Management
8 Anomaly Detection Market Analysis, By Service (Page No. - 59)
8.1 Introduction
8.2 Professional Services
8.2.1 Deployment and Integration
8.2.2 Consulting Services
8.2.3 Support and Maintenance
8.3 Managed Services
8.3.1 Managed Network Monitoring and Maintenance
8.3.2 Managed Internet Access and Network Infrastructure Provisioning
8.3.3 Managed Network Security
9 Anomaly Detection Market Analysis, By Technology (Page No. - 65)
9.1 Introduction
9.2 Big Data Analytics
9.2.1 Real-Time Analytics
9.2.2 Data Cleaning
9.3 Data Mining and Business Intelligence
9.3.1 Unsupervised Learning Algorithms
9.3.2 Pattern Recognition Algorithms
9.3.3 Data Visualization and Dashboards
9.3.4 Association Rule Algorithms
9.4 Machine Learning and Artificial Intelligence
9.4.1 Cognitive Learning Algorithms
9.4.2 Hierarchical Temporal Memory Algorithms
9.4.3 Neural Networks
10 Anomaly Detection Market Analysis, By Deployment Type (Page No. - 70)
10.1 Introduction
10.2 On-Premises
10.3 Cloud
10.4 Hybrid
11 Anomaly Detection Market Analysis, By Vertical (Page No. - 75)
11.1 Introduction
11.2 Banking, Financial Services and Insurance
11.3 Retail
11.4 Manufacturing
11.5 IT and Telecom
11.6 Defense and Government
11.7 Healthcare
11.8 Others
12 Geographic Analysis (Page No. - 85)
12.1 Introduction
12.2 North America
12.2.1 By Component
12.2.2 By Solution
12.2.3 By Service
12.2.4 By Technology
12.2.5 By Deployment Type
12.2.6 By Vertical
12.2.7 By Country
12.2.7.1 US
12.2.7.1.1 By Component
12.2.7.1.2 By Solution
12.2.7.1.3 By Service
12.2.7.1.4 By Technology
12.2.7.1.5 By Deployment Type
12.2.7.1.6 By Vertical
12.2.7.2 Canada
12.2.7.2.1 By Component
12.2.7.2.2 By Solution
12.2.7.2.3 By Service
12.2.7.2.4 By Technology
12.2.7.2.5 By Deployment Type
12.2.7.2.6 By Vertical
12.3 Europe
12.3.1 By Component
12.3.2 By Solution
12.3.3 By Service
12.3.4 By Technology
12.3.5 By Deployment Type
12.3.6 By Vertical
12.3.7 By Country
12.3.7.1 UK
12.3.7.1.1 By Component
12.3.7.1.2 By Solution
12.3.7.1.3 By Service
12.3.7.1.4 By Technology
12.3.7.1.5 By Deployment Type
12.3.7.1.6 By Vertical
12.3.7.2 Germany
12.3.7.2.1 By Component
12.3.7.2.2 By Solution
12.3.7.2.3 By Service
12.3.7.2.4 By Technology
12.3.7.2.5 By Deployment Type
12.3.7.2.6 By Vertical
12.3.7.3 France
12.3.7.3.1 By Component
12.3.7.3.2 By Solution
12.3.7.3.3 By Service
12.3.7.3.4 By Technology
12.3.7.3.5 By Deployment Type
12.3.7.3.6 By Vertical
12.3.7.4 Rest of Europe
12.3.7.4.1 By Component
12.3.7.4.2 By Solution
12.3.7.4.3 By Service
12.3.7.4.4 By Technology
12.3.7.4.5 By Deployment Type
12.3.7.4.6 By Vertical
12.4 Asia Pacific
12.4.1 By Component
12.4.2 By Solution
12.4.3 By Service
12.4.4 By Technology
12.4.5 By Deployment Type
12.4.6 By Vertical
12.4.7 By Country
12.4.7.1 Australia
12.4.7.1.1 By Component
12.4.7.1.2 By Solution
12.4.7.1.3 By Service
12.4.7.1.4 By Technology
12.4.7.1.5 By Deployment Type
12.4.7.1.6 By Vertical
12.4.7.2 Japan
12.4.7.2.1 By Component
12.4.7.2.2 By Solution
12.4.7.2.3 By Service
12.4.7.2.4 By Technology
12.4.7.2.5 By Deployment Type
12.4.7.2.6 By Vertical
12.4.7.3 India
12.4.7.3.1 By Component
12.4.7.3.2 By Solution
12.4.7.3.3 By Service
12.4.7.3.4 By Technology
12.4.7.3.5 By Deployment Type
12.4.7.3.6 By Vertical
12.4.7.4 Rest of APAC
12.4.7.4.1 By Component
12.4.7.4.2 By Solution
12.4.7.4.3 By Service
12.4.7.4.4 By Technology
12.4.7.4.5 By Deployment Type
12.4.7.4.6 By Vertical
12.5 Middle East and Africa
12.5.1 By Component
12.5.2 By Solution
12.5.3 By Service
12.5.4 By Technology
12.5.5 By Deployment Type
12.5.6 By Vertical
12.5.7 By Country
12.5.7.1 Kingdom of Saudi Arabia (KSA)
12.5.7.1.1 By Component
12.5.7.1.2 By Solution
12.5.7.1.3 By Service
12.5.7.1.4 By Technology
12.5.7.1.5 By Deployment Type
12.5.7.1.6 By Vertical
12.5.7.2 United Arab Emirates (UAE)
12.5.7.2.1 By Component
12.5.7.2.2 By Solution
12.5.7.2.3 By Service
12.5.7.2.4 By Technology
12.5.7.2.5 By Deployment Type
12.5.7.2.6 By Vertical
12.5.7.3 South Africa
12.5.7.3.1 By Component
12.5.7.3.2 By Solution
12.5.7.3.3 By Service
12.5.7.3.4 By Technology
12.5.7.3.5 By Deployment Type
12.5.7.3.6 By Vertical
12.5.7.4 Rest of Middle East and Africa
12.5.7.4.1 By Component
12.5.7.4.2 By Solution
12.5.7.4.3 By Service
12.5.7.4.4 By Technology
12.5.7.4.5 By Deployment Type
12.5.7.4.6 By Vertical
12.6 Latin America
12.6.1 By Component
12.6.2 By Solution
12.6.3 By Service
12.6.4 By Technology
12.6.5 By Deployment Type
12.6.6 By Vertical
12.6.7 By Country
12.6.7.1 Brazil
12.6.7.1.1 By Component
12.6.7.1.2 By Solution
12.6.7.1.3 By Service
12.6.7.1.4 By Technology
12.6.7.1.5 By Deployment Type
12.6.7.1.6 By Vertical
12.6.7.2 Mexico
12.6.7.2.1 By Component
12.6.7.2.2 By Solution
12.6.7.2.3 By Service
12.6.7.2.4 By Technology
12.6.7.2.5 By Deployment Type
12.6.7.2.6 By Vertical
12.6.7.3 Argentina
12.6.7.3.1 By Component
12.6.7.3.2 By Solution
12.6.7.3.3 By Service
12.6.7.3.4 By Technology
12.6.7.3.5 By Deployment Type
12.6.7.3.6 By Vertical
12.6.7.4 Rest of Latin America
12.6.7.4.1 By Component
12.6.7.4.2 By Solution
12.6.7.4.3 By Service
12.6.7.4.4 By Technology
12.6.7.4.5 By Deployment Type
12.6.7.4.6 By Vertical
13 Competitive Landscape (Page No. - 109)
13.1 Microquadrant Overview
13.1.1 Visionary Leaders
13.1.2 Innovators
13.1.3 Dynamic Differentiators
13.1.4 Emerging Companies
13.2 Competitive Benchmarking
13.2.1 Strength of Product Portfolio Adopted By Major Players in the Anomaly Detection Market
13.2.2 Business Strategy Excellence Adopted By Major Players in the Market
Top 23 Companies Analysed for This Study are - International Business Machines Corporation, Symantec Corporation, Hewlett Packard Enterprise Company, SAS Institute, Inc., Securonix, Inc., Flowmon Networks, Wipro Limited, Dell Technologies, Inc., Trend Micro, Inc., Gurucul, Rapid7, Inc., Aqueduct Technologies, Inc., Trustwave Holdings, Inc., LogRhythm, Inc., Cisco Systems, Inc., Varonis Systems, Inc., Splunk, Inc., Happiest Minds, Niara, Inc., GreyCortex s.r.o., Anodot, Ltd., Cynet, and Guardian Analytics
14 Company Profiles (Page No. - 113)
(Overview, Strength of Product Portfolio, Business Strategy Excellence and Recent Developments)*
14.1 Cisco Systems, Inc.
14.2 Dell Technologies, Inc.
14.3 Hewlett Packard Enterprise Company
14.4 Guardian Analytics
14.5 Anodot, Ltd.
14.6 Happiest Minds
14.7 Gurucul
14.8 Niara, Inc.
14.9 Flowmon Networks
14.10 Wipro Limited
14.11 SAS Institute Inc.
14.12 Symantec Corporation
14.13 Trustwave Holdings, Inc.
14.14 International Business Machines Corporation
14.15 LogRhythm, Inc.
14.16 Splunk, Inc.
14.17 Trend Micro, Inc.
14.18 GreyCortex s.r.o.
14.19 Securonix, Inc.
*Details on Overview, Strength of Product Portfolio, Business Strategy Excellence and Recent Developments Might Not Be Captured in Case of Unlisted Companies.
15 Appendix (Page No. - 176)
15.1 Industry Experts
15.2 Discussion Guide
15.3 Knowledge Store: Marketsandmarkets� Subscription Portal
15.4 Introducing RT: Real-Time Market Intelligence
15.5 Available Customizations
15.6 Related Reports
15.7 Author Details
List of Tables (81 Tables)
Table 1 Anomaly Detection Market Size and Growth Rate, 2017�2022 (USD Million, Y-O-Y %)
Table 2 Market Size, By Component, 2017�2022 (USD Million)
Table 3 Market Size, By Solution, 2015�2022 (USD Million)
Table 4 Solutions: Anomaly Detection Market Size, By Network Behavior Anomaly Detection, 2015�2022 (USD Million)
Table 5 Network Traffic Analysis Market Size, By Region, 2015�2022 (USD Million)
Table 6 Network Intelligence and Security Market Size, By Region, 2015�2022 (USD Million)
Table 7 Risk Mitigation and Management Market Size, By Region, 2015�2022 (USD Million)
Table 8 Solutions: Anomaly Detection Market Size, By User Behavior Anomaly Detection, 2015�2022 (USD Million)
Table 9 Identity and Access Management Market Size, By Region, 2015�2022 (USD Million)
Table 10 Threat Intelligence and Management Market Size, By Region, 2015�2022 (USD Million)
Table 11 Data Loss Prevention Market Size, By Region, 2015�2022 (USD Million)
Table 12 Security Information and Event Management Market Size, By Region, 2015�2022 (USD Million)
Table 13 Anomaly Detection Market Size, By Service, 2015�2022 (USD Million)
Table 14 Professional Services: Market Size, By Type, 2015�2022 (USD Million)
Table 15 Deployment and Integration Market Size, By Region, 2015�2022 (USD Million)
Table 16 Consulting Services Market Size, By Region, 2015�2022 (USD Million)
Table 17 Support and Maintenance Market Size, By Region, 2015�2022 (USD Million)
Table 18 Managed Services: Market Size, By Region, 2015�2022 (USD Million)
Table 19 Anomaly Detection Market Size, By Technology, 2015�2022 (USD Million)
Table 20 Big Data Analytics: Market Size, By Region, 2015�2022 (USD Million)
Table 21 Data Mining and Business Intelligence: Market Size, By Region, 2015�2022 (USD Million)
Table 22 Machine Learning and Artificial Intelligence: Market Size, By Region, 2015�2022 (USD Million)
Table 23 Anomaly Detection Market Size, By Deployment Type, 2015�2022 (USD Million)
Table 24 On-Premises: Market Size, By Region, 2015�2022 (USD Million)
Table 25 Cloud: Market Size, By Region, 2015�2022 (USD Million)
Table 26 Hybrid: Market Size, By Region, 2015�2022 (USD Million)
Table 27 Anomaly Detection Market Size, By Vertical, 2015�2022 (USD Million)
Table 28 Banking, Financial Services and Insurance: Market Size, By Region, 2015�2022 (USD Million)
Table 29 Retail: Market Size, By Region, 2015�2022 (USD Million)
Table 30 Manufacturing: Market Size, By Region, 2015�2022 (USD Million)
Table 31 IT and Telecom: Market Size, By Region, 2015�2022 (USD Million)
Table 32 Defense and Government: Anomaly Detection Market Size, By Region, 2015�2022 (USD Million)
Table 33 Healthcare: Market Size, By Region, 2015�2022 (USD Million)
Table 34 Others: Market Size, By Region, 2015�2022 (USD Million)
Table 35 Market Size, By Region, 2015�2022 (USD Million)
Table 36 North America: Anomaly Detection Market Size, By Component, 2015�2022 (USD Million)
Table 37 North America: Market Size, By Solution, 2015�2022 (USD Million)
Table 38 North America: Market Size, By Network Behavior Anomaly Detection Solution, 2015�2022 (USD Million)
Table 39 North America: Market Size, By User Behavior Anomaly Detection Solution, 2015�2022 (USD Million)
Table 40 North America: Market Size, By Service, 2015�2022 (USD Million)
Table 41 North America: Market Size, By Professional Service, 2015�2022 (USD Million)
Table 42 North America: Market Size, By Technology, 2015�2022 (USD Million)
Table 43 North America: Market Size, By Deployment Type, 2015�2022 (USD Million)
Table 44 North America: Market Size, By Vertical, 2015�2022 (USD Million)
Table 45 Europe: Anomaly Detection Market Size, By Component, 2015�2022 (USD Million)
Table 46 Europe: Market Size, By Solution, 2015�2022 (USD Million)
Table 47 Europe: Market Size, By Network Behavior Anomaly Detection Solution, 2015�2022 (USD Million)
Table 48 Europe: Market Size, By User Behavior Anomaly Detection Solution, 2015�2022 (USD Million)
Table 49 Europe: Market Size, By Service, 2015�2022 (USD Million)
Table 50 Europe: Market Size, By Professional Service, 2015�2022 (USD Million)
Table 51 Europe: Market Size, By Technology, 2015�2022 (USD Million)
Table 52 Europe: Market Size, By Deployment Type, 2015�2022 (USD Million)
Table 53 Europe: Market Size, By Vertical, 2015�2022 (USD Million)
Table 54 Asia Pacific: Anomaly Detection Market Size, By Component, 2015�2022 (USD Million)
Table 55 Asia Pacific: Market Size, By Solution, 2015�2022 (USD Million)
Table 56 Asia Pacific: Market Size, By Network Behavior Anomaly Detection Solution, 2015�2022 (USD Million)
Table 57 Asia Pacific: Market Size, By User Behavior Anomaly Detection Solution, 2015�2022 (USD Million)
Table 58 Asia Pacific: Market Size, By Service, 2015�2022 (USD Million)
Table 59 Asia Pacific: Market Size, By Professional Service, 2015�2022 (USD Million)
Table 60 Asia Pacific: Market Size, By Technology, 2015�2022 (USD Million)
Table 61 Asia Pacific: Market Size, By Deployment Type, 2015�2022 (USD Million)
Table 62 Asia Pacific: Market Size, By Vertical, 2015�2022 (USD Million)
Table 63 Middle East and Africa: Anomaly Detection Market Size, By Component, 2015�2022 (USD Million)
Table 64 Middle East and Africa: Market Size, By Solution, 2015�2022 (USD Million)
Table 65 Middle East and Africa: Market Size, By Network Behavior Anomaly Detection Solution, 2015�2022 (USD Million)
Table 66 Middle East and Africa: Market Size, By User Behavior Anomaly Detection Solution, 2015�2022 (USD Million)
Table 67 Middle East and Africa: Market Size, By Service, 2015�2022 (USD Million)
Table 68 Middle East and Africa: Market Size, By Professional Services, 2015�2022 (USD Million)
Table 69 Middle East and Africa: Market Size, By Technology, 2015�2022 (USD Million)
Table 70 Middle East and Africa: Market Size, By Deployment Type, 2015�2022 (USD Million)
Table 71 Middle East and Africa: Market Size, By Vertical, 2015�2022 (USD Million)
Table 72 Latin America: Anomaly Detection Market Size, By Component, 2015�2022 (USD Million)
Table 73 Latin America: Market Size, By Solution, 2015�2022 (USD Million)
Table 74 Latin America: Market Size, By Network Behavior Anomaly Detection Solution, 2015�2022 (USD Million)
Table 75 Latin America: Market Size, By User Behavior Anomaly Detection Solution, 2015�2022 (USD Million)
Table 76 Latin America: Market Size, By Service, 2015�2022 (USD Million)
Table 77 Latin America: Market Size, By Professional Service, 2015�2022 (USD Million)
Table 78 Latin America: Market Size, By Technology, 2015�2022 (USD Million)
Table 79 Latin America: Market Size, By Deployment Type, 2015�2022 (USD Million)
Table 80 Latin America: Market Size, By Vertical, 2015�2022 (USD Million)
Table 81 Market Ranking for the Anomaly Detection Market, 2017
List of Figures (54 Figures)
Figure 1 Anomaly Detection Market: Market Segmentation
Figure 2 Market: Research Design
Figure 3 Breakdown of Primary Interviews: By Company, Designation, and Region
Figure 4 Data Triangulation
Figure 5 Market Size Estimation Methodology: Bottom-Up Approach
Figure 6 Market Size Estimation Methodology: Top-Down Approach
Figure 7 Anomaly Detection Market: Assumptions
Figure 8 North America is Estimated to Hold the Largest Market Share in 2017
Figure 9 Segments Dominating the Global Anomaly Detection Market, 2017
Figure 10 Solutions Segment is Estimated to Hold A Major Market Share in 2017
Figure 11 Growth of Data and Emergence of High-Performance Data Analytics, and Increase in Cyber Espionage and Fraudulent Activities are Driving the Anomaly Detection Market
Figure 12 Identity and Access Management, and North America are Estimated to Have the Largest Market Shares in 2017
Figure 13 Asia Pacific is Expected to Grow at A Significant Pace During the Forecast Period (2017�2022)
Figure 14 North America is Expected to Hold the Largest Market Size During the Forecast Period
Figure 15 Asia Pacific is Expected to Emerge as the Best Market for Investments in the Next 5 Years
Figure 16 IT and Telecom, Retail, and Defense and Government are Expected to Grow at Impressive Rates During the Forecast Period
Figure 17 Anomaly Detection Market: Drivers, Restraints, Opportunities, and Challenges
Figure 18 Solutions Segment is Expected to Dominate the Anomaly Detection Market During the Forecast Period
Figure 19 North America is Expected to Dominate the Solutions Segment of the Market During the Forecast Period
Figure 20 North America is Expected to Grow Two-Fold in the Services Segment of the Market During the Forecast Period
Figure 21 Network Behavior Anomaly Detection Solution is Expected to Dominate the Anomaly Detection Market During the Forecast Period
Figure 22 Network Traffic Analysis is Expected to Hold the Largest Market Size in the Network Behavior Anomaly Detection Solution Segment During the Forecast Period
Figure 23 Asia Pacific is Expected to Grow at the Highest CAGR in the Network Traffic Analysis Segment During the Forecast Period
Figure 24 North America is Expected to Dominate the Risk Mitigation and Management Segment During the Forecast Period
Figure 25 Identity and Access Management is Expected to Dominate the User Behavior Anomaly Detection Segment During the Forecast Period
Figure 26 North America is Expected to Have the Largest Market Size in the Identity and Access Management Segment During the Forecast Period
Figure 27 North America is Expected to Grow Two-Fold in the Threat Intelligence and Management Segment During the Forecast Period
Figure 28 Professional Services Segment is Expected to Hold A Larger Market Size During the Forecast Period
Figure 29 Deployment and Integration Segment is Expected to Dominate the Professional Services Segment During the Forecast Period
Figure 30 Asia Pacific is Expected to Grow at the Highest CAGR in the Managed Services Segment During the Forecast Period
Figure 31 Big Data Analytics is Expected to Hold the Largest Market Size During the Forecast Period
Figure 32 North America is Expected to Dominate the Big Data Analytics Segment in the Anomaly Detection Market During the Forecast Period
Figure 33 Asia Pacific is Expected to Grow at the Highest CAGR in the Machine Learning and Artificial Intelligence Segment During the Forecast Period
Figure 34 Cloud Deployment Type is Expected to Hold the Largest Market Size During the Forecast Period
Figure 35 North America is Expected to Dominate the Cloud Deployment Type in the Anomaly Detection Market During the Forecast Period
Figure 36 North America is Expected to Grow Two-Fold in the Hybrid Deployment Type Segment in the Anomaly Detection Market During the Forecast Period
Figure 37 Banking, Financial Services, and Insurance Vertical is Expected to Hold the Largest Market Size in the Anomaly Detection Market During the Forecast Period
Figure 38 North America is Expected to Lead in the BFSI Vertical During the Forecast Period
Figure 39 Asia Pacific is Expected to Grow at the Highest CAGR in the IT and Telecom Vertical During the Forecast Period
Figure 40 Asia Pacific is Expected to Exhibit the Highest CAGR in the Anomaly Detection Market During the Forecast Period
Figure 41 Asia Pacific is an Attractive Destination in the Market, 2017�2022
Figure 42 North America Anomaly Detection Market Snapshot
Figure 43 Threat Intelligence and Management is Expected to Exhibit the Highest CAGR in the User Behavior Anomaly Detection Segment During the Forecast Period
Figure 44 Asia Pacific Anomaly Detection Market Snapshot
Figure 45 Machine Learning and Artificial Intelligence Technology is Expected to Showcase the Highest CAGR in the Asia Pacific Market During the Forecast Period
Figure 46 Anomaly Detection Market (Global), Competitive Leadership Mapping, 2017
Figure 47 Cisco Systems, Inc.: Company Snapshot
Figure 48 Hewlett Packard Enterprise Company: Company Snapshot
Figure 49 Wipro Limited: Company Snapshot
Figure 50 SAS Institute Inc.: Company Snapshot
Figure 51 Symantec Corporation: Company Snapshot
Figure 52 International Business Machines Corporation: Company Snapshot
Figure 53 Splunk, Inc.: Company Snapshot
Figure 54 Trend Micro, Inc.: Company Snapshot


Growth opportunities and latent adjacency in Anomaly Detection Market