Galley Equipment Market by Fit (Line Fit, Retro Fit), by Galley Type (Single Aisle, Twin Aisle, Business Aviation), by Galley Inserts (Electric Inserts and Non-Electric Inserts), by Application (Aviation, Marine), by Geography - Global Forecast 2034


The galley equipment market continues to expand steadily, driven by sustained aircraft deliveries, airline cabin retrofits, and the push toward lighter, energy-efficient interiors. In 2025, the market is estimated at around USD 2.9 billion and is projected to reach approximately USD 4.6 billion by 2034, registering a compound annual growth rate (CAGR) of about 5.2 %.

Galley systems — encompassing modular kitchen units, inserts, and utilities — are critical to in-flight service, passenger comfort, and airline brand experience. They have evolved from static metal units to smart, weight-optimized, and power-efficient architectures designed to align with the latest A320neo, B737 MAX, B787, A350, and regional jet cabins. The growth reflects modernization across both linefit programs and retrofit upgrades, coupled with renewed investment in VIP and business jet interiors post-pandemic.
Technological advancements, including integrated power management, composite panels, and IoT-enabled galley inserts, are reshaping how airlines approach food safety, waste reduction, and passenger service efficiency.
Market Dynamics
Key Growth Drivers
- Fleet Expansion & Deliveries: OEM production ramp-ups at Airbus, Boeing, COMAC, and Embraer are directly increasing linefit galley demand.
- Retrofit Programs: Cabin refurbishment cycles (typically every 8–12 years) drive sustained aftermarket demand for galley replacements and upgrades.
- Passenger Experience & Premium Cabins: Airlines differentiate service quality through improved galley layouts and high-efficiency equipment.
- Lightweight & Modular Design: Shift from aluminum to composite and thermoplastic materials reduces fuel burn and carbon emissions.
- Regulatory & Safety Standards: FAA and EASA mandates on fireproofing, electrical load management, and food-handling hygiene continue to shape design and certification.
Challenges
- High integration cost during retrofit cycles.
- Stringent certification and testing for materials (flammability, toxicity).
- Pressure on OEM suppliers due to fluctuating raw-material costs.
Opportunities
- Smart Galleys: Integration of sensors and digital interfaces for predictive maintenance and inventory tracking.
- Sustainability: Circular materials and energy-efficient ovens to reduce airline CO2 footprint.
- Emerging Aircraft Segments: Growth in eVTOL and urban air mobility vehicles introducing compact galley solutions for short-haul VIP transport.
Market Segmentation

By Aircraft Type
-
Narrow-Body Aircraft:
Dominant volume segment; compact modular galleys emphasizing space optimization. -
Wide-Body Aircraft:
Higher-value installations with multi-zone galley modules and integrated waste systems. -
Regional Jets:
Simplified layouts with combination units (galley-lavatory modules) for space efficiency. -
Business & General Aviation:
Customized high-end galleys for VIP cabins, corporate jets, and private aircraft. -
Military Transport Aircraft:
Mission-specific galley configurations designed for troop and crew welfare on long-range missions.
By Fit Type
-
Linefit:
Installed during aircraft assembly at OEM facilities; represents majority share due to synchronized delivery schedules. -
Retrofit:
Replacement or modernization of existing galley systems during maintenance checks (C or D checks) or cabin refurbishment.
By Galley Type / Configuration
-
Single Galley:
Compact layout for regional and short-haul narrow-body aircraft. -
Double Galley:
Used in long-haul aircraft for dual service zones (front and rear). -
L-Shape and T-Shape Galleys:
Enhanced ergonomics and crew efficiency; common in wide-body and premium cabins. -
Modular & Convertible Galleys:
Emerging configuration enabling re-layout for catering or crew-rest conversions.
By Insert Type
-
Ovens (Convection / Steam / Microwave):
Core appliance for heating and meal preparation; trend toward energy-efficient convection systems. -
Refrigeration Units / Chillers:
Maintain food safety and quality; adoption of compact compressor systems and smart temperature monitoring. -
Coffee Makers & Beverage Dispensers:
Rapid-serve beverage systems integrated with touch-panel controls. -
Water Boilers & Heaters:
Essential for beverage preparation in long-haul service. -
Trash Compactors & Waste Containers:
Support sustainability and hygiene compliance. -
Trolleys & Containers:
Lightweight, standardized units for meal service; focus on ergonomic handling and recyclability.
By Material
- Aluminum Alloys: Traditional construction with good durability and fire resistance.
- Composites (CFRP / GFRP): Preferred for weight reduction and corrosion resistance.
- Thermoplastics & Advanced Laminates: Provide aesthetic appeal and design flexibility for premium interiors.
By End User
- Commercial Airlines – Major consumers across linefit and retrofit.
- Business Jet Operators – Custom luxury galleys with premium finish and equipment.
- OEMs & MROs – Integration and maintenance of certified galley systems.
Technology Landscape
Modern galley systems integrate smart power-distribution modules, IoT-enabled status reporting, and digital control interfaces for enhanced reliability and energy efficiency.
Key innovations include:
- Wireless data transfer between galley appliances and cabin-management systems.
- Induction heating ovens reducing load on electrical circuits.
- Lightweight composite sandwich panels meeting stringent flammability standards.
- 3D-printed parts for small-batch retrofit spares.
- Hybrid trolleys with battery-assisted movement and smart inventory tracking.
Suppliers are collaborating with airlines to align galley functionality with connected cabin ecosystems—linking catering inventory, crew workflow, and passenger preferences in real time.
Regulatory Framework
- FAA 14 CFR 25.853 / EASA CS-25.853: Flammability, smoke, and toxicity standards for interior materials.
- RTCA DO-160G: Environmental and electrical testing for aircraft systems.
- Airline Catering Association (ACA) Guidelines: Hygiene and safety protocols for onboard food handling.
- AS9100 / ISO 9001: Quality-management standards for aerospace component manufacturing.
Compliance with these regulations underpins all design, manufacturing, and certification processes for galley systems and inserts.
Sustainability Perspective
Sustainability is now embedded in cabin-interior strategies.
- Weight reduction through composites and additive manufacturing directly cuts fuel consumption.
- Energy-efficient ovens and recyclable trolley containers minimize waste and energy use.
- OEMs and suppliers are developing closed-loop recycling for aluminum panels and plastic inserts.
- Airlines are adopting eco-service models with biodegradable meal packaging to complement greener galleys.
Regional Outlook
North America:
Holds the largest share due to robust production by Boeing and major retrofit demand from U.S. carriers. Companies like Collins Aerospace and Jamco America lead innovation in modular galley units.
Europe:
Significant market led by Airbus programs and suppliers such as Safran Cabin and Diehl Aviation. EASA regulations and lightweight design focus drive adoption of composite materials.
Asia Pacific:
Fastest-growing region with expanding fleets in China, India, and Southeast Asia. COMAC’s C919 and regional MRO growth underpin long-term demand.
Middle East & Africa:
High-value segment driven by premium long-haul carriers (Emirates, Qatar Airways, Etihad) investing in luxurious galley modules and smart inserts.
Latin America:
Moderate growth led by fleet modernization of LATAM and Azul; increased retrofit investments and local supplier participation in Brazil.
Competitive Landscape

Key players include:
- Safran Cabin (France) – Full-suite galley and insert systems for Airbus & Boeing platforms.
- Collins Aerospace (U.S.) – Integrated galley modules and electrical systems.
- Diehl Aviation (Germany) – Composite galleys and lightweight trolleys.
- Jamco Corporation (Japan) – Modular galleys and lavatory-galley combination units.
- Bucher Leichtbau AG (Switzerland) – Premium lightweight VIP galleys.
- AIM Altitude (U.K.) – Custom galley interiors for premium and business-jet applications.
- Aerolux Ltd. (U.K.) – Galley inserts and accessories for small and mid-size aircraft.
- Atlas Air Catering Equipment (Germany) – Specialist in trolleys, containers, and catering logistics.
Competition focuses on weight reduction, customization, certification speed, and lifecycle service support. Strategic partnerships with OEMs for next-generation aircraft programs will define market leadership through 2034.
Market Outlook and Key Takeaways
|
Metric |
2025 |
2034 |
CAGR |
|
Market Size |
USD 2.9 B |
USD 4.6 B |
~5.2 % |
Highlights:
- Linefit remains dominant, though retrofit share is rising.
- Composite and thermoplastic materials represent >50 % of new installations by 2030.
- Asia Pacific records the fastest growth due to regional fleet expansion.
- Future opportunities lie in smart, connected, and eco-efficient galley ecosystems.
FAQs
1. What is the size of the galley equipment market?
Around USD 2.9 billion in 2025, projected to reach USD 4.6 billion by 2034.
2. Which aircraft segment dominates demand?
Narrow-body aircraft, owing to high production rates and short-haul service demand.
3. What trends are shaping galley design?
Lightweight composites, modularity, IoT connectivity, and energy-efficient inserts.
4. Which region shows fastest growth?
Asia Pacific, propelled by fleet expansion and regional manufacturing capabilities.
5. Who are key players in the market?
Safran Cabin, Collins Aerospace, Diehl Aviation, Jamco, and Bucher Leichtbau AG.
 Exclusive indicates content/data unique to MarketsandMarkets and not available with any competitors.
Table of Contents
1 Introduction (Page No. - 29)
1.1 Objectives of the Study
1.2 Market Definition
1.3 Study Scope
1.3.1 Markets Covered
1.3.2 Geographic Scope
1.3.3 Years Considered for the Study
1.4 Currency & Pricing
1.5 Study Limitations
1.6 Market Stakeholders
2 Research Methodology (Page No. - 34)
2.1 Research Data
2.1.1 Secondary Data
2.1.1.1 Key Data From Secondary Sources
2.1.2 Primary Data
2.1.2.1 Key Data From Primary Sources
2.1.2.2 Breakdown of Primaries
2.2 Factor Analysis
2.2.1 Introduction
2.2.2 Demand-Side Indicators
2.2.2.1 Strong Growth in Aircraft Deliveries
2.2.2.2 Growth in Marine Fleet Size
2.2.3 Supply-Side Indicators
2.2.3.1 Growth of Lightweight and Energy-Efficient Galley Equipment Manufacturing
2.2.3.2 Growth of Parent Market – Aircraft Cabin Interiors
2.3 Market Size Estimation
2.3.1 Bottom-Up Approach
2.3.2 Top-Down Approach
2.4 Market Breakdown and Data Triangulation
2.5 Research Assumptions & Limitations
2.5.1 Assumptions
2.5.2 Limitations
3 Executive Summary (Page No. - 46)
4 Premium Insights (Page No. - 53)
4.1 Attractive Market Opportunities in Galley Equipment Market
4.2 Galley Equipment Market, By Marine Vessel Type
4.3 Marine Galley Equipment Market, By Application
4.4 Galley Equipment Market, By Type
4.5 Galley Equipment Market, By Aircraft Type
4.6 North America: Galley Equipment Market, By Aircraft Type
4.7 Galley Equipment Market Share Analysis, By Region
4.8 Galley Equipment Market, By Region
4.9 Life Cycle Analysis, By Region
5 Market Overview (Page No. - 62)
5.1 Introduction
5.2 Market Segmentation
5.2.1 By Application
5.2.2 By Aircraft Type
5.2.2 By Ship Type
5.2.3 By Insert Type
5.3 Market Dynamics
5.3.1 Drivers
5.3.1.1 Need for Modular Galleys
5.3.1.2 Rising Demand for Aircraft
5.3.1.3 Increase in Demand for Lightweight Galley Equipment
5.3.1.4 Demand for Galley Customization as Per Customer Preference
5.3.2 Restraints
5.3.2.1 Rising Demand for Low-Cost Carriers
5.3.2.2 Delay in Shipment Deliveries as Part of New Programs
5.3.2.3 Adoption of Wait-And-See Strategy By Suppliers
5.3.3 Opportunities
5.3.3.1 Demand for Increased Customer Experience
5.3.3.2 Increasing Shipments in Asia-Pacific, Latin America and Middle-East
5.3.4 Challenges
5.3.4.1 Achieving Efficiency By Reducing Space and Weight of the Equipment.
5.3.4.2 Varied Preferences for Galley Design
5.3.5 Burning Issue
5.3.5.1 Maintaining Weight to Volume Ratio
6 Industry Trends (Page No. - 77)
6.1 Introduction
6.2 Value Chain Analysis
6.3 Supply Chain Analysis
6.3.1 Key Influencers
6.4 Technology Trends
6.5 Porter’s Five Forces Analysis
6.5.1 Threat of New Entrants
6.5.2 Threat of Substitutes
6.5.3 Bargaining Power of Suppliers
6.5.4 Bargaining Power of Buyers
6.5.5 Intensity of Competitive Rivalry
7 Galley Equipment Market, By Application (Page No. - 85)
7.1 Introduction
7.2 Aviation
7.3 Marine
8 Aviation Galley Equipment Market, By Aircraft Type (Page No. - 91)
8.1 Introduction
8.2 Single-Aisle
8.3 Twin-Aisle
8.4 Business Aviation
9 Marine Galley Equipment Market, By Ship Type (Page No. - 91)
9.1 Introduction
9.2 Surface Ships
9.3 Amphibious Ships
9.4 Passenger Vessels
9.5 Recreational Boats
9.6 Bulk Carriers
10 Galley Equipment Market, By Insert Type (Page No. - 95)
10.1 Introduction
10.2 Aircraft Galleys
10.2.1 Electric Insert
10.2.1.1 Beverage Chiller
10.2.1.2 Beverage Maker
10.2.1.3 Coffee Maker
10.2.1.4 Water Boiler
10.2.1.5 Bun Warmer
10.2.1.6 Air Chiller
10.2.1.7 Dishwasher
10.2.1.8 Refrigeration System
10.2.2 Non-Electric Insert
10.2.2.1 Inbuilt-Bar
10.2.2.2 Trash Compactor
10.2.2.3 Rack/Tray
10.2.2.4 Serving Pot
10.2.2.5 Trolley
10.3 Ship Galleys
10.3.1 Electric Insert
10.3.1.1 Cooking Equipment
10.3.1.2 Food Processing Equipment
10.3.1.3 Washware Machineries
10.3.1.4 Refrigeration System
10.3.1.5 Stainless Steel Panel System
10.3.2 Non-Electric Insert
10.3.2.1 Hoods and Canopies
10.3.2.2 Trash Compactor
10.3.2.3 Buffet and Bar Counters
10.3.2.4 Related Stainless Steel Furniture
11 Galley Equipment Market, By Fit (Page No. - 100)
11.1 Introduction
11.2 Line Fit
11.3 Retro Fit
12 Regional Analysis (Page No. - 102)
12.1 Introduction
12.2 By Region
12.2.1 By Fit
12.2.2 By Application
12.3 North America
12.3.1 By Fit
12.3.2 By Application
12.3.3 By Aircraft Type
12.3.4 By Aircraft Insert Type
12.3.5 By Aircraft Inserts
12.3.7 By Ship Type
12.3.8 By Ship Insert Type
12.3.9 By Ship Inserts
12.3.10 By Country
12.3.10.1 U.S.
12.3.10.1.1 By Fit
12.3.10.1.2 By Application
12.3.10.1.3 By Aircraft Type
12.3.10.1.4 By Aircraft Insert Type
12.3.10.1.5 By Aircraft Inserts
12.3.10.1.7 By Ships Type
12.3.10.1.8 By Ship Insert Type
12.3.10.1.9 By Ship Inserts
12.3.10.2 Canada
12.3.10.2.1 By Fit
12.3.10.2.2 By Application
12.3.10.2.3 By Aircraft Type
12.3.10.2.4 By Aircraft Insert Type
12.3.10.2.5 By Aircraft Inserts
12.3.10.2.6 By Ships Type
12.3.10.2.7 By Ship Insert Type
12.3.10.2.9 By Ship Inserts
12.4 Europe
12.4.1 By Fit
12.4.2 By Application
12.4.3 By Aircraft Type
12.4.4 By Aircraft Insert Type
12.4.5 By Aircraft Inserts
12.4.6 By Ships Type
12.4.7 By Ship Type
12.4.8 By Ship Insert Type
12.4.9 By Ship Inserts
12.4.10 By Country
12.4.10.1 U.K.
12.4.10.1.1 By Fit
12.4.10.1.2 By Application
12.4.10.1.3 By Aircraft Type
12.4.10.1.4 By Aircraft Insert Type
12.4.10.1.5 By Aircraft Inserts
12.4.10.1.7 By Ship Type
12.4.10.1.8 By Ship Insert Type
12.4.10.1.9 By Ship Inserts
12.4.10.2 France
12.4.10.2.1 By Fit
12.4.10.2.2 By Application
12.4.10.2.3 By Aircraft Type
12.4.10.2.4 By Aircraft Insert Type
12.4.10.2.5 By Aircraft Inserts
12.4.10.2.6 By Ship Type
12.4.10.2.7 By Ship Insert Type
12.4.10.2.9 By Ship Inserts
12.4.10.3 Germany
12.4.10.3.1 By Fit
12.4.10.3.2 By Application
12.4.10.3.3 By Aircraft Type
12.4.10.3.4 By Aircraft Insert Type
12.4.10.3.5 By Aircraft Inserts
12.4.10.3.7 By Ship Type
12.4.10.3.8 By Ship Insert Type
12.4.10.3.9 By Ship Inserts
12.5 Asia-Pacific
12.5.1 By Fit
12.5.2 By Application
12.5.3 By Aircraft Type
12.5.4 By Aircraft Insert Type
12.5.5 By Aircraft Inserts
12.5.6 By Ship Type
12.5.7 By Ship Insert Type
12.5.9 By Ship Inserts
12.5.10 By Country
12.5.10.1 China
12.5.10.1.1 By Fit
12.5.10.1.2 By Application
12.5.10.1.3 By Aircraft Type
12.5.10.1.4 By Aircraft Insert Type
12.5.10.1.5 By Aircraft Inserts
12.5.10.1.7 By Ship Type
12.5.10.1.8 By Ship Insert Type
12.5.10.1.9 By Ship Inserts
12.5.10.2 Japan
12.5.10.2.1 By Fit
12.5.10.2.2 By Application
12.5.10.2.3 By Aircraft Type
12.5.10.2.4 By Aircraft Insert Type
12.5.10.2.5 By Aircraft Inserts
12.5.10.2.7 By Ship Type
12.5.10.2.8 By Ship Insert Type
12.5.10.2.9 By Ship Inserts
12.5.10.3 India
12.5.10.3.1 By Fit
12.5.10.3.2 By Application
12.5.10.3.3 By Aircraft Type
12.5.10.3.4 By Aircraft Insert Type
12.5.10.3.5 By Aircraft Inserts
12.5.10.3.7 By Ship Type
12.5.10.3.8 By Ship Insert Type
12.5.10.3.9 By Ship Inserts
12.6 Middle-East
12.6.1 By Fit
12.6.2 By Application
12.6.3 By Aircraft Type
12.6.4 By Aircraft Insert Type
12.6.5 By Aircraft Inserts
12.6.7 By Ship Type
12.6.8 By Ship Insert Type
12.6.9 By Ship Inserts
12.6.10 By Country
12.6.10.1 U.A.E.
12.6.10.1.1 By Fit
12.6.10.1.2 By Application
12.6.10.1.3 By Aircraft Type
12.6.10.1.4 By Aircraft Insert Type
12.6.10.1.5 By Aircraft Inserts
12.6.10.1.7 By Ship Type
12.6.10.1.8 By Ship Insert Type
12.6.10.1.9 By Ship Inserts
12.6.10.2 Saudi Arabia
12.6.10.2.1 By Fit
12.6.10.2.2 By Application
12.6.10.2.3 By Aircraft Type
12.6.10.2.4 By Aircraft Insert Type
12.6.10.2.5 By Aircraft Inserts
12.6.10.2.7 By Ship Type
12.6.10.2.8 By Ship Insert Type
12.6.10.2.9 By Ship Inserts
12.7 Latin America
12.7.1 By Fit
12.7.2 By Application
12.7.3 By Aircraft Type
12.7.4 By Aircraft Insert Type
12.7.5 By Aircraft Inserts
12.7.7 By Ship Type
12.7.8 By Ship Insert Type
12.7.9 By Ship Inserts
12.7.10 By Country
12.7.10.1 Brazil
12.7.10.1.1 By Fit
12.7.10.1.2 By Application
12.7.10.1.3 By Aircraft Type
12.7.10.1.4 By Aircraft Insert Type
12.7.10.1.5 By Aircraft Inserts
12.7.10.1.7 By Aircraft Type
12.7.10.1.8 By Aircraft Insert Type
12.7.10.1.9 By Aircraft Inserts
12.8 Africa
12.8.1 By Fit
12.8.2 By Application
12.8.3 By Aircraft Type
12.8.4 By Aircraft Insert Type
12.8.5 By Aircraft Inserts
12.8.7 By Ship Type
12.8.8 By Ship Insert Type
12.8.9 By Ship Inserts
12.8.10 By Country
12.8.10.1 South Africa
12.8.10.1.1 By Fit
12.8.10.1.2 By Application
12.8.10.1.3 By Aircraft Type
12.8.10.1.4 By Aircraft Insert Type
12.8.10.1.5 By Aircraft Inserts
12.8.10.1.7 By Ship Type
12.8.10.1.8 By Ship Insert Type
12.8.10.1.9 By Ship Inserts
13 Competitive Landscape (Page No. - 273)
13.1 Introduction
13.2 Aviation Galley Equipment Market Adopted Supply Contracts as A Key Strategy
13.3 Marine Galley Equipment Market Adopted New Prodcut Launch as A Key Strategy
13.4 Brand Analysis: Aviation Galley Equipment Market
13.5 Market Share Analysis
13.5.1 Aviation Galley Equipment: Market Share Analysis
13.5.2 Marine Galley Equipment: Market Share Analysis
13.6 Competitive Situation and Trends
13.6.1 Aviation Galley Equipment: Acquisitions, Collaborations, Contracts, Partnerships and Agreements
13.6.2 Marine Galley Equipment: Acquisitions, Collaborations, Contracts, Partnerships and Agreements
13.6.3 Aviation Galley Equipment: New Product Developments
13.6.4 Marine Galley Equipment: New Product Developments
13.6.5 Aviation Galley Equipment: Expansions
14 Company Profiles (Page No. - 287)
(Company at A Glance, Recent Financials, Products & Services, Strategies & Insights, & Recent Developments)*
14.1 Introduction
14.2 Zodiac Aerospace
14.2.1 Business Overview
14.2.2 Product Offerings
14.2.3 Recent Developments
14.2.4 SWOT Analysis
14.2.5 MnM View
14.3 Diehl Stiftung & Co. Kg
14.3.1 Business Overview
14.3.2 Product Offerings
14.3.3 Recent Developments
14.3.4 SWOT Analysis
14.3.5 MnM View
14.4 B/E Aerospace Inc
14.4.1 Business Overview
14.4.2 Product Offerings
14.4.3 Recent Developments
14.4.4 SWOT Analysis
14.4.5 MnM View
14.5 Jamco Corporation
14.5.1 Business Overview
14.5.2 Product Offerings
14.5.3 Recent Developments
14.5.4 SWOT Analysis
14.5.5 MnM View
14.6 Meili Marine USA
14.6.1 Business Overview
14.6.2 Product Offerings
14.6.3 Recent Developments
14.6.4 MnM View
14.7 Diethelm Keller Aviation Pte Ltd.
14.7.1 Business Overview
14.7.2 Product Offerings
14.8 Air Cabin Engineering Inc.
14.8.1 Business Overview
14.8.2 Product Offerings
14.9 Bucher Group
14.9.1 Business Overview
14.9.2 Product Offerings
14.10 Jeitek
14.10.1 Business Overview
14.10.2 Product Offerings
14.11 Loipart AB
14.11.1 Business Overview
14.11.2 Product Offerings
14.11.3 Recent Developments
14.12 Kang Li Far East Pte Ltd.
14.12.1 Business Overview
14.12.2 Product Offerings
14.13 Aerolux Limited
14.13.1 Business Overview
14.13.2 Product Offerings
14.13.3 Recent Developments
14.14 Aluminox S.A.
14.14.1 Business Overview
14.14.2 Product Offerings
*Details on Company at A Glance, Recent Financials, Products & Services, Strategies & Insights, & Recent Developments Might Not Be Captured in Case of Unlisted Companies.
15 Appendix (Page No. - 314)
15.1 Discussion Guide
15.2 Knowledge Store: Marketsandmarkets’ Subscription Portal
15.3 Introducing RT: Real Time Market Intelligence
15.4 Available Customizations
15.5 Related Reports
List of Tables (186 Tables)
Table 1 Galley Standardization Will Be the Primary Focus During the Forecast Period
Table 2 Global Galley Equipment Market, By Application (2015-20120)
Table 3 Aviation Market, By Aircrfat Type (2015-2012)
Table 4 Marine Galley Equipment Market, By Ship Type (2015-20120)
Table 5 Marine Market, By Marine Type (2015-20120)
Table 6 Aviation Market, By Aircraft Type (2015-20120)
Table 7 Aviation Market, By Insert Type (2015-2012)
Table 8 Aviation Galley Equipment Market, By Inserts (2015-2012)
Table 9 Marine Market, By Insert Type (2015-20120)
Table 10 Marine Market, By Inserts (2015-2012)
Table 12 Global Market, By Region, 2013-2020 (USD Million)
Table 12 Aviation Galley Equipment Market, By Fit, 2013-2020 (USD Million)
Table 13 Market, By Application, 2013-2020 (USD Million)
Table 14 North America: Market, By Fit, 2013-2020 (USD Million)
Table 15 North America: Market, By Application, 2013-2020 (USD Million)
Table 16 North America: Market, By Aircraft Type, 2013-2020 (USD Million)
Table 17 North America: Market, By Aviation Insert Type, 2013-2020 (USD Million)
Table 18 North America: Market, By Aviation Insert, 2013-2020 (USD Million)
Table 19 North America: Market, By Marine Type, 2013-2020 (USD Million)
Table 20 North America: Market, By Ship Type, 2013-2020 (USD Million)
Table 21 North America: Market, By Marine Insert Type, 2013-2020 (USD Million)
Table 22 North America: Market, By Marine Inserts, 2015-2020 (USD Million)
Table 23 North America: Market, By Country, 2013-2020 (USD Million)
Table 24 U.S.: Market, By Fit, 2013-2020 (USD Million)
Table 25 U.S.: Market, By Application, 2013-2020 (USD Million)
Table 26 U.S.: Market, By Aircraft Type, 2013-2020 (USD Million)
Table 27 U.S.: Market, By Aviation Insert Type, 2013-2020 (USD Million)
Table 28 U.S.: Market, By Aviation Inserts, 2013-2020 (USD Million)
Table 29 U.S.: Market, By Marine Type, 2013-2020 (USD Million)
Table 30 U.S.: Market, By Ships Type, 2013-2020 (USD Million)
Table 31 U.S.: Market, By Marine Insert Type, 2013-2020 (USD Million)
Table 32 U.S.: Market, By Marine Inserts, 2013-2020 (USD Million)
Table 33 Canada: Galley Equipment Market, By Fit, 2013-2020 (USD Million)
Table 34 Canada: Market, By Application, 2013-2020 (USD Million)
Table 35 Canada: Aviation Galley Equipment Market, By Aircraft Type, 2013-2020 (USD Million)
Table 36 Canada: Market, By Aviation Insert Type, 2013-2020 (USD Million)
Table 37 Canada: Market, By Aviation Inserts, 2013-2020 (USD Million)
Table 38 Canada: Market, By Marine Type, 2013-2020 (USD Million)
Table 39 Canada: Market, By Ship Type, 2013-2020 (USD Million)
Table 40 Canada: Market, By Marine Insert Type, 2013-2020 (USD Million)
Table 41 Canada: Market, By Marine Inserts, 2013-2020 (USD Million)
Table 42 Europe: Market, By Fit, 2013-2020 (USD Million)
Table 43 Europe: Market, By Application, 2013-2020 (USD Million)
Table 44 Europe: Aviation Galley Equipment Market, By Aircraft Type, 2013-2020 (USD Million)
Table 45 Europe: Market, By Aviation Insert Type, 2013-2020 (USD Million)
Table 46 Europe: Market, By Aviation Inserts, 2013-2020 (USD Million)
Table 47 Europe: Market, By Marine Type, 2013-2020 (USD Million)
Table 48 Europe: Market, By Ship Type, 2013-2020 (USD Million)
Table 49 Europe: Market, By Marine Insert Type, 2013-2020 (USD Million)
Table 50 Europe: Market, By Marine Inserts, 2013-2020 (USD Million)
Table 51 Europe: Market, By Country, 2013-2020 (USD Million)
Table 52 U.K.: Galley Equipment Market, By Fit, 2013-2020 (USD Million)
Table 53 U.K.: Market, By Application, 2013-2020 (USD Million)
Table 54 U.K.: Market, By Aircraft Type, 2013-2020 (USD Million)
Table 55 U.K.: Market, By Aviation Insert Type, 2013-2020 (USD Million)
Table 56 U.K.: Market, By Inserts, 2013-2020 (USD Million)
Table 57 U.K.: Market, By Marine Type, 2013-2020 (USD Million)
Table 58 U.K.: Market, By Ship Type, 2013-2020 (USD Million)
Table 59 U.K.: Market, By Marine Insert Type, 2013-2020 (USD Million)
Table 60 U.K.: Market, By Marine Inserts, 2013-2020 (USD Million)
Table 61 France: Market, By Fit, 2013-2020 (USD Million)
Table 62 France: Market, By Application, 2013-2020 (USD Million)
Table 63 France: Market, By Aircraft Type, 2013-2020 (USD Million)
Table 64 France: Market, By Aviation Insert Type, 2013-2020 (USD Million)
Table 65 France: Market, By Aviation Inserts, 2013-2020 (USD Million)
Table 66 France: Market, By Marine Type, 2013-2020 (USD Million)
Table 67 France: Market, By Ship Type, 2013-2020 (USD Million)
Table 68 France: Market, By Marine Insert Type, 2013-2020 (USD Million)
Table 69 France: Market, By Marine Inserts, 2013-2020 (USD Million)
Table 70 Germany: Market, By Fit, 2013-2020 (USD Million)
Table 71 Germany: Market, By Application, 2013-2020 (USD Million)
Table 72 Germany: Market, By Aircraft Type, 2013-2020 (USD Million)
Table 73 Germany: Market, By Aviation Insert Type, 2013-2020 (USD Million)
Table 74 Germany: Market, By Aviation Inserts, 2013-2020 (USD Million)
Table 75 Germany: Market, By Marine Type, 2013-2020 (USD Million)
Table 76 Germany: Market, By Ship Type, 2013-2020 (USD Million)
Table 77 Germany: Market, By Marine Insert Type, 2013-2020 (USD Million)
Table 78 Germany: Market, By Marine Inserts, 2013-2020 (USD Million)
Table 79 Asia-Pacific: Market, By Fit, 2013-2020 (USD Million)
Table 80 Asia-Pacific: Market, By Application, 2013-2020 (USD Million)
Table 81 Asia-Pacific: Industry, By Aircraft Type, 2013-2020 (USD Million)
Table 82 Asia-Pacific: Industry, By Aviation Insert Type, 2013-2020 (USD Million)
Table 83 Asia-Pacific: Industry, By Aviation Inserts, 2013-2020 (USD Million)
Table 84 Asia-Pacific: Industry, By Marine Type, 2013-2020 (USD Million)
Table 85 Asia-Pacific: Industry, By Ship Type, 2013-2020 (USD Million)
Table 86 Asia-Pacific: Industry, By Marine Insert Type, 2013-2020 (USD Million)
Table 87 Asia-Pacific: Marine Galley Equipment Market, By Marine Inserts, 2013-2020 (USD Million)
Table 88 Asia-Pacific: Market, By Country, 2013-2020 (USD Million)
Table 89 China: Market, By Fit, 2013-2020 (USD Million)
Table 90 China: Market, By Application, 2013-2020 (USD Million)
Table 91 China: Market, By Aircraft Type, 2013-2020 (USD Million)
Table 92 China: Market, By Aviation Insert Type, 2013-2020 (USD Million)
Table 93 China: Market, By Aviation Inserts, 2013-2020 (USD Million)
Table 94 China: Market, By Marine Type, 2013-2020 (USD Million)
Table 95 China: Market, By Ship Type, 2013-2020 (USD Million)
Table 96 China: Market, By Marine Insert Type, 2013-2020 (USD Million)
Table 97 China: Market, By Marine Inserts, 2013-2020 (USD Million)
Table 98 Japan: Galley Equipment Market, By Fit, 2013-2020 (USD Million)
Table 99 Japan: Market, By Application, 2013-2020 (USD Million)
Table 100 Japan: Market, By Aircraft Type, 2013-2020 (USD Million)
Table 101 Japan: Market, By Aviation Insert Type, 2013-2020 (USD Million)
Table 102 Japan: Market, By Aviation Inserts, 2013-2020 (USD Million)
Table 103 Japan: Market, By Marine Type, 2013-2020 (USD Million)
Table 104 Japan: Market, By Ship Type, 2013-2020 (USD Million)
Table 105 Japan: Market, By Marine Insert Type, 2013-2020 (USD Million)
Table 106 Japan: Market, By Marine Inserts, 2013-2020 (USD Million)
Table 107 India: Galley Equipment Market, By Fit, 2013-2020 (USD Million)
Table 108 India: Market, By Application, 2013-2020 (USD Million)
Table 109 India: Market, By Aircraft Type, 2013-2020 (USD Million)
Table 120 India: Market, By Aviation Insert Type, 2013-2020 (USD Million)
Table 121 India: Market, By Aviation Inserts, 2013-2020 (USD Million)
Table 122 India: Market, By Marine Type, 2013-2020 (USD Million)
Table 123 India: Market, By Ship Type, 2013-2020 (USD Million)
Table 124 India: Market, By Marine Insert Type, 2013-2020 (USD Million)
Table 125 India: Market, By Marine Inserts, 2013-2020 (USD Million)
Table 126 Middle-East Galley Equipment Market, By Fit, 2013-2020 (USD Million)
Table 127 Middle-East: Market, By Application, 2013-2020 (USD Million)
Table 128 Middle-East: Aviation Galley Equipment Market, By Aircraft Type, 2013-2020 (USD Million)
Table 129 Middle-East: Market, By Aviation Insert Type, 2013-2020 (USD Million)
Table 120 Middle-East: Market, By Aviation Inserts, 2013-2020 (USD Million)
Table 121 Middle-East: Marine Galley Equipment Market, By Marine Type, 2013-2020 (USD Million)
Table 122 Middle-East: Market, By Ship Type, 2013-2020 (USD Million)
Table 123 Middle-East: Market, By Marine Insert Type, 2013-2020 (USD Million)
Table 124 Middle-East: Market, By Marine Inserts, 2013-2020 (USD Million)
Table 125 Middle-East: Market, By Country, 2013-2020 (USD Million)
Table 126 U.A.E.: Galley Equipment Market, By Fit, 2013-2020 (USD Million)
Table 127 U.A.E.: Market, By Application, 2013-2020 (USD Million)
Table 128 U.A.E.: Aviation Galley Equipment Market, By Aircraft Type, 2013-2020 (USD Million)
Table 129 U.A.E.: Market, By Aviation Insert Type, 2013-2020 (USD Million)
Table 130 U.A.E.: Market, By Aviation Inserts, 2013-2020 (USD Million)
Table 131 U.A.E.: Marine Galley Equipment Market, By Marine Type, 2013-2020 (USD Million)
Table 132 U.A.E.: Market, By Ship Type, 2013-2020 (USD Million)
Table 133 U.A.E Marine.: Market, By Marine Insert Type, 2013-2020 (USD Million)
Table 134 U.A.E.: Marine Market, By Marine Inserts, 2013-2020 (USD Million)
Table 135 Saudi Arabia: Market, By Fit, 2013-2020 (USD Million)
Table 136 Saudi Arabia: Market, By Application, 2013-2020 (USD Million)
Table 137 Saudi Arabia: Aviation Galley Equipment Market, By Aircraft Type, 2013-2020 (USD Million)
Table 138 Saudi Arabia: Market, By Aviation Insert Type, 2013-2020 (USD Million)
Table 139 Saudi Arabia: Market, By Aviation Inserts, 2013-2020 (USD Million)
Table 140 Saudi Arabia: Market, By Marine Type, 2013-2020 (USD Million)
Table 141 Saudi Arabia: Market, By Ship Type, 2013-2020 (USD Million)
Table 142 Saudi Arabia: Market, By Marine Insert Type, 2013-2020 (USD Million)
Table 143 Saudi Arabia: Market, By Marine Inserts, 2013-2020 (USD Million)
Table 144 Latin America: Galley Equipment Market, By Fit, 2013-2020 (USD Million)
Table 145 Latin America: Market, By Application, 2013-2020 (USD Million)
Table 146 Latin America: Market, By Aircraft Type, 2013-2020 (USD Million)
Table 147 Latin America: Market, By Aviation Insert Type, 2013-2020 (USD Million)
Table 148 Latin America: Market, By Aviation Inserts, 2013-2020 (USD Million)
Table 149 Latin America: Market, By Marine Type, 2013-2020 (USD Million)
Table 150 Latin America: Market, By Ship, 2013-2020 (USD Million)
Table 151 Latin America: Market, By Marine Insert Type, 2013-2020 (USD Million)
Table 152 Latin America: Market, By Marine Inserts, 2013-2020 (USD Million)
Table 153 Latin America: Market, By Country, 2013-2020 (USD Million)
Table 154 Brazil: Galley Equipment Market, By Fit, 2013-2020 (USD Million)
Table 155 Brazil: Market, By Application, 2013-2020 (USD Million)
Table 156 Brazil: Market, By Aircraft Type, 2013-2020 (USD Million)
Table 157 Brazil: Market, By Aviation Insert Type, 2013-2020 (USD Million)
Table 158 Brazil: Market, By Aviation Inserts, 2013-2020 (USD Million)
Table 159 Brazil: Market, By Marine Type, 2013-2020 (USD Million)
Table 160 Brazil: Market, By Ship Type, 2013-2020 (USD Million)
Table 161 Brazil: Market, By Marine Insert Type, 2013-2020 (USD Million)
Table 162 Brazil: Market, By Marine Inserts, 2013-2020 (USD Million)
Table 163 Africa: Market, By Fit, 2013-2020 (USD Million)
Table 164 Africa: Galley Equipment Market, By Application, 2013-2020 (USD Million)
Table 165 Africa: Market, By Aircraft Type, 2013-2020 (USD Million)
Table 166 Africa: Market, By Aviation Insert Type, 2013-2020 (USD Million)
Table 167 Africa: Market, By Aviation Inserts, 2013-2020 (USD Million)
Table 168 Africa: Market, By Marine Type, 2013-2020 (USD Million)
Table 169 Africa: Market, By Ship Type, 2013-2020 (USD Million)
Table 170 Africa: Market, By Marine Insert Type, 2013-2020 (USD Million)
Table 171 Africa: Market, By Marine Inserts, 2013-2020 (USD Million)
Table 172 Africa: Market, By Country, 2013-2020 (USD Million)
Table 173 South Africa: Galley Equipment Market, By Fit, 2013-2020 (USD Million)
Table 174 South Africa: Market, By Application, 2013-2020 (USD Million)
Table 175 South Africa: Aviation Galley Equipment Market, By Aircraft Type, 2013-2020 (USD Million)
Table 176 South Africa: Market, By Aviation Insert Type, 2013-2020 (USD Million)
Table 177 South Africa: Market, By Aviation Inserts, 2013-2020 (USD Million)
Table 178 South Africa: Market, By Marine Type, 2013-2020 (USD Million)
Table 179 South Africa: Market, By Ship Type, 2013-2020 (USD Million)
Table 180 South Africa: Market, By Marine Insert Type, 2013-2020 (USD Million)
Table 181 South Africa: Market, By Marine Inserts, 2013-2020 (USD Million)
Table 182 Aviation Galley Equipment: Acquisitions, Collaborations, Contracts, Partnerships and Agreements, 2014-2016
Table 183 Marine Galley Equipment: Acquisitions, Collaborations, Contracts, Partnerships and Agreements, 2014-2016
Table 184 Aviation Galley Equipment: New Product Developments, 2013-2015
Table 185 Marine Galley Equipment: New Product Developments, 2013-2015
Table 186 Aviation Galley Equipment: Expansions, 2013-2015
List of Figures (240 Figures)
Figure 1 Galley Equipment: Markets Covered
Figure 2 Study Years
Figure 3 Galley Equipment Market Stakeholders
Figure 4 Research Design
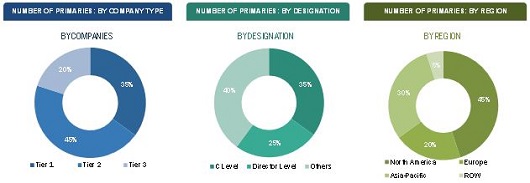
Figure 5 Breakdown of Primary Interviews: By Company Type, Designation and Region
Figure 6 World Passenger Air Traffic (In Terms of Rpk)
Figure 7 Global Maritime Fleet Size: By Total Number of Ships From 2012 to 2015
Figure 8 Maritime Fleet Size By Region, By Ship Type in 2015
Figure 9 Bottom-Up Approach
Figure 10 Top-Down Approach
Figure 12 Market Breakdown and Data Triangulation
Figure 12 Assumptions of the Research Study
Figure 13 Limitations of the Research Study
Figure 14 Geographic Analysis: Galley Equipment Market Share, 2015
Figure 15 Line Fit Segment has A Higher Market Share During the Forecast Period
Figure 16 Aviation Market is Expected to Be Driven By the Increase in Demand for Aircrafts During the Forecast Period
Figure 17 Aviation Electric Inserts Segment is Expected to Witness Strong Growth in the Next Few Years
Figure 18 Marine Non-Electric Inserts Segment is Expected to Show the Highest Growth Rate During the Forecast Period
Figure 19 New Product Launch and Supply Contracts Were the Key Strategies From 2012-2015
Figure 20 Increasing Demand for Aircraft and Ships, Will Drive the Galley Equipment Market, 2015-2020
Figure 21 Submarines has the Highest Potential for Investment in Marine Market During the Forecast Period
Figure 22 Commercial Sector is Estimated to Be the Most Lucrative Segment for Marine Galley Equipment Market (2015 vs 2020)
Figure 23 Aircraft Segment is Anticipated to Drive the Galley Equipment Market During the Forecast Period
Figure 24 Single-Aisle Aircraft Have Huge Potential to Drive the Market During the Forecast Period
Figure 25 Single Aisle Aircraft Segment is Estimated to Capture the Major Share in North America, 2014
Figure 26 Asia-Pacific is Projected to Grow at A High CAGR During the Forecast Period
Figure 27 Asia-Pacific has the Highest Market Share in Galley Equipment Market in 2015
Figure 28 Asia-Pacific Galley Equipment Market is Expected to Enter the Maturity Phase in Few Years
Figure 29 Market Segmentation
Figure 30 Market Segmentation: By Application
Figure 31 Market Segmentation: By Aviation Type
Figure 32 Market Segmentation: By Marine Type
Figure 33 Market Segmentation: By Insert Type (Aviation)
Figure 34 Market Segmentation: By Insert Type (Marine)
Figure 35 Market Dynamics for Galley Equipment Market
Figure 36 Number of Airplanes in Service vs Growth in Air Passenger Traffic (2010-2034)
Figure 37 Air Passenger Traffic Growth Rate By Region, 2015-2034
Figure 38 Value Chain Analysis: Galley Equipment Market
Figure 39 Supply Chain Analysis: Galley Equipment Market
Figure 40 Porter’s Five Forces Analysis: Galley Equipment Market
Figure 41 Global Galley Equipment Industry, By Application (2015-20120)
Figure 42 Industry, By Aircraft Type (2015-20120)
Figure 43 Industry, By Insert Type (2015-2020)
Figure 44 Market, By Inserts (2015-2012)
Figure 45 Market, By Insert Type (2015-20120)
Figure 46 Market, By Inserts (2015-2012)
Figure 47 Market, By Region, 2015-2020 (USD Million)
Figure 48 Market, By Fit, 2015-2020 (USD Million)
Figure 49 Galley Equipment Market, By Application, 2015-2020 (USD Million)
Figure 50 North America: Galley Equipment Market, By Fit, 2015-2020 (USD Million)
Figure 51 North America: Market, By Application, 2015-2020 (USD Million)
Figure 52 North America: Market, By Aircraft Type, 2015-2020 (USD Million)
Figure 53 North America: Market, By Aviation Insert Type, 2015-2020 (USD Million)
Figure 54 North America: Market, By Aviation Insert, 2015-2020 (USD Million)
Figure 55 North America: Market, By Marine Type, 2015-2020 (USD Million)
Figure 56 North America: Market, By Ship Type, 2015-2020 (USD Million)
Figure 57 North America: Market, By Marine Insert Type, 2015-2020 (USD Million)
Figure 58 North America: Market, By Marine Inserts, 2015-2020 (USD Million)
Figure 59 North America: Market, By Country, 2015-2020 (USD Million)
Figure 60 U.S.: Galley Equipment Market, By Fit, 2015-2020 (USD Million)
Figure 61 U.S.: Market, By Application, 2015-2020 (USD Million)
Figure 62 U.S.: Market, By Aircraft Type, 2015-2020 (USD Million)
Figure 63 U.S.: Market, By Aviation Insert Type, 2015-2020 (USD Million)
Figure 64 U.S.: Market, By Aviation Inserts, 2015-2020 (USD Million)
Figure 65 U.S.: Market, By Marine Type, 2015-2020 (USD Million)
Figure 66 U.S.: Market, By Ships Type, 2015-2020 (USD Million)
Figure 67 U.S.: Market, By Marine Insert Type, 2015-2020 (USD Million)
Figure 68 U.S.: Marine Galley Equipment Market, By Marine Inserts, 2015-2020 (USD Million)
Figure 69 Canada: Market, By Fit, 2015-2020 (USD Million)
Figure 70 Canada: Market, By Application, 2015-2020 (USD Million)
Figure 71 Canada: Aviation Galley Equipment Market, By Aircraft Type, 2015-2020 (USD Million)
Figure 72 Canada: Market, By Aviation Insert Type, 2013-2020 (USD Million)
Figure 73 Canada: Market, By Aviation Inserts, 2015-2020 (USD Million)
Figure 74 Canada: Market, By Marine Type, 2015-2020 (USD Million)
Figure 75 Canada: Market, By Ship Type, 2015-2020 (USD Million)
Figure 76 Canada: Market, By Marine Insert Type, 2015-2020 (USD Million)
Figure 77 Canada: Market, By Marine Inserts, 2015-2020 (USD Million)
Figure 78 Europe: Galley Equipment Market, By Fit, 2015-2020 (USD Million)
Figure 79 Europe: Market, By Application, 2015-2020 (USD Million)
Figure 80 Europe: Market, By Aircraft Type, 2015-2020 (USD Million)
Figure 81 Europe: Market, By Aviation Insert Type, 2015-2020 (USD Million)
Figure 82 Europe: Market, By Aviation Inserts, 2015-2020 (USD Million)
Figure 83 Europe: Market, By Marine Type, 2015-2020 (USD Million)
Figure 84 Europe: Market, By Ship Type, 2015-2020 (USD Million)
Figure 85 Europe: Market, By Marine Insert Type, 2015-2020 (USD Million)
Figure 86 Europe: Market, By Marine Inserts, 2015-2020 (USD Million)
Figure 87 Europe: Galley Equipment Market, By Country, 2015-2020 (USD Million)
Figure 88 U.K.: Market, By Fit, 2015-2020 (USD Million)
Figure 89 U.K.: Market, By Application, 2015-2020 (USD Million)
Figure 90 U.K.: Aviation Galley Equipment Market, By Aircraft Type, 2015-2020 (USD Million)
Figure 91 U.K.: Market, By Aviation Insert Type, 2015-2020 (USD Million)
Figure 92 U.K.: Market, By Aviation Inserts, 2015-2020 (USD Million)
Figure 93 U.K.: Market, By Marine Type, 2015-2020 (USD Million)
Figure 94 U.K.: Market, By Ship Type, 2015-2020 (USD Million)
Figure 95 U.K.: Market, By Marine Insert Type, 2015-2020 (USD Million)
Figure 96 U.K.: Market, By Marine Inserts, 2015-2020 (USD Million)
Figure 97 France: Galley Equipment Market, By Fit, 2015-2020 (USD Million)
Figure 98 France: Market, By Application, 2015-2020 (USD Million)
Figure 99 France: Aviation Galley Equipment Market, By Aircraft Type, 2015-2020 (USD Million)
Figure 100 France: Market, By Aviation Insert Type, 2015-2020 (USD Million)
Figure 101 France: Market, By Aviation Inserts, 2015-2020 (USD Million)
Figure 102 France: Market, By Marine Type, 2015-2020 (USD Million)
Figure 103 France: Market, By Ship Type, 2013-2020 (USD Million)
Figure 104 France: Market, By Marine Insert Type, 2015-2020 (USD Million)
Figure 105 France: Market, By Marine Inserts, 2015-2020 (USD Million)
Figure 106 Germany: Market, By Fit, 2015-2020 (USD Million)
Figure 107 Germany: Market, By Application, 2015-2020 (USD Million)
Figure 108 Germany: Market, By Aircraft Type, 2015-2020 (USD Million)
Figure 109 Germany: Market, By Aviation Insert Type, 2015-2020 (USD Million)
Figure 120 Germany: Market, By Aviation Inserts, 2015-2020 (USD Million)
Figure 121 Germany: Market, By Marine Type, 2015-2020 (USD Million)
Figure 122 Germany: Market, By Ship Type, 2015-2020 (USD Million)
Figure 123 Germany: Market, By Marine Insert Type, 2015-2020 (USD Million)
Figure 124 Germany: Market, By Marine Inserts, 2015-2020 (USD Million)
Figure 125 Asia-Pacific: Market, By Fit, 2015-2020 (USD Million)
Figure 126 Asia-Pacific: Market, By Application, 2015-2020 (USD Million)
Figure 127 Asia-Pacific: Market, By Aircraft Type, 2015-2020 (USD Million)
Figure 128 Asia-Pacific: Market, By Insert Type, 2015-2020 (USD Million)
Figure 129 Asia-Pacific: Market, By Aviation Inserts, 2015-2020 (USD Million)
Figure 120 Asia-Pacific: Market, By Marine Type, 2015-2020 (USD Million)
Figure 121 Asia-Pacific: Market, By Ship Type, 2015-2020 (USD Million)
Figure 122 Asia-Pacific: Market, By Marine Insert Type, 2015-2020 (USD Million)
Figure 123 Asia-Pacific: Market, By Marine Inserts, 2015-2020 (USD Million)
Figure 124 Asia-Pacific: Market, By Country, 2015-2020 (USD Million)
Figure 125 China: Market, By Fit, 2015-2020 (USD Million)
Figure 126 China: Industry, By Application, 2015-2020 (USD Million)
Figure 127 China: Industry, By Aircraft Type, 2015-2020 (USD Million)
Figure 128 China: Industry, By Aviation Insert Type, 2015-2020 (USD Million)
Figure 129 China: Industry, By Aviation Inserts, 2015-2020 (USD Million)
Figure 130 China: Industry, By Marine Type, 2015-2020 (USD Million)
Figure 131 China: Industry, By Ship Type, 2015-2020 (USD Million)
Figure 132 China: Industry, By Marine Insert Type, 2015-2020 (USD Million)
Figure 133 China: Industry, By Marine Inserts, 2015-2020 (USD Million)
Figure 134 Japan: Industry, By Fit, 2015-2020 (USD Million)
Figure 135 Japan: Industry, By Application, 2015-2020 (USD Million)
Figure 136 Japan: Industry, By Aircraft Type, 2015-2020 (USD Million)
Figure 137 Japan: Industry, By Aviation Insert Type, 2015-2020 (USD Million)
Figure 138 Japan: Market, By Aviation Inserts, 2015-2020 (USD Million)
Figure 139 Japan: Market, By Marine Type, 2015-2020 (USD Million)
Figure 140 Japan: Market, By Ship Type, 2015-2020 (USD Million)
Figure 141 Japan: Market, By Marine Insert Type, 2015-2020 (USD Million)
Figure 142 Japan: Market, By Marine Inserts, 2015-2020 (USD Million)
Figure 143 India: Market, By Fit, 2015-2020 (USD Million)
Figure 144 India: Market, By Application, 2015-2020 (USD Million)
Figure 145 India: Market, By Aircraft Type, 2015-2020 (USD Million)
Figure 146 India: Market, By Aviation Insert Type, 2015-2020 (USD Million)
Figure 147 India: Market, By Aviation Inserts, 2015-2020 (USD Million)
Figure 148 India: Market, By Marine Type, 2015-2020 (USD Million)
Figure 149 India: Market, By Ship Type, 2015-2020 (USD Million)
Figure 150 India: Market, By Marine Insert Type, 2015-2020 (USD Million)
Figure 151 India: Market, By Marine Inserts, 2015-2020 (USD Million)
Figure 152 Middle-East: Market, By Fit, 2015-2020 (USD Million)
Figure 153 Middle-East: Industry, By Application, 2015-2020 (USD Million)
Figure 154 Middle-East: Industry, By Aircraft Type, 2015-2020 (USD Million)
Figure 155 Middle-East: Industry, By Aviation Insert Type, 2015-2020 (USD Million)
Figure 156 Middle-East: Industry, By Aviation Inserts, 2015-2020 (USD Million)
Figure 157 Middle-East: Industry, By Marine Type, 2015-2020 (USD Million)
Figure 158 Middle-East: Industry, By Ship Type, 2015-2020 (USD Million)
Figure 159 Middle-East: Industry, By Marine Insert Type, 2015-2020 (USD Million)
Figure 160 Middle-East: Industry, By Marine Inserts, 2015-2020 (USD Million)
Figure 161 Middle-East: Market, By Country, 2015-2020 (USD Million)
Figure 162 U.A.E.: Industry, By Fit, 2015-2020 (USD Million)
Figure 163 U.A.E.: Market, By Application, 2015-2020 (USD Million)
Figure 164 U.A.E.: Industry, By Aircraft Type, 2015-2020 (USD Million)
Figure 165 U.A.E.: Market, By Aviation Insert Type, 2015-2020 (USD Million)
Figure 166 U.A.E.: Market, By Aviation Inserts, 2015-2020 (USD Million)
Figure 167 U.A.E.: Market, By Marine Type, 2015-2020 (USD Million)
Figure 168 U.A.E.: Industry, By Ship Type, 2015-2020 (USD Million)
Figure 169 U.A.E.: Market, By Marine Insert Type, 2015-2020 (USD Million)
Figure 170 U.A.E.: Market, By Marine Inserts, 2015-2020 (USD Million)
Figure 171 Saudi Arabia: Market, By Fit, 2015-2020 (USD Million)
Figure 172 Saudi Arabia: Market, By Application, 2015-2020 (USD Million)
Figure 173 Saudi Arabia: Market, By Aircraft Type, 2015-2020 (USD Million)
Figure 174 Saudi Arabia: Industry, By Aviation Insert Type, 2015-2020 (USD Million)
Figure 175 Saudi Arabia: Market, By Aviation Inserts, 2015-2020 (USD Million)
Figure 176 Saudi Arabia: Industry, By Marine Type, 2015-2020 (USD Million)
Figure 177 Saudi Arabia: Market, By Ship Type, 2015-2020 (USD Million)
Figure 178 Saudi Arabia: Market, By Marine Insert Type, 2015-2020 (USD Million)
Figure 179 Saudi Arabia: Market, By Marine Inserts, 2015-2020 (USD Million)
Figure 180 Latin America: Market, By Fit, 2015-2020 (USD Million)
Figure 181 Latin America: Industry, By Application, 2015-2020 (USD Million)
Figure 182 Latin America: Market, By Aircraft Type, 2015-2020 (USD Million)
Figure 183 Latin America: Industry, By Aviation Insert Type, 2015-2020 (USD Million)
Figure 184 Latin America: Market, By Aviation Inserts, 2015-2020 (USD Million)
Figure 185 Latin America: Market, By Marine Type, 2015-2020 (USD Million)
Figure 186 Latin America: Market, By Ship Type, 2015-2020 (USD Million)
Figure 187 Latin America: Industry, By Marine Insert Type, 2015-2020 (USD Million)
Figure 188 Latin America: Market, By Marine Inserts, 2015-2020 (USD Million)
Figure 189 Latin America: Market, By Country, 2015-2020 (USD Million)
Figure 190 Brazil: Galley Equipment Market, By Fit, 2015-2020 (USD Million)
Figure 191 Brazil: Market, By Application, 2015-2020 (USD Million)
Figure 192 Brazil: Market, By Aircraft Type, 2015-2020 (USD Million)
Figure 193 Brazil: Industry, By Aviation Insert Type, 2015-2020 (USD Million)
Figure 194 Brazil: Industry, By Aviation Inserts, 2015-2020 (USD Million)
Figure 195 Brazil: Market, By Marine Type, 2015-2020 (USD Million)
Figure 196 Brazil: Market, By Ship Type, 2015-2020 (USD Million)
Figure 197 Brazil: Market, By Marine Insert Type, 2015-2020 (USD Million)
Figure 198 Brazil: Industry, By Marine Inserts, 2015-2020 (USD Million)
Figure 199 Africa: Market, By Fit, 2015-2020 (USD Million)
Figure 200 Africa: Industry, By Application, 2015-2020 (USD Million)
Figure 201 Africa: Market, By Aircraft Type, 2015-2020 (USD Million)
Figure 202 Africa: Market, By Aviation Insert Type, 2015-2020 (USD Million)
Figure 203 Africa: Market, By Aviation Inserts, 2015-2020 (USD Million)
Figure 204 Africa: Industry, By Marine Type, 2015-2020 (USD Million)
Figure 205 Africa: Market, By Ship Type, 2015-2020 (USD Million)
Figure 206 Africa: Market, By Marine Insert Type, 2015-2020 (USD Million)
Figure 207 Africa: Industry, By Marine Inserts, 2015-2020 (USD Million)
Figure 208 Africa: Market, By Country, 2015-2020 (USD Million)
Figure 209 South Africa: Galley Equipment Market, By Fit, 2015-2020 (USD Million)
Figure 210 South Africa: Market, By Application, 2015-2020 (USD Million)
Figure 212 South Africa: Industry, By Aircraft Type, 2015-2020 (USD Million)
Figure 212 South Africa: Market, By Aviation Insert Type, 2015-2020 (USD Million)
Figure 213 South Africa: Market, By Aviation Inserts, 2015-2020 (USD Million)
Figure 214 South Africa: Industry, By Marine Type, 2015-2020 (USD Million)
Figure 215 South Africa: Market, By Ship Type, 2015-2020 (USD Million)
Figure 216 South Africa: Market, By Marine Insert Type, 2015-2020 (USD Million)
Figure 217 South Africa: Marine Galley Equipment Market, By Marine Inserts, 2015-2020 (USD Million)
Figure 218 Companies Adopted Partnership & New Product Launches as Key Growth Strategies From 2012 to 2015
Figure 219 Companies Adopted Supply Contracts, Partnership & New Product Launches as Key Growth Strategies From 2012 to 2015
Figure 220 Brand Analysis of Aviation Galley Equipment Market
Figure 221 Brand Analysis of Market
Figure 222 Market Share, By Key Player, 2014
Figure 223 Marine Market Share, By Key Player, 2014
Figure 224 Aviation Market Evolution Framework 2013-2015
Figure 225 Marine Market Evolution Framework 2015-2016
Figure 226 Aviation Galley Equipment: Battle for Market Share, 2013-2015
Figure 227 Marine Galley Equipment: Battle for Market Share, 2013-2015
Figure 228 Geographic Revenue Mix of Top Five Market Players
Figure 229 Zodiac Aerospace: Company Snapshot
Figure 230 SWOT Analysis: Zodiac Aerospace
Figure 231 Diehl Stiftung & Co. Kg: Company Snapshot
Figure 232 SWOT Analysis: Diehl Stiftung & Co. Kg
Figure 233 B/E Aerospace Inc : Company Snapshot
Figure 234 SWOT Analysis: B/E Aerospace Inc
Figure 235 Jamco Corporation : Company Snapshot
Figure 236 SWOT Analysis: Jamco Corporation
Figure 237 Meili Marine USA : Company Snapshot
Figure 238 Diethelm Keller Aviation Pte Ltd. : Company Snapshot
Figure 239 Marketsandmarkets Knowledge Store Snapshot
Figure 240 Marketsandmarkets Knowledge Store: Aerospace & Defence Industry Snapshot
The market size estimations for various segments and sub segments of this market were arrived at through extensive secondary research using various sources, such as directories, paid databases, such as Hoovers, Factiva and Business Week, among others. Research also has been carried out by corroboration with primaries, and further market triangulation with the help of statistical techniques using econometric tools. All primary sources from different levels have been interviewed to obtain and verify critical qualitative and quantitative information, as well as to assess future prospects of the market. Key players in the industry have been identified through secondary research, and their market values determined through primary and secondary research. The breakdown of profiles of primary discussion participants are depicted in the below figure:
To know about the assumptions considered for the study, download the pdf brochure
The ecosystem of the galley equipment market comprises suppliers, technology vendors, manufacturers, distributers, wholesalers, and retailers, as well as aviation and marine authorities. The major players in the galley equipment market include B/E Aerospace (U.S.), Zodiac Aerospace (France), JAMCO Corporation (Japan), and Diehl Stiftung & Co. KG (Germany), and Meili Marine (U.S.), among others. Contracts and agreements comprise the major strategy adopted by the players in the global galley equipment market, followed by new product launches.
Target Audience
- Original Equipment (galley) Manufacturers
- Technology Support Providers
- Raw Material Suppliers
- Maintenance, Repair, and Operations Providers
Scope of the Report
Galley Equipment Market, By Application
-
Aviation
- Single-aisle
- Twin-aisle
- Business general aviation
-
Marine
- Defense
- Commercial
Galley Equipment Market, By Aircraft Type
- Single-aisle
- Twin-aisle
- Business general aviation
Galley Equipment Market, By Ship Type
- Surface Ships
- Amphibious Ships
- Passenger Vessels
- Recreational Boats
- Bulk Carriers
Galley Equipment Market, By Insert Type
-
Aviation Galleys
- Electric Insert
- Non-Electric Insert
-
Ship Galleys
- Electric Insert
- Non-Electric Insert
Galley Equipment Market, By Fit
- Line Fit
- Retro Fit
Galley Equipment Market, By Region
- North America
- Europe
- Asia-Pacific
- Middle East
- Latin America
- Africa
Available Customizations
With the given market data, MarketsandMarkets offers customizations in accordance to company-specific requirements.
The following customization options are available for the report:
-
Product analysis
- Product matrix, which gives a detailed analysis of each of the system function
-
Geographic Analysis
- Further breakdown of the Rest of Asia-Pacific galley equipment market into Australia, New Zealand and others
- Further breakdown of the Latin American galley equipment market into Brazil, Argentina and Rest of Latin America
-
Geographic Analysis
- Detailed analysis and profiling of additional market players (Up to 5)


Growth opportunities and latent adjacency in Galley Equipment Market