Air Quality Monitoring Software Market by Application (Indoor and Outdoor), End-User (Industrial, Commercial, Urban Air Quality Monitoring Agencies, and Government Agencies and Research Institutes), and Region - Global Forecast to 2022


[153 Pages Report] The global air quality monitoring software market was valued at USD 367.0 Million in 2016 and is projected to reach USD 544.6 Million by 2022, at a CAGR of 7.05%, from 2017 to 2022.
The years considered for the study are as follows:
- Base Year: 2016
- Estimated Year: 2017
- Projected Year: 2022
- Forecast Period: 2017�2022
The base year considered for company profiles is 2016. Whenever information was unavailable for the base year, the prior year has been considered.
Objectives of the Study
- To define and segment the market with respect to application, end-user, and region
- To provide detailed information on the major factors influencing the growth of the market (drivers, restraints, opportunities, and industry-specific challenges)
- To strategically analyze the market with respect to individual growth trends, future expansions, and contributions to the air quality monitoring software market
- To analyze market opportunities for stakeholders and details of a competitive landscape for market leaders
- To forecast the growth of the market with respect to the major regions (North America, Asia Pacific, Europe, and the rest of the world, which includes Latin America, the Middle East, and Africa)
- To strategically profile key players and comprehensively analyze their market rankings and core competencies
- To analyze competitive developments such as new product launches, mergers & acquisitions, expansions and investments, and contracts & agreements in the market
Research Methodology
This research study involved the use of extensive secondary sources, directories, journals on air quality monitoring and other related air monitoring markets, and newsletters and databases such as Hoover�s, Bloomberg, Businessweek, and Factiva, to identify and collect information useful for a technical, market-oriented, and commercial study of the global market. The primary sources include several industry experts from core and related industries, vendors, preferred suppliers, technology developers, alliances, and organizations related to all the segments of this industry�s value chain. The research methodology has been explained below.
- Study of annual revenues and market developments of the major players providing air quality monitoring software market
- Assessment of future trends and growth of end-users
- Assessment of the market with respect to the technology used for different applications
After arriving at the overall market size, the total market was split into several segments and subsegments. The figure given below illustrates the breakdown of the primary interviews conducted during the research study based on company type, designation, and region.
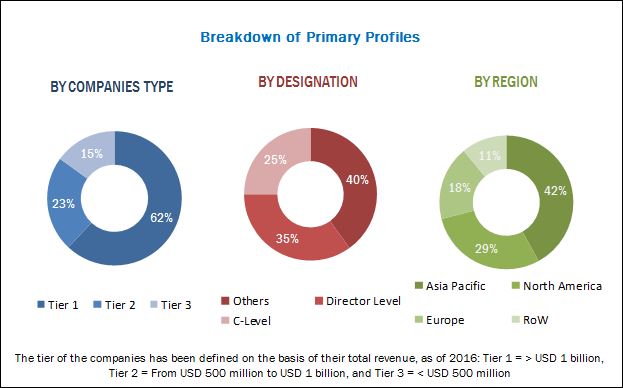
To know about the assumptions considered for the study, download the pdf brochure
Target Audience:
- Air quality monitoring software providers
- Research laboratories and academic institutes
- Air pollution monitoring committees
- Pharmaceutical and biotechnology companies
- Government agencies
- National and regional air pollution control boards and organizations
- Petrochemical and biofuel product manufacturing companies
- Oil & gas companies
- Gas operators, distributors, and regulators
Scope of the Report:
- By Application
- Indoor Application
- Outdoor Application
- By End-User
- Industries
- Commercial Bodies
- Urban Air Quality Monitoring Agencies
- Government Agencies and Research Institutes
- Others (Residential Buildings, Old Age Homes, and Small Infrastructure)
- By Region
- North America
- Europe
- Asia Pacific
- Rest of the World
Available Customizations:
With the given market data, MarketsandMarkets offers customizations as per the client�s specific needs. The following customization options are available for this report:
Company Information
Detailed analyses and profiling of additional market players (up to 5)
The global air quality monitoring software market is projected to grow at a CAGR of 7.05%, from 2017 to 2022, to reach a market size of USD 544.6 Million by 2022. This growth can be attributed to the increase in rapid industrialization, rising global levels of air pollution, increasing public awareness of healthcare, and government regulations for effective air pollution monitoring and control.
The report segments the air quality monitoring software market, by application, into indoor and outdoor. The indoor application segment is expected to grow at the highest CAGR during the forecast period. Indoor application refers to the air quality within and around buildings and indoor spaces. Indoor air quality monitoring is an important step in the precise assessment and control of indoor air pollution. Indoor air quality is negatively impacted by gases, dust, particulate matter, smoke, pesticides, volatile organic compounds (VOCs) from paints and varnishes, solvents, odors, microbial contaminants, and occupation-related contaminants. The main causes of poor indoor air quality vary depending on the type of building.
The report segments the air quality monitoring software market, by end-user, into industries, commercial bodies, urban air quality monitoring agencies, government agencies and research institutes, and others. The government agencies and research institutes segment is estimated to be the fastest growing market, by end-user, in 2017. They mainly use outdoor AQM equipment and software. Key air quality projects are run by governments to monitor air quality around cities and in major areas, which require outdoor AQM equipment and software. Moreover, the end-use software in this segment is required to monitor the ambient air. Government agencies and research institutes have limited use for indoor AQM equipment and software.
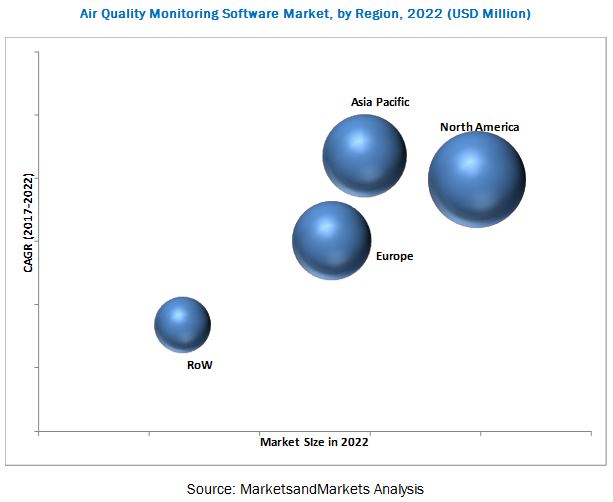
In this report, the air quality monitoring software market has been analyzed with respect to four regions, namely, North America, Europe, Asia Pacific, and the rest of the world. The market in Asia Pacific is estimated to be the fastest growing market, from 2017 to 2022. Factors such as large-scale industrialization, implementation of stringent air pollution regulations across major Asian countries, and continuous government support for the development and commercialization of advanced products are the driving factors for the market. Being one of the major manufacturing hubs for various industries, such as chemical, petrochemical processing, and metals and mining, there is an increased demand for air quality sensors and monitors in Asia Pacific. The market in China is expected to be the fastest growing among the countries in Asia Pacific, during the forecast period.
The North American air quality monitoring software market is expected to lead the market during the forecast period. The North American market is a mature market, with the increased use of advanced pollution monitoring technologies by key end-users and the presence of well-established distribution channels for the supply of air quality monitoring products. Easy accessibility and the fast adoption of advanced technologies due to significant expenditure by the US and Canadian governments and the presence of government regulations to promote the adoption of air quality monitoring devices among key end-users are the major factors driving market growth in this region.
High product costs associated with air quality monitoring solutions and rise in adoption of alternate and renewable sources of energy could act as restraints for the market, leading to a decline in profits. The players in the market provide services to developing and underdeveloped nations where government regulations are stringent.
The leading players in the air quality monitoring software market include Environnement S.A. (France), Cambridge Environmental Research Consultants Ltd (UK), 3M Company (US), KISTERS AG (Germany), and Robert Bosch GmbH (Germany). New product launches was the most commonly adopted strategy by the top players. This was followed by contracts & agreements, joint ventures, collaborations, mergers & acquisitions, and expansions and investments.
To speak to our analyst for a discussion on the above findings, click Speak to Analyst
 Exclusive indicates content/data unique to MarketsandMarkets and not available with any competitors.
Table of Contents
1 Introduction (Page No. - 14)
1.1 Objectives of the Study
1.2 Market Definition
1.3 Markets Covered
1.4 Years Considered for the Study
1.5 Currency
1.6 Limitations
1.7 Stakeholders
2 Research Methodology (Page No. - 17)
2.1 Introduction
2.1.1 Secondary Data
2.1.1.1 Key Data From Secondary Sources
2.1.2 Primary Data
2.1.2.1 Key Data From Primary Sources
2.1.2.2 Key Industry Insights
2.1.2.3 Breakdown of Primaries
2.2 Market Size Estimation
2.2.1 Bottom-Up Approach
2.2.2 Top-Down Approach
2.3 Market Breakdown & Data Triangulation
2.4 Research Assumptions
3 Executive Summary (Page No. - 26)
4 Premium Insights (Page No. - 30)
4.1 Attractive Opportunities in the Air Quality Monitoring Software Market, 2017�2022
4.2 Asia Pacific Market Size, By End-User and By Country
4.3 Market, By Region, 2016
4.4 Market, By End-User, 2017 & 2022
4.5 Market, By Application, 2017 & 2022
5 Market Overview (Page No. - 34)
5.1 Introduction
5.2 Market Dynamics
5.2.1 Drivers
5.2.1.1 Increasing Public Awareness Related to Healthcare and Environmental Implications of Air Pollution
5.2.1.2 Growing Initiatives for the Development of Environment-Friendly Industries
5.2.1.3 Supporting Government Regulations for Effective Air Pollution Monitoring and Control
5.2.2 Restraints
5.2.2.1 Rising Adoption of Alternate and Renewable Sources of Energy
5.2.2.2 High Product Costs Associated With Air Quality Monitoring Solutions
5.2.3 Opportunities
5.2.3.1 Growing Industrial Sector to Drive the Need for Air Quality Monitoring
5.2.3.2 Technological Advancements in the Field of Air Pollution Monitoring
5.2.4 Challenges
5.2.4.1 Slow and Ineffective Implementation of Pollution Control Reforms
6 Market, By Application (Page No. - 41)
6.1 Introduction
6.2 Indoor Application
6.3 Outdoor Application
7 Market, By End-User (Page No. - 45)
7.1 Introduction
7.2 Industries
7.3 Government Agencies and Research Institutes
7.4 Commercial Bodies
7.5 Urban Air Quality Monitoring Agencies
7.6 Others
8 Quality Monitoring Software Market, By Region (Page No. - 52)
8.1 Introduction
8.2 North America
8.2.1 By Application
8.2.2 By End-User
8.2.3 By Country
8.2.3.1 the US
8.2.3.2 Canada
8.3 Europe
8.3.1 By Application
8.3.2 By End-User
8.3.3 By Country
8.3.3.1 The UK
8.3.3.2 Germany
8.3.3.3 France
8.3.3.4 The Rest of Europe
8.4 Asia Pacific
8.4.1 By Application
8.4.2 By End-User
8.4.3 By Country
8.4.3.1 China
8.4.3.2 Japan
8.4.3.3 India
8.4.3.4 Malaysia
8.4.3.5 Indonesia
8.4.3.6 The Rest of Asia Pacific
8.5 The Rest of the World
8.5.1 By Application
8.5.2 By End-User
8.5.3 By Country
8.5.3.1 Brazil
8.5.3.2 Argentina
8.5.3.3 Saudi Arabia
8.5.3.4 Chile
8.5.3.5 Turkey
8.5.3.6 Israel
8.5.3.7 The UAE
8.5.3.8 South Africa
9 Competitive Landscape (Page No. - 90)
9.1 Introduction
9.2 Market Ranking Analysis
9.2.1 Global Market Scenario
9.3 Competitive Situation & Trends
10 Company Profiles (Page No. - 94)
10.1 Environnement S.A
10.2 Cambridge Environmental Research Consultants Ltd
10.3 3M Company
10.4 Kisters AG
10.5 Robert Bosch GmbH
10.6 Teledyne Technologies Incorporated
10.7 Aeroqual Limited
10.8 Horiba, Ltd.
10.9 OPSIS AB
10.10 Lakes Environmental Software
10.11 Air Monitors Ltd
10.12 Br�el & Kj�r Sound & Vibration Measurement A/S
10.13 Lumasense Technologies, Inc.
10.14 IPS Meteostar, Inc.
11 Appendix (Page No. - 128)
11.1 Insights of Industry Experts
11.2 Discussion Guide
11.3 Knowledge Store: Marketsandmarkets� Subscription Portal
11.4 Introducing RT: Real Time Market Intelligence
11.5 Available Customizations
11.6 Related Reports
11.7 Author Details
List of Tables (63 Tables)
Table 1 Global Air Quality Monitoring Software Market Snapshot
Table 2 Global Market Size, By Application, 2015�2022 (USD Million)
Table 3 Indoor Application: Market Size, By Region, 2015�2022 (USD Million)
Table 4 Outdoor Application: Market Size, By Region, 2015�2022 (USD Million)
Table 5 Global Market Size, By End-User, 2015�2022 (USD Million)
Table 6 Industries: Market Size, By Region, 2015�2022 (USD Million)
Table 7 Government Agencies and Research Institutes: Market Size, By Region, 2015�2022 (USD Million)
Table 8 Commercial Bodies: Market Size, By Region, 2015�2022 (USD Million)
Table 9 Urban Air Quality Monitoring Agencies: Market Size, By Region, 2015�2022 (USD Million)
Table 10 Others: Market Size, By Region, 2015�2022 (USD Million)
Table 11 Global Market Size, By Region, 2015� 2022 (USD Million)
Table 12 North America: Market Size, By Application, 2015�2022 (USD Million)
Table 13 North America: Market Size, By End-User, 2015�2022 (USD Million)
Table 14 North America: Market Size, By Country, 2015�2022 (USD Million)
Table 15 The US: Market Size, By Application, 2015�2022 (USD Million)
Table 16 The US: By Market Size, By End-User, 2015�2022 (USD Million)
Table 17 Canada: Market Size, By Application, 2015�2022 (USD Million)
Table 18 Canada: By Market Size, By End-User, 2015�2022 (USD Million)
Table 19 Europe: Market Size, By Application, 2015�2022 (USD Million)
Table 20 Europe: By Market Size, By End-User, 2015�2022 (USD Million)
Table 21 Europe: By Market Size, By Country, 2015�2022 (USD Million)
Table 22 The UK: Market Size, By Application, 2015�2022 (USD Million)
Table 23 The UK: By Market Size, By End-User, 2015�2022 (USD Million)
Table 24 Germany: Market Size, By Application, 2015�2022 (USD Million)
Table 25 Germany: By Market Size, By End-User, 2015�2022 (USD Million)
Table 26 France: Market Size, By Application, 2015�2022 (USD Million)
Table 27 France: By Market Size, By End-User, 2015�2022 (USD Million)
Table 28 The Rest of Europe: Market Size, By Application, 2015�2022 (USD Million)
Table 29 The Rest of Europe: By Market Size, By End-User, 2015�2022 (USD Million)
Table 30 Asia Pacific: Market Size, By Application, 2015�2022 (USD Million)
Table 31 Asia Pacific: By Market Size, By End-User, 2015�2022 (USD Million)
Table 32 Asia Pacific: By Market Size, By Country, 2015�2022 (USD Million)
Table 33 China: Market Size, By Application, 2015�2022 (USD Million)
Table 34 China: By Market Size, By End-User, 2015�2022 (USD Million)
Table 35 Japan: Market Size, By Application, 2015�2022 (USD Million)
Table 36 Japan: By Market Size, By End-User, 2015�2022 (USD Million)
Table 37 India: Market Size, By Application, 2015�2022 (USD Million)
Table 38 India: By Market Size, By End-User, 2015�2022 (USD Million)
Table 39 Malaysia: Market Size, By Application, 2015�2022 (USD Million)
Table 40 Malaysia: By Market Size, By End-User, 2015�2022 (USD Million)
Table 41 Indonesia: Market Size, By Application, 2015�2022 (USD Million)
Table 42 Indonesia: By Market Size, By End-User, 2015�2022 (USD Million)
Table 43 The Rest of Asia Pacific: Market Size, By Application, 2015�2022 (USD Million)
Table 44 The Rest of Asia Pacific: By Market Size, By End-User, 2015�2022 (USD Million)
Table 45 The Rest of the World: Market Size, By Application, 2015�2022 (USD Million)
Table 46 The Rest of the World: By Market Size, By End-User, 2015�2022 (USD Million)
Table 47 The Rest of the World: By Market Size, By Country, 2015�2022 (USD Million)
Table 48 Brazil: Market Size, By Application, 2015�2022 (USD Million)
Table 49 Brazil: By Market Size, By End-User, 2015�2022 (USD Million)
Table 50 Argentina: Market Size, By Application, 2015�2022 (USD Million)
Table 51 Argentina: By Market Size, By End-User, 2015�2022 (USD Million)
Table 52 Saudi Arabia: Market Size, By Application, 2015�2022 (USD Million)
Table 53 Saudi Arabia: By Market Size, By End-User, 2015�2022 (USD Million)
Table 54 Chile: Market Size, By Application, 2015�2022 (USD Million)
Table 55 Chile: By Market Size, By End-User, 2015�2022 (USD Million)
Table 56 Turkey: Market Size, By Application, 2015�2022 (USD Million)
Table 57 Turkey: By Market Size, By End-User, 2015�2022 (USD Million)
Table 58 Israel: Market Size, By Application, 2015�2022 (USD Million)
Table 59 Israel: By Market Size, By End-User, 2015�2022 (USD Million)
Table 60 The UAE: Market Size, By Application, 2015�2022 (USD Million)
Table 61 The UAE: By Market Size, By End-User, 2015�2022 (USD Million)
Table 62 South Africa: Market Size, By Application, 2015�2022 (USD Million)
Table 63 South Africa: By Market Size, By End-User, 2015�2022 (USD Million)
List of Figures (30 Figures)
Figure 1 Markets Covered: Global Air Quality Monitoring Software Market
Figure 2 Global Market: Research Design
Figure 3 Breakdown of Primary Interviews: By Company Type, Designation, & Region
Figure 4 Market Size Estimation Methodology: Bottom-Up Approach
Figure 5 Market Size Estimation Methodology: Top-Down Approach
Figure 6 Global Market: Market Estimation Approach & Data Triangulation Methodology
Figure 7 The North American Market Dominated the Market in 2016
Figure 8 The Industries Segment is Expected to Lead the Market, By End-User, During the Forecast Period
Figure 9 Indoor Application to Dominate During the Forecast Period
Figure 10 Supportive Government Regulations for Effective Air Pollution Monitoring and Control is Expected to Drive the Air Quality Monitoring Software During Period
Figure 11 The Industries Segment By End-User and China By Country Held the Maximum Share in the Market in 2016
Figure 12 The North American Market is Expected to Hold the Largest Share in 2016
Figure 13 The Government Agencies & Research Institutes Segment is Expected to Grow at the Highest Rate During the Forecast Period
Figure 14 The Indoor Segment is Expected to Lead the Market During the Forecast Period
Figure 15 Market: Drivers, Restraints, Opportunities, & Challenges
Figure 16 Market (Value), By Application, 2016
Figure 17 Market (Value), By End-User, 2016
Figure 18 Regional Snapshot: the Chinese Market is Expected to Grow at the Highest Cagr During the Forecast Period
Figure 19 Market Share (Value), By Region, 2016
Figure 20 North America: Market Snapshot
Figure 21 Asia Pacific: Market Snapshot
Figure 22 Companies Adopted New Product Launches to Capture A Share of the Market, 2014�2017
Figure 23 Market Ranking, Market 2016
Figure 24 Battle for Market Share: New Product Launches Was the Key Strategy, 2014�2017
Figure 25 Market Evaluation Framework: New Product Launches, Mergers & Acquisitions, Partnerships, Contracts & Agreements, & Others FueltheFro201793
Figure 26 Environnement S.A: Company Snapshot
Figure 27 3M Company: Company Snapshot
Figure 28 Robert Bosch GmbH: Company Snapshot
Figure 29 Teledyne Technologies Incorporated: Company Snapshot
Figure 30 Horiba, Ltd.: Company Snapshot


Growth opportunities and latent adjacency in Air Quality Monitoring Software Market