Agricultural Chelates Market by Type (EDTA, EDDHA, DTPA, IDHA), Application (Soil, Seed Dressing, Foliar Sprays, Fertigation), Micronutrient Type (Iron, Manganese), Crop Type, End Use, and Region � Global Forecast to 2025


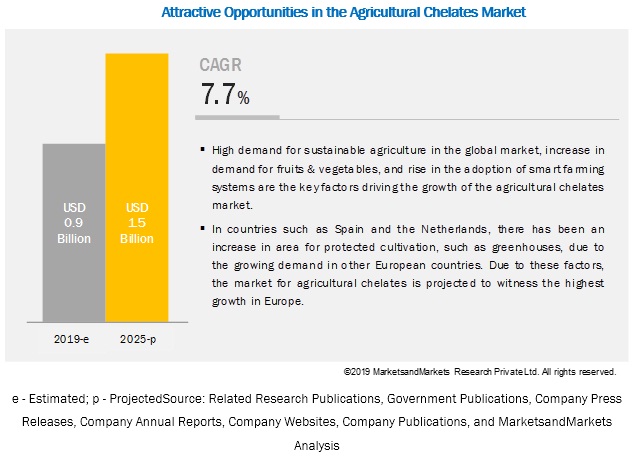
[182 Pages Report] The global agricultural chelates market size was estimated to account for a value of USD 0.9 billion in 2019 and is projected to grow at a CAGR of 7.7% from 2019, to reach a value of USD 1.5 billion by 2025. The growing demand for high-value crops and a decrease in the arable land are some of the factors driving the growth in the market.
By Type, EDTA agricultural chelates are projected to be the fastest-growing segment in the agricultural chelates market during the forecast period
There has been an increasing demand for food products due to the increase in population and a decrease in arable land. The growers are also using innovative inputs to increase crop yields, along with enhancing the quality to meet the needs of the growing population and the food processing industry. It is reported in many regions that EDTA chelating agent enables high absorption of micronutrients in the plant and offers strong binding ability when used with essential micronutrients, such as iron (Fe), zinc (Zn), copper (Cu), and manganese (Mn), resulting in enhanced crop growth. Thus, there is a high scope of growth for the market.
By crop type, the fruits & vegetables segment is projected to dominate the agricultural chelates market.
The fruits & vegetables segment is estimated to account for the largest share in the agricultural chelates market in 2019. The consumption of fruits and vegetables has witnessed an increasing trend and is projected to grow in the coming years. According to the Food and Agriculture Organization (FAO), China and India are among the largest producers of fruits and vegetables in 2018. The increase in export demand for fruits and vegetables from these countries and high return values have led to the expansion of the cultivation area for these crops. Hence, the agricultural chelates market for fruits & vegetables is projected to witness significant growth during the forecast period.
By application method, the foliar segment is projected to be the fastest-growing segment in the market during the forecast period.
Foliar spray is an agricultural technique, which includes the application of water and agricultural chelates through spray pumps, tractor mounted sprayers, drones, and airplanes. This process provides an opportunity to maximize the yield, minimize nutrient losses, and also reduce the environmental pollution. Moreover, for the application of agricultural chelates, farmers across the world highly prefer foliar spray method, as it ensures a uniform application of nutrients and reduces agricultural input costs. Thus, this application method is projected to witness significant growth due to its reliability and efficacy during the forecast period.
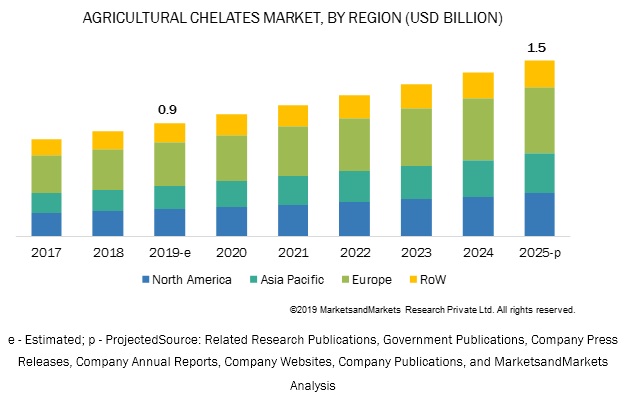
Increase in the application of agricultural chelates and the rising adoption of irrigation systems is projected to drive the global market during the forecast period.
Europe accounted for the largest share in the market in 2018. In countries such as Spain and the Netherlands, there has been an increase in area under protected cultivation, including greenhouses, due to the increasing demand from other European countries. Many ranges of crops, such as cereals, pulses, fruits, oilseeds, and cash crops, witness export demands in these countries. Soil type varies from region to region and the crop growth is highly dependent on that. Due to the deficiency of micronutrients reported in soils across Europe, the agricultural chelates market is projected to witness a high scope of growth.
Key Market Players
Some of the other players in the global market include BASF SE (Germany), Nouryon (Netherlands), The Dow Chemical Company (US), Yara International (Norway), ICL (Israel), Haifa Chemicals Ltd (Israel), Syngenta (US), Nufarm Ltd (Australia), Aries Agro Ltd (India), The Andersons, Inc. (US), ATP nutrition (Canada), Manvert (Spain), BMS-Micronutrients NV (Belgium), Wilbur-Ellis company (US), Compo Expert GMBH (Germany), Greensmiths, Inc. (US), Agmin Chelates Pty. Ltd (Australia), Van Iperen International (Netherlands), Valagro SpA (Italy), Shandong Iro Chelating Chemical Co., Ltd. (China), Protex International SA (France), and Deretil Agronutritional (Spain).
Scope of the Report
|
Report Metric |
Details |
|
Market size available for years |
2017�2025 |
|
Base year considered |
2018 |
|
Forecast period |
2019�2025 |
|
Forecast units |
Value (USD) |
|
Segments covered |
Type, Crop Type, End Use, Mode of Application, Micronutrient Type, and Region |
|
Geographies covered |
North America, Europe, Asia Pacific, and RoW |
|
Companies covered |
BASF SE (Germany), Nouryon (Netherlands), The Dow Chemical Company (US), Yara International (Norway), ICL (Israel), Haifa Chemicals Ltd (Israel), Syngenta (US), Nufarm Ltd (Australia), Aries Agro Ltd (India), The Andersons, Inc. (US), ATP nutrition (Canada), Manvert (Spain), BMS-Micronutrients NV (Belgium), Wilbur-Ellis company (US), Compo Expert GMBH (Germany), Greensmiths, Inc. (US), Agmin Chelates Pty. Ltd (Australia), Van Iperen International (Netherlands), Valagro SpA (Italy), Shandong Iro Chelating Chemical Co., Ltd. (China), Protex International SA (France), and Deretil Agronutritional (Spain). |
This research report categorizes the global market, on the basis of type, crop type, micronutrient, end use, mode of application, and region.
By Type:
- EDTA
- EDDHA
- DTPA
- IDHA
- Others (HEDP, HETDA, Organic acids, and NTA)
By Crop Type:
- Cereals and grains
- Oilseeds and pulses
- Fruits & vegetables
- Others (include turf & ornamental crops)
By End Use:
- Agriculture
- Indoor farming
By Mode of Application:
- Soil application
- Seed dressing
- Foliar sprays
- Fertigation
- Others (include trunk injection and implantation)
By Micronutrient Type:
- Iron
- Manganese
- Others (include zinc, copper, magnesium, and calcium)
By Region:
- North America
- Europe
- Asia Pacific
- Rest of World (RoW)*
*Rest of the World (RoW) includes South Africa, Brazil, Argentina, and others in RoW.
Recent Developments:
- In June 2019, BASF SE has strengthened its value chain for chelating agents in Ludwigshafen, Germany, by setting up a production plant to increase its market share in the European region.
- In January 2019, Nouryon entered into an agreement with Itaconix Corporation (UK) for the marketing and distribution of bio-based polymers, which consist of chelating properties.
- In July 2019, Vallagro S.P.A has collaborated its research with Marrone Bio Innovations (Davis, CA, US), resulting in the conjunction of microorganisms and plant nutritional products to increase crop productivity and quality.
- In April 2018, Nouryon (formerly known as AkzoNobel Specialty Chemicals) entered into a co-operation agreement with INEOS Nitriles, which allowed AkzoNobel to expand its production of biodegradable chelates that are used in detergents and other industries by utilizing one of the INEOS Nitriles� chemical products.
Key questions addressed by the report:
- Who are some of the key players operating in the agricultural chelates market, and how intense is the competition?
- What kind of competitors and stakeholders would be interested in this market? What will be their go-to-market strategy, and which emerging market will be of significant interest?
- How are the current R&D activities and acquisitions in the agricultural chelates market projected to create a disrupting environment in the coming years?
- What will be the level of impact of new product launches on the revenues of stakeholders, due to the benefits offered by the agricultural chelates market, such as increasing revenue, environmental regulatory compliance, and sustainable profits for suppliers?
- Which regions are projected to witness an increase in agricultural chelates consumption?
To speak to our analyst for a discussion on the above findings, click Speak to Analyst
 Exclusive indicates content/data unique to MarketsandMarkets and not available with any competitors.
Table of Contents
1 Introduction (Page No. - 19)
1.1 Objectives of the Study
1.2 Market Definition
1.3 Study Scope
1.3.1 Regional Segmentation
1.4 Periodization Considered
1.5 Currency Considered
1.6 Stakeholders
2 Research Methodology (Page No. - 23)
2.1 Research Data
2.1.1 Secondary Data
2.1.1.1 Key Data From Secondary Sources
2.1.2 Primary Data
2.1.2.1 Breakdown of Primaries
2.2 Market Size Estimation
2.2.1 Bottom-Up Approach
2.2.2 Top-Down Approach
2.3 Market Breakdown & Data Triangulation
2.4 Research Assumptions & Limitations
2.4.1 Assumptions
2.4.2 Limitations of the Study
3 Executive Summary (Page No. - 31)
4 Premium Insights (Page No. - 35)
4.1 Opportunities in the global Market
4.2 Agricultural Chelates Market, By Mode of Application
4.3 Europe: Agricultural Chelates Market, By Crop Type & Key Country
4.4 Agricultural Chelates Market, By Crop Type & Region
4.5 Agricultural Chelates Market, By Key Country
5 Market Overview (Page No. - 39)
5.1 Introduction
5.2 Macroeconomic Indicators
5.2.1 Population Growth and Diverse Food Demand
5.2.2 Rise in Demand for High-Value Cash Crops
5.2.3 Limited Availability of Arable Land
5.3 Market Dynamics
5.3.1 Drivers
5.3.1.1 Strong Demand for High-Value Crops
5.3.1.2 Reduce Soil Degradation Due to Excessive Crop Cultivation
5.3.1.3 Increase in Adoption of Precision-Farming Technology
5.3.1.4 Rapid Growth in Greenhouse Vegetable Production
5.3.2 Restraints
5.3.2.1 Growth of the Organic Fertilizers Industry
5.3.2.2 Bioaccumulation of Non-Biodegradable Chelates
5.3.3 Opportunities
5.3.3.1 Development of Biodegradable Chelates
5.3.3.2 Strong Growth in Fertilizer Consumption in Emerging Economies
5.3.4 Challenges
5.3.4.1 Lack of Awareness Among Farmers
5.4 Value Chain Analysis
5.5 Regulatory Framework
5.5.1 North America
5.5.1.1 US
5.5.1.1.1 Washington
5.5.2 Europe
5.5.3 Australia
5.5.4 China
5.5.5 South Africa
6 Agricultural Chelates Market, By Type (Page No. - 52)
6.1 Introduction
6.2 EDTA (Ethylenediamine Tetraacetic Acid)
6.2.1 EDTA is Used as the Key Agricultural Chelate Due to Its Strong Binding Ability
6.3 EDDHA [Ethylenediamine-N, N�-Bis (2-Hydroxyphenylacetic Acid)]
6.3.1 EDDHA is More Appropriate for Alkaline and Calcareous Soils
6.4 DTPA (Diethylenetriaminepentaacetic Acid Or Pentetic Acid)
6.4.1 DTPA Market is Expected to Increase in the Asia Pacific Region
6.5 IDHA [D, L-Aspartic Acid N- (1, 2-Dicarboxyethyl) Tetrasodium Salt]
6.5.1 IDHA is Gaining Importance Worldwide for Its Biodegradable Nature
6.6 Others
6.6.1 Organic Acids Result in Better Quality and Performance in Plant Growth
7 Agricultural Chelates Market, By Micronutrient (Page No. - 59)
7.1 Introduction
7.2 Iron
7.2.1 Formation of Chlorophyll is A Key Driver for the Adoption of Iron
7.3 Manganese
7.3.1 Enhancement in the Availability of Key Nutrients Such as Phosphorus and Calcium With the Use of Manganese
7.4 Others
7.4.1 Copper Chelates
7.4.1.1 Enhancement in the Flavor of Fruits & Vegetables is A Key Driver for the Adoption of Copper Chelates
7.4.2 Zinc Chelates
7.4.2.1 Zinc Chelates Support the Growth of Plant Growth Hormones and Enzyme Systems
7.4.3 Calcium Chelates
7.4.3.1 Enhanced Absorption and Activation of Plant Regulating Enzymes
7.4.4 Magnesium Chelates
7.4.4.1 Key Component for Chlorophyll During Photosynthesis
8 Agricultural Chelates Market, By End Use (Page No. - 65)
8.1 Introduction
8.2 Agriculture
8.2.1 Increase in Demand for Food and Export Would Drive the Adoption of Chelates
8.3 Indoor Farming
8.3.1 Iron Chelates are Widely Adopted in Indoor Farming
9 Agricultural Chelates Market, By Mode of Application (Page No. - 68)
9.1 Introduction
9.2 Soil Application
9.2.1 Lower Costs Involved in the Use of Soil Application Propelling the Growth of the Market
9.3 Seed Dressing
9.3.1 Low Supply of Micronutrients and the Consequently Limited Yield is Driving the Market for Seed-Dressed Chelates
9.4 Foliar Sprays
9.4.1 Foliar Spray is More Popular in Europe
9.5 Fertigation
9.5.1 Growth in Adoption of Precision Irrigation Systems to Drive the Market for Fertigation Application
9.6 Other Modes
9.6.1 Growth in Adoption of Precision Irrigation Systems to Drive the Market for Other Modes
10 Agricultural Chelates Market, By Crop Type (Page No. - 75)
10.1 Macro Indicators
10.1.1 Crop Cultivation Pattern
10.2 Connected Market: Npk (N+P2o5 + K2o) Fertilizers
10.3 Introduction
10.4 Cereals & Grains
10.4.1 Increase in Yield and Grain Nutritional Quality is A Key Factor Contributing to the Growth of the this Market
10.5 Oilseeds & Pulses
10.5.1 Rise in Demand From Feed Manufacturers is A Key Factor Encouraging the Application of Agricultural Chelates
10.6 Fruits & Vegetables
10.6.1 Fruits & Vegetables to Witness the Highest Consumption of Agricultural Chelates
10.7 Other Crop Types
10.7.1 Increase in Chlorosis in Turf and Ornamental Crops is A Major Factor Encouraging the Adoption of Agricultural Chelates
11 Agricultural Chelates, By Region (Page No. - 85)
11.1 Introduction
11.2 North America
11.2.1 US
11.2.1.1 The Increasing Trend of Using Micronutrients Has Contributed to the Growth of the Agricultural Chelates Market
11.2.2 Canada
11.2.2.1 The Deficiency of Micronutrients in the Soil Has Driven the Growth of this Market
11.2.3 Mexico
11.2.3.1 The Growth in Export of Agricultural Products is Driving the Chelates Market
11.3 Europe
11.3.1 Spain
11.3.1.1 With Spain Being the World�s Largest Producer of Wine, Grape Cultivation Has Increased Demand for Chelates
11.3.2 Netherlands
11.3.2.1 Demand for Worldwide Agricultural Exports Drives the Chelates Market in the Netherlands
11.3.3 Italy
11.3.3.1 High Demand for Cereals & Grains for Feed and Food to Drive the Market in Italy
11.3.4 France
11.3.4.1 Growth in Demand for Export of Food Products to Drive the Need for Chelates in France
11.3.5 UK
11.3.5.1 Food Production is Highly Influenced By Labor Inputs in the UK
11.3.6 Germany
11.3.6.1 Rise in Demand for Chelates Due to Decreasing Arable Land in the Country
11.3.7 Poland
11.3.7.1 The Need to Achieve Sustainability in Food Would Drive Growth in the Market
11.3.8 Rest of Europe
11.3.8.1 Private Investment Has Been Supporting the Development of Agriculture in This Region
11.4 Asia Pacific
11.4.1 China
11.4.1.1 Micronutrient Deficiency in Soils of China is A Major Factor Driving the Growth of the Chelates Market
11.4.2 India
11.4.2.1 High Awareness Pertaining to Micronutrients Among Farmers Has Led to High Usage of Chelates Across the Country
11.4.3 Japan
11.4.3.1 Advanced Agricultural Practices are Factors That are Projected to Drive the Growth of the Market
11.4.4 Australia
11.4.4.1 Investment in Advanced Nutrient Management Techniques Has Led to the Improvement in Crop Quality
11.4.5 Thailand
11.4.5.1 The Increased Awareness of Sustainable Agriculture Among Farmers Has Led to High Use of Advanced Technology
11.4.6 Rest of Asia Pacific
11.5 Rest of the World (RoW)
11.5.1 South Africa
11.5.1.1 High Growth in Consumption of Specialty Fertilizers Including Chelated Micronutrients
11.5.2 Argentina
11.5.2.1 Growth in the Market With the Increasing Awareness About Micronutrient Deficiency
11.5.3 Brazil
11.5.3.1 Demand for Export of Agricultural Products is the Driver for Agricultural Chelates Market
11.5.4 Others in Row
11.5.4.1 Potential Benefits of Agricultural Chelates are Slowly Being Recognized
12 Competitive Landscape (Page No. - 135)
12.1 Overview
12.2 Competitive Leadership Mapping
12.2.1 Visionary Leaders
12.2.2 Innovators
12.2.3 Dynamic Differentiators
12.2.4 Emerging Companies
12.3 Ranking of Key Players, 2019
12.4 Competitive Scenario
12.4.1 Expansions & Investments
13 Company Profiles (Page No. - 140)
(Business Overview, Products Offered, Recent Developments, SWOT Analysis, MnM View)*
13.1 BASF SE
13.2 Yara International Asa
13.3 ICL
13.4 Syngenta
13.5 Nufarm Ltd
13.6 Aries Agro Ltd
13.7 The Andersons, Inc.
13.8 The Dow Chemical Company
13.9 Haifa Chemicals
13.10 ATP Nutrition
13.11 Manvert
13.12 Nouryon
13.13 BMS Micro-Nutrients Nv
13.14 Wilbur-Ellis Company
13.15 Compo Expert GmbH
13.16 Greensmiths, Inc.
13.17 Agmin Chelates Pty. Ltd
13.18 VAN Iperen International
13.19 Valagro Spa
13.20 Shandong Iro Chelating Chemical Co., Ltd.
13.21 Protex International Sa
13.22 Deretil Agronutritional
*Details on Business Overview, Products Offered, Recent Developments, SWOT Analysis, MnM View Might Not Be Captured in Case of Unlisted Companies.
14 Appendix (Page No. - 175)
14.1 Discussion Guide
14.2 Knowledge Store: Marketsandmarkets� Subscription Portal
14.3 Available Customizations
14.4 Related Reports
14.5 Author Details
List of Tables (105 Tables)
Table 1 USD Exchange Rate, 2014�2018
Table 2 Relative Crop Responsiveness to Agricultural Chelates
Table 3 Nutrient Content Requirement
Table 4 Agricultural Chelates Market Size, By Type, 2017�2025 (USD Million)
Table 5 Agricultural EDTA Market Size, By Region, 2017�2025 (USD Million)
Table 6 Agricultural EDDHA Market Size, By Region, 2017�2025 (USD Million)
Table 7 Agricultural DTPA Market Size, By Region, 2017�2025 (USD Million)
Table 8 Agricultural IDHA Market Size, By Region, 2017�2025 (USD Million)
Table 9 Other Agricultural Chelates Market Size, By Region, 2017�2025 (USD Million)
Table 10 Agricultural Chelates Market Size, By Micronutrient, 2017�2025 (USD Million)
Table 11 Market Size, By End Use, 2017�2025 (USD Million)
Table 12 Market Size, By Mode of Application, 2017�2025 (USD Million)
Table 13 Soil Application Market Size, By Region, 2017�2025 (USD Million)
Table 14 Seed Dressing Market Size, By Region, 2017�2025 (USD Million)
Table 15 Foliar Sprays Market Size, By Region, 2017�2025 (USD Million)
Table 16 Fertigation Market Size, By Region, 2017�2025 (USD Million)
Table 17 Other Modes Market Size, By Region, 2017�2025 (USD Million)
Table 18 Agricultural Chelates Market Size, By Crop Type, 2017�2025 (USD Million)
Table 19 Agricultural Chelates Market Size in Cereal & Grain Cultivation, By Region, 2017�2025 (USD Million)
Table 20 Market Size in Oilseed & Pulse Cultivation, By Region, 2017�2025 (USD Million)
Table 21 Market Size in Fruit & Vegetable Cultivation, By Region, 2017�2025 (USD Million)
Table 22 Market Size in Other Crop Cultivation, By Region, 2017�2025 (USD Million)
Table 23 Agricultural Chelates Market Size, By Region, 2017�2025 (USD Million)
Table 24 Agricultural Micronutrients Market Size, By Region, 2015�2022 (USD Million)
Table 25 Agricultural Micronutrients Market Size, By Region, 2015�2022 (Kt)
Table 26 Specialty Fertilizers Market Size, By Region, 2017�2025 (USD Million)
Table 27 Liquid Fertilizers Market Size, By Region, 2017�2025 (USD Million)
Table 28 North America: Agricultural Chelates Market Size, By Country, 2017�2025 (USD Million)
Table 29 North America: Market Size, By Type, 2017�2025 (USD Million)
Table 30 North America: Market Size, By Crop Type, 2017�2025 (USD Million)
Table 31 North America: Market Size, By Application, 2017�2025 (USD Million)
Table 32 North America: Agricultural Micronutrients Market Size, By Country, 2015�2022 (USD Million)
Table 33 North America: Specialty Fertilizers Market Size, By Country, 2017�2025 (USD Million)
Table 34 North America: Liquid Fertilizers Market Size, By Country, 2017�2025 (USD Million)
Table 35 US: Agricultural Chelates Market Size, By Crop Type, 2017�2025 (USD Million)
Table 36 US: Market Size, By Type, 2017�2025 (USD Million)
Table 37 Canada: Agricultural Chelates Market Size, By Type, 2017�2025 (USD Million)
Table 38 Canada: Market Size, By Crop Type, 2017�2025 (USD Million)
Table 39 Mexico: Agricultural Chelates Market Size, By Type, 2017�2025 (USD Million)
Table 40 Mexico: Market Size, By Crop Type, 2017�2025 (USD Million)
Table 41 Europe: Agricultural Chelates Market Size, By Country, 2017�2025 (USD Million)
Table 42 Europe: Market Size, By Crop Type, 2017�2025 (USD Million)
Table 43 Europe: Agricultural Chelates Size, By Type, 2017�2025 (USD Million)
Table 44 Europe: Agricultural Chelates Size, By Mode of Application, 2017�2025 (USD Million)
Table 45 Europe: Agricultural Micronutrients Market Size, By Country, 2015�2022 (USD Million)
Table 46 Europe: Agricultural Micronutrients Market Size, By Country, 2015�2022 (Kt)
Table 47 Europe: Specialty Fertilizers Market Size, By Country, 2017�2025 (USD Million)
Table 48 Europe: Liquid Fertilizers Market Size, By Country, 2017�2025 (USD Million)
Table 49 Spain: Agricultural Chelates Market Size, By Crop Type, 2017�2025 (USD Million)
Table 50 Spain: Market Size, By Type, 2017�2025 (USD Million)
Table 51 Netherlands: Agricultural Chelates Market Size, By Crop Type, 2017�2025 (USD Million)
Table 52 Netherlands: Market Size, By Type, 2017�2025 (USD Million)
Table 53 Italy: Agricultural Chelates Market Size, By Crop Type, 2017�2025 (USD Million)
Table 54 Italy: Market Size, By Type, 2017�2025 (USD Million)
Table 55 France: Agricultural Chelates Market Size, By Crop Type, 2017�2025 (USD Million)
Table 56 France: Market Size, By Type, 2017�2025 (USD Million)
Table 57 UK: Agricultural Chelates Market Size, By Crop Type, 2017�2025 (USD Million)
Table 58 UK: Market Size, By Type, 2017�2025 (USD Million)
Table 59 Germany: Agricultural Chelates Market Size, By Crop Type, 2017�2025 (USD Million)
Table 60 Germany: Market Size, By Type,2017�2025 (USD Million)
Table 61 Poland: Agricultural Chelates Market Size, By Crop Type, 2017�2025 (USD Million)
Table 62 Poland: Market Size, By Type, 2017�2025 (USD Million)
Table 63 Rest of Europe: Agricultural Chelates Market Size, By Crop Type, 2017�2025 (USD Million)
Table 64 Rest of Europe: Market Size, By Type, 2017�2025 (USD Million)
Table 65 Asia Pacific: Agricultural Chelates Market Size, By Country, 2017�2025 (USD Million)
Table 66 Asia Pacific: Market Size, By Crop Type, 2017�2025 (USD Million)
Table 67 Asia Pacific: Market Size, By Type, 2017�2025 (USD Million)
Table 68 Asia Pacific: Market Size, By Application, 2017�2025 (USD Million)
Table 69 Asia Pacific: Agricultural Micronutrients Market Size, By Country, 2015�2022 (USD Million)
Table 70 Asia Pacific: Agricultural Micronutrients Market Size, By Country, 2015�2022 (Kt)
Table 71 Asia Pacific: Specialty Fertilizers Market Size, By Country, 2017�2025 (USD Million)
Table 72 Asia Pacific: Liquid Fertilizers Market Size, By Country, 2017�2025 (USD Million)
Table 73 China: Agricultural Chelates Market Size, By Crop Type, 2017�2025 (USD Million)
Table 74 China: Market Size, By Type, 2017�2025 (USD Million)
Table 75 India: Agricultural Chelates Market Size, By Crop Type, 2017�2025 (USD Million)
Table 76 India: Market Size, By Type, 2017�2025 (USD Million)
Table 77 Japan: Agricultural Chelates Market Size, By Crop Type, 2017�2025 (USD Million)
Table 78 Japan: Market Size, By Type, 2017�2025 (USD Million)
Table 79 Australia: Agricultural Chelates Market Size, By Crop Type, 2017�2025 (USD Million)
Table 80 Australia: Market Size, By Type, 2017�2025 (USD Million)
Table 81 Thailand: Agricultural Chelates Market Size, By Crop Type, 2017�2025 (USD Million)
Table 82 Thailand: Market Size, By Type, 2017�2025 (USD Million)
Table 83 Rest of Asia Pacific: Agricultural Chelates Market Size, By Crop Type, 2017�2025 (USD Million)
Table 84 Rest of Asia Pacific: Market Size, By Type, 2017�2025 (USD Million)
Table 85 RoW: Agricultural Chelates Market Size, By Country, 2017�2025 (USD Million)
Table 86 RoW: Market Size, By Type, 2017�2025 (USD Million)
Table 87 RoW: Market Size, By Crop Type, 2017�2025 (USD Million)
Table 88 RoW: Market Size, By Application, 2017�2025 (USD Million)
Table 89 South America: Specialty Fertilizers Market Size, By Country,2017�2025 (USD Million)
Table 90 South America: Liquid Fertilizers Market Size, By Country, 2017�2025 (USD Million)
Table 91 RoW: Specialty Fertilizers Market Size, By Country, 2017�2025 (USD Million)
Table 92 RoW: Liquid Fertilizers Market Size, By Country, 2017�2025 (USD Million)
Table 93 South America: Agricultural Micronutrients Market Size, By Country, 2015�2022 (USD Million)
Table 94 South America: Agricultural Micronutrients Market Size, By Country, 2015�2022 (Kt)
Table 95 RoW: Agricultural Micronutrients Market Size, By Region, 2015�2022 (USD Million)
Table 96 RoW: Agricultural Micronutrients Market Size, By Region, 2015�2022 (Kt)
Table 97 South Africa: Agricultural Chelates Market Size, By Type, 2017�2025 (USD Million)
Table 98 South Africa: Market Size, By Crop Type, 2017�2026 (USD Million)
Table 99 Argentina: Agricultural Chelates Market Size, By Type, 2017�2025 (USD Million)
Table 100 Argentina: Market Size, By Crop Type, 2017�2025 (USD Million)
Table 101 Brazil: Agricultural Chelates Market Size, By Type, 2017�2025 (USD Million)
Table 102 Brazil: Market Size, By Crop Type, 2017�2025 (USD Million)
Table 103 Others in RoW: Agricultural Chelates Market Size, By Type, 2017�2025 (USD Million)
Table 104 Others in RoW: Market Size, By Crop Type, 2017�2025 (USD Million)
Table 105 Expansions & Investments, 2015�2018
List of Figures (46 Figures)
Figure 1 Market Segmentation
Figure 2 Research Design
Figure 3 Market Size Estimation Methodology: Bottom-Up Approach
Figure 4 Market Size Estimation Methodology: Top-Down Approach
Figure 5 Data Triangulation Methodology
Figure 6 Agricultural Chelates Market Size, By Type, 2019 vs. 2025 (USD Million)
Figure 7 The Fruits & Vegetables Segment is Projected to Be the Fastest-Growing Crop Type From 2019 to 2025
Figure 8 The Foliar Sprays Segment, By Mode of Application, is Estimated to Dominate the Global Market in 2019
Figure 9 Europe Accounted for the Largest Market Share in 2018
Figure 10 Increase in Need for Food Supports the Growth of the Market
Figure 11 Foliar Sprays Was the Most Preferred Application Method for Agricultural Chelates in 2018
Figure 12 Europe: Spain Was A Major Consumers in 2018
Figure 13 Europe Witnessed the Highest Market Share for Agricultural Chelates Across Fruits & Vegetables in 2018
Figure 14 Asia Pacific Countries are Projected to Witness the Highest Growth During the Forecast Period
Figure 15 Population Growth Trend, 1950�2050 (Million)
Figure 16 Global Area Harvested Under Important High-Value Crops, 2014�2017 (Million Ha)
Figure 17 Annual Availability of Arable Land, 1950�2020 (Hectares/Person)
Figure 18 Growing Number of Sustainable Solutions and Initiatives, Such as Integrated Nutrient Management, Expected to Drive the Market
Figure 19 Area Harvested Under Fruit & Vegetable Crops, 2013�2017 (Million Ha)
Figure 20 Agricultural Chelates: Value Chain Analysis
Figure 21 Agricultural Chelates: Supply Chain Analysis
Figure 22 Agricultural Chelates Market, By Type, 2019 vs. 2025 (USD Million)
Figure 23 Market, By Micronutrient, 2019 vs. 2025 (USD Million)
Figure 24 Market, By End Use, 2019 vs. 2025 (USD Million)
Figure 25 Market, By Mode of Application, 2019 vs. 2025 (USD Million)
Figure 26 Corn & Soybean Crop Cultivation Area, 2013�2017 (Million Ha)
Figure 27 Global Nutrients (N+P2o5+K2o) Consumption, 2009�2019
Figure 28 Fruits & Vegetables Segment to Dominate the Agricultural Chelates Market During the Forecast Period
Figure 29 Spain Held the Largest Market Share in the Agricultural Chelates Market During the Forecast Period
Figure 30 Europe: Regional Snapshot
Figure 31 Asia Pacific: Regional Snapshot
Figure 32 Agricultural Chelates (Global): Competitive Leadership Mapping, 2019
Figure 33 Key Developments of the Leading Players in the Agricultural Chelates Market, 2015�2019
Figure 34 Nouryon to Dominate the Agricultural Chelates Market, 2019
Figure 35 BASF SE: Company Snapshot
Figure 36 BASF SE: SWOT Analysis
Figure 37 Yara International Asa: Company Snapshot
Figure 38 ICL: Company Snapshot
Figure 39 ICL: SWOT Analysis
Figure 41 Nufarm Ltd: Company Snapshot
Figure 42 Nufarm Ltd: SWOT Analysis
Figure 43 Aries Agro Ltd: Company Snapshot
Figure 44 Aries Agro Ltd: SWOT Analysis
Figure 45 The Andersons, Inc.: Company Snapshot
Figure 46 The Andersons, Inc.: SWOT Analysis
The study involves four major activities to estimate the current size of the agricultural chelates market. Exhaustive secondary research was done to collect information on the market, peer market, and parent market. These findings, assumptions, and market sizes were validated with industry experts across the value chain through primary research. Both the top-down and bottom-up approaches were employed to estimate the complete market size. After that, the market breakdown and data triangulation approaches were used to estimate the sizes of the segments and subsegments.
Secondary Research
In the secondary research process, various secondary sources, such as Hoovers, Bloomberg BusinessWeek, and Dun & Bradstreet, were referred to, so as to identify and collect information for this study. These secondary sources included annual reports, press releases & investor presentations of companies, white papers, certified publications, articles by recognized authors, food safety organizations, regulatory bodies, trade directories, and databases.
Primary Research
The agricultural chelates market comprises several stakeholders, such as agricultural institutes, crop growers, chelates manufacturers, suppliers, intermediary suppliers, wholesalers, traders, research institutes and organizations, and regulatory bodies.
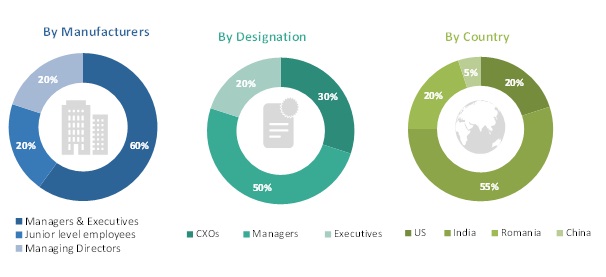
The demand side comprises an increased demand for high-value crops, rise in population, and advancements in farming practices and technology. Various primary sources from both the supply and demand sides of the agricultural chelates market were interviewed to obtain qualitative and quantitative information. Following is the breakdown of primary respondents:
To know about the assumptions considered for the study, download the pdf brochure
Market Size Estimation
Both the top-down and bottom-up approaches were used to estimate and validate the total size of the agricultural chelates market. These methods were also used extensively to estimate the size of various subsegments in the market. The research methodology used to estimate the market size includes the following:
- The key players were identified through extensive secondary research.
- The industry�s supply chain and market size were determined through primary and secondary research.
- All percentage shares, splits, and breakdowns were determined using secondary sources and verified through primary sources.
- All the possible parameters that affect the markets covered in this research study were accounted for, viewed in extensive detail, verified through primary research, and analyzed to obtain the final quantitative and qualitative data.
- The parent market, i.e., the global micronutrients market, was used to validate the details of the agricultural chelates market further.
Data Triangulation
After arriving at the overall market size-using the market size estimation processes as explained above-the market was split into several segments and subsegments. To complete the overall market engineering process and arrive at the exact statistics of each market segment and subsegment, the data triangulation and market breakdown procedures were employed. The data was triangulated by studying various factors and trends from both the demand and supply sides in the agricultural chelates market.
Report Objectives
- To define, segment, and estimate the size of the agricultural chelates market with respect to its type, mode of application, crop type, end use, micronutrient type, and region
- To provide detailed information about the major factors influencing the growth of the market (drivers, restraints, opportunities, and industry-specific challenges)
- To analyze the complete supply chain and influence of all key stakeholders, such as manufacturers, suppliers, and end-users
- To analyze the opportunities in the market for stakeholders and provide details of the competitive landscape for market leaders
- To profile the key players and comprehensively analyze their core competencies
- To analyze the competitive developments, such as new product launches, acquisitions, investments, expansions, partnerships, agreements, joint ventures, and product approvals, in the agricultural chelates market
Available Customizations
With the given market data, MarketsandMarkets offers customizations according to the company�s specific scientific needs.
The following customization options are available for the report:
Product Analysis
- Product matrix, which gives a detailed comparison of the product portfolio of each company
Geographic Analysis
- Further breakdown of the Rest of European agricultural chelates market into Turkey, Romania, and Scandinavian countries.
- Further breakdown of the Rest of Asia Pacific market for agricultural chelates into Vietnam and South Korea.
- Further breakdown of other countries in the RoW market for agricultural chelates into Africa and Middle East Countries.
Company Information
- Detailed analyses and profiling of additional market players (up to five)


Growth opportunities and latent adjacency in Agricultural Chelates Market