Propulsion Systems Market by type (Air Breathing Engines, Non-Air Breathing Engines, Electric Propulsion Engines), Application (Aircraft, Spacecraft, Missiles, Unmanned Aerial Vehicles), and Region - Global Forecast to 2021


The propulsion systems market is projected to grow from USD 244.68 Billion in 2016 to USD 337.78 Billion by 2021, at a CAGR of 6.66% during the forecast period, 2016 to 2021. The objective of this study is to analyze, define, describe, and forecast the propulsion systems market based on type, application, and region. The report also focuses on the competitive landscape of this market by profiling companies on the basis of their financial positions, product portfolios, growth strategies, core competencies, and market shares to anticipate degree of competition prevailing in the market. This report also tracks and analyzes growth strategies, such as partnerships, mergers & acquisitions (M&A), new product developments, and research & development (R&D) activities undertaken by the key players in the market. In this report on propulsion systems market, 2015 has been considered as the base year and forecast period taken into account is between 2016 and 2021.
The propulsion systems market is projected to grow from USD 244.68 Billion in 2016 to USD 337.78 Billion by 2021, at a CAGR of 6.66% between 2016 and 2021. Increase in the number of space expeditions, high efficiency offered by propulsion systems, technological advancements taking place in propulsion systems, and growing need for long-range missiles are some of the drivers, which are expected to propel the growth of the market across the globe. China, India, Brazil, Russia, and Turkey are the key countries that are expected to witness increased demand for propulsion systems during the forecast period.
Based on type, the market has been segmented into air-breathing engines, non-air breathing engines, and electric propulsion engines. The air-breathing engines segment is expected to lead the propulsion systems market in 2016. The growth of the air-breathing segment of the market can be attributed to increased use of air-breathing engines in aircraft and missiles to achieve high speed, less fuel consumption, and accuracy.
Based on application, the aircraft segment is projected to lead the propulsion systems market during the forecast period due to increasing air travel and growing need for global connectivity. Ever-increasing need for lightweight aircraft engines that offer high fuel efficiency and durability to withstand severe climatic conditions, provide optimum thrust output, and require less maintenance schedules with short turnaround time is expected to fuel the growth of the aircraft segment of the market. The unmanned aerial vehicles segment of the propulsion systems market is projected to grow at the highest CAGR during the forecast period due to increase in surveillance & security and search & rescue operations.
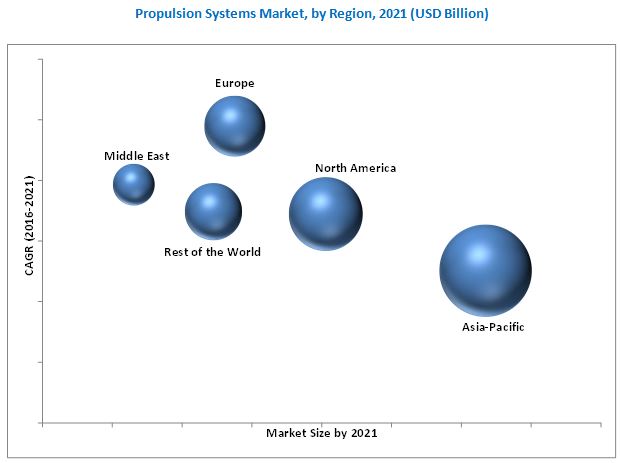
The North American region is estimated to account for the largest share of the propulsion systems market in 2016. Economic growth, expansion of the commercial & military aviation, and increase in the number of space expeditions are factors driving the growth of the North America propulsion systems market. Moreover, growth of the North America propulsion systems market can mainly be attributed to the rising number of military modernization programs, which emphasize on increased procurement of manned and unmanned aircraft, helicopters, and ground vehicles. The Asia-Pacific propulsion systems market is expected to grow at the highest CAGR during the forecast period, owing to increase in defense expenditures of India and China. Moreover, expansion of military command in the emerging nations has further accelerated demand for military transport aircraft, which, in turn, has fueled the demand of propulsion systems in the Asia-Pacific region.
The U.S. government has drastically reduced its defense spending, owing to economic slowdown being faced by the country. According to the U.S. Department of Defense, the country solely accounted for approximately USD 650 billion of the total defense spending in 2015. The European Union, which is also recovering from economic crisis, is mulling over trimming its defense budget. In addition, the life cycle of a propulsion system varies from 35-45 years, after which it needs to be upgraded. Key players usually prefer replacement of propulsion systems over their upgradation. As such, the market for propulsion systems remains stagnant for a long period of time, thereby restraining the growth of the propulsion systems market.
The propulsion systems market is a diversified and competitive market with a large number of players operating in it. Key players in the market are General Electric Company (U.S.), Safran S.A. (France), United Technologies Corporation (U.S.), Rolls-Royce Holdings plc. (U.K.), Honeywell International Inc. (U.S.), 3W International GmbH (Germany), Orbital ATK Inc. (U.S.), and Aerojet Rocketdyne Holdings, Inc. (U.S.), among others.
To speak to our analyst for a discussion on the above findings, click Speak to Analyst
 Exclusive indicates content/data unique to MarketsandMarkets and not available with any competitors.
Table of Contents
1 Introduction (Page No. - 17)
1.1 Objectives of the Study
1.2 Market Definition
1.3 Study Scope
1.3.1 Markets Covered
1.3.2 Years Considered for the Study
1.4 Currency & Pricing
1.5 Distribution Channel Participants
1.6 Limitations
1.7 Market Stakeholders
2 Research Methodology (Page No. - 21)
2.1 Research Data
2.1.1 Secondary Data
2.1.1.1 Key Data From Secondary Sources
2.1.2 Primary Data
2.1.2.1 Key Data From Secondary Sources
2.1.2.2 Breakdown of Primaries
2.1.2.3 Key Industry Insights
2.2 Factor Analysis
2.2.1 Introduction
2.2.2 Demand Side Indicators
2.2.2.1 Increase in Defense Spending and Rise in the Number of Military Modernization Programs
2.2.2.2 Rising Demand for Unmanned Systems
2.2.3 Supply Side Indicators
2.2.3.1 Increase in Research & Development Activities
2.3 Market Size Estimation
2.3.1 Bottom-Up Approach
2.3.2 Top-Down Approach
2.4 Market Breakdown and Data Triangulation
2.5 Assumptions
3 Executive Summary (Page No. - 33)
4 Premium Insights (Page No. - 37)
4.1 Attractive Market Oppportunities in the Market
4.2 Propulsion Systems Market, By Application
4.3 Market in Missiles Application, By Region
4.4 Non-Air Breathing Propulsion Systems Market, By Subtype
4.5 Market Share vs Growth Rate, By Region
4.6 Life Cycle Analysis, By Region
5 Market Overview (Page No. - 41)
5.1 Introduction
5.2 Market Segmentation
5.2.1 Propulsion Systems Market, By Type
5.2.2 Market, By Application
5.3 Market Dynamics
5.3.1 Drivers
5.3.1.1 Increasing Commercial Application of Propulsion Systems
5.3.1.2 High Efficiency Offered By Propulsion Systems and Technological Advancements
5.3.1.3 Increasing Space Expeditions
5.3.1.4 Increasing Need for Long Range Missiles
5.3.2 Restraints
5.3.2.1 Declining Defense Budgets of Advanced Economies
5.3.2.2 Strict Airspace Regulations
5.3.3 Opportunities
5.3.3.1 Increasing Research & Development Activities
5.3.3.2 Increasing Defense Expenditures of Emerging Economies
5.3.4 Challenges
5.3.4.1 High Costs Involved in the Development of New Technologies
5.3.4.2 Lack of Knowledge Transfer Platforms
6 Industry Trends (Page No. - 50)
6.1 Introduction
6.2 Supply Chain
6.3 Value Chain
6.4 Technological Trends
6.4.1 Increasing Use of Gas Turbines & Jet Propulsions
6.4.1.1 Innovations and Patent Registrations of Gas Turbines
6.4.2 Innovations in Ramjet & Scramjet Propulsions
6.4.2.1 Innovations and Patent Registrations of Ramjet Engines
6.4.3 Innovations in Non-Air Breathing Propulsions
6.4.3.1 Innovations in Propulsions for Rockets and Missiles
6.4.3.2 Innovations and Patent Registrations for Rockets and Missiles
6.4.3.3 Innovations in Space Propulsion
6.4.3.4 Innovations and Patent Registrations in Space Propulsions
6.4.4 Innovations in Electric Propulsions
6.4.4.1 Innovations in Electric Propulsions for Uavs
6.4.4.2 Innovations and Patent Registrations in Electric Propulsions for Uavs
6.4.4.3 Innovations in Electric Propulsions for Spacecraft:
6.4.4.4 Innovations and Patent Registrations in Electric Propulsions for Spacecraft:
7 Propulsion Systems Market, By Type (Page No. - 58)
7.1 Introduction
7.2 Air-Breathing Engines
7.2.1 Ramjet & Scramjet
7.2.2 Gas Turbine & Jet Engine
7.2.3 Internal Combustion
7.3 Non-Air Breathing Engines
7.3.1 Solid Propulsion
7.3.2 Liquid Propulsion
7.3.3 Hybrid
7.4 Electric Propulsion Engines
8 Propulsion Systems Market, By Application (Page No. - 67)
8.1 Introduction
8.2 Aircraft
8.3 Spacecraft
8.4 Missiles
8.5 Unmanned Aerial Vehicles
9 Regional Analysis (Page No. - 76)
9.1 Introduction
9.2 North America
9.2.1 By Type
9.2.2 By Application
9.2.3 By Country
9.2.3.1 U.S.
9.2.3.1.1 By Type
9.2.3.1.2 By Application
9.2.3.2 Canada
9.2.3.2.1 By Type
9.2.3.2.2 By Application
9.3 Europe
9.3.1 By Type
9.3.2 By Application
9.3.3 By Country
9.3.3.1 U.K.
9.3.3.1.1 By Type
9.3.3.1.2 By Application
9.3.3.2 Russia
9.3.3.2.1 By Type
9.3.3.2.2 By Application
9.3.3.3 France
9.3.3.3.1 By Type
9.3.3.3.2 By Application
9.3.3.4 Germany
9.3.3.4.1 By Type
9.3.3.4.2 By Application
9.3.3.5 Rest of Europe
9.3.3.5.1 By Type
9.3.3.5.2 By Application
9.4 Asia-Pacific
9.4.1 By Type
9.4.2 By Application
9.4.3 By Country
9.4.3.1 China
9.4.3.1.1 By Type
9.4.3.1.2 By Application
9.4.3.2 India
9.4.3.2.1 By Type
9.4.3.2.2 By Application
9.4.3.3 South Korea
9.4.3.3.1 By Type
9.4.3.3.2 By Application
9.4.3.4 Japan
9.4.3.4.1 By Type
9.4.3.4.2 By Application
9.4.3.5 Rest of Asia-Pacific
9.4.3.5.1 By Type
9.4.3.5.2 By Application
9.5 Middle East
9.5.1 By Type
9.5.2 By Application
9.5.3 By Country
9.5.3.1 Israel
9.5.3.1.1 By Type
9.5.3.1.2 By Application
9.5.3.2 Turkey
9.5.3.2.1 By Type
9.5.3.2.2 By Application
9.5.3.3 Rest of Middle East
9.5.3.3.1 By Type
9.5.3.4 By Application
9.6 Rest of the World
9.6.1 By Type
9.6.2 By Application
9.6.3 By Country
9.6.3.1 Brazil
9.6.3.1.1 By Type
9.6.3.1.2 By Application
9.6.3.2 South Africa
9.6.3.2.1 By Type
9.6.3.2.2 By Application
10 Competitive Landscape (Page No. - 113)
10.1 Overview
10.2 Market Share Analysis, By Key Players
10.3 Brand Analysis
10.4 Competitive Situations & Trends
10.4.1 Contracts
10.4.2 New Product Launches
10.4.3 Acquisitions & Joint Venture
10.4.4 Agreements & Partnerships
11 Company Profile (Page No. - 128)
(Overview, Products and Services, Financials, Strategy & Development)*
11.1 Introduction
11.2 Financial Highlights
11.3 General Electric Co.
11.4 United Technologies Corporation
11.5 Rolls-Royce Holdings PLC.
11.6 Safran S.A
11.7 Honeywell International Inc.
11.8 Northrop Grumman Corporation
11.9 The Raytheon Company
11.10 Aerojet Rocketdyne Holdings, Inc.
11.11 Orbital ATK
11.12 Lockheed Martin Corporation
11.13 GKN Aerospace
11.14 3W International GmbH
*Details on Overview, Products and Services, Financials, Strategy & Development Might Not Be Captured in Case of Unlisted Companies.
12 Appendix (Page No. - 169)
12.1 Discussion Guide
12.2 Knowledge Store: Marketsandmarkets’ Subscription Portal
12.3 Introducing RT: Real Time Market Intelligence
12.4 Available Customizations
12.5 Related Reports
List of Tables (77 Tables)
Table 1 Propulsion Systems Market, By Type
Table 2 Market, By Application
Table 3 Market, By Region
Table 4 Military Expenditure of Advanced Economies, 2011-2015 (USD Billion)
Table 5 Military Expenditures of Emerging Economies, 2011-2015 (USD Billion)
Table 6 Channels for Knowledge Transfer
Table 7 Process of Knowledge Transfer
Table 8 Tools to Measure Effective Knowledge Transfer
Table 9 Innovations and Patent Registrations
Table 10 Propulsion Systems Market Size, By Type, 2015-2021 (USD Billion)
Table 11 Air-Breathing: Propulsion Systems Market Size, By Subtype, 2015-2021 (USD Billion)
Table 12 Air-Breathing: Market Size, By Region, 2015-2021 (USD Billion)
Table 13 Non-Air Breathing: Market Size, By Subtype, 2015-2021 (USD Billion)
Table 14 Non-Air Breathing: Market Size, By Region, 2015-2021 (USD Billion)
Table 15 Electric Propulison: Market Size, By Region, 2015-2021 (USD Billion)
Table 16 Propulsion Systems Market Size, By Application, 2015-2021 (USD Billion)
Table 17 Aircraft: Market Size, By Type, 2015-2021 (USD Billion)
Table 18 Aircraft: Market Size, By Region, 2015-2021 (USD Billion)
Table 19 Spacecraft: Market Size, By Type, 2015-2021 (USD Billion)
Table 20 Spacecraft: Market Size, By Region, 2015-2021 (USD Billion)
Table 21 Missiles: Market Size, By Type, 2015-2021 (USD Billion)
Table 22 Missiles: Market Size, By Region, 2015-2021 (USD Billion)
Table 23 Unmanned Aerial Vehicles: Propulsion Systems Market Size, By Region, 2015-2021 (USD Billion)
Table 24 Market Size, By Region, 2015-2021 (USD Billion)
Table 25 North America: Market Size, By Type, 2015-2021 (USD Billion)
Table 26 North America: Propulsion Systems Market Size, By Application, 2015-2021 (USD Billion)
Table 27 North America: Market Size, By Country, 2015-2021 (USD Billion)
Table 28 U.S.: Propulsion Systems Market Size, By Type, 2015-2021 (USD Billion)
Table 29 U.S.: Market Size, By Application, 2015-2021 (USD Billion)
Table 30 Canada: Propulsion Systems Market Size, By Type, 2015-2021 (USD Billion)
Table 31 Canada: Market Size, By Application, 2015-2021 (USD Billion)
Table 32 Europe: Propulsion Systems Market Size, By Type, 2015-2021 (USD Billion)
Table 33 Europe: Market Size, By Application, 2015-2021 (USD Billion)
Table 34 Europe: Market Size, By Country, 2015-2021 (USD Billion)
Table 35 U.K.: Market Size, By Type, 2015-2021 (USD Billion)
Table 36 U.K.: Market Size, By Application, 2015-2021 (USD Billion)
Table 37 Russia: Propulsion Systems Market Size, By Type, 2015-2021 (USD Billion)
Table 38 Russia: Market Size, By Application, 2015-2021 (USD Billion)
Table 39 France: Market Size, By Type, 2015-2021 (USD Billion)
Table 40 France: Propulsion Systems Market Size, By Application, 2015-2021 (USD Billion)
Table 41 Germany: Market Size, By Type, 2015-2021 (USD Billion)
Table 42 Germany: Market Size, By Application, 2015-2021 (USD Billion)
Table 43 Rest of Europe: Market Size, By Type, 2015-2021 (USD Billion)
Table 44 Rest of Europe: Market Size, By Application, 2015-2021 (USD Billion)
Table 45 Asia-Pacific: Market Size, By Type, 2015-2021 (USD Billion)
Table 46 Asia-Pacific: Market Size, By Application, 2015-2021 (USD Billion)
Table 47 Asia-Pacific: Market Size, By Country, 2015-2021 (USD Billion)
Table 48 China: Market Size, By Type, 2015-2021 (USD Billion)
Table 49 China: Market Size, By Application, 2015-2021 (USD Billion)
Table 50 India: Propulsion Systems Market Size, By Type, 2015-2021 (USD Billion)
Table 51 India: Market Size, By Application, 2015-2021 (USD Billion)
Table 52 South Korea: Market Size, By Type, 2015-2021 (USD Billion)
Table 53 South Korea: Market Size, By Application, 2015-2021 (USD Billion)
Table 54 Japan: Propulsion Systems Market Size, By Type, 2015-2021 (USD Billion)
Table 55 Japan: Market Size, By Application, 2015-2021 (USD Billion)
Table 56 Rest of Asia-Pacific: Propulsion Systems Market Size, By Type, 2015-2021 (USD Billion)
Table 57 Rest of Asia-Pacific: Market Size, By Application, 2015-2021 (USD Billion)
Table 58 Middle East: Propulsion Systems Market Size, By Type, 2015-2021 (USD Billion)
Table 59 Middle East: Market Size, By Application, 2015-2021 (USD Billion)
Table 60 Middle East: Market Size, By Country, 2015-2021 (USD Billion)
Table 61 Israel: Market Size, By Type, 2015-2021 (USD Billion)
Table 62 Israel: Market Size, By Application, 2015-2021 (USD Billion)
Table 63 Turkey: Propulsion Systems Market Size, By Type, 2015-2021 (USD Billion)
Table 64 Turkey: Market Size, By Application, 2015-2021 (USD Billion)
Table 65 Rest of Middle East: Propulsion Systems Market Size, By Type, 2015-2021 (USD Billion)
Table 66 Rest of Middle East: Market Size, By Application, 2015-2021 (USD Billion)
Table 67 Rest of the World: Market, By Type, 2015-2021 (USD Billion)
Table 68 Rest of the World: Propulsion Systems Market Size, By Application, 2015-2021 (USD Billion)
Table 69 Rest of the World: Market, By Country, 2015-2021 (USD Billion)
Table 70 Brazil: Market Size, By Type, 2015-2021 (USD Billion)
Table 71 Brazil: Market Size, By Application, 2015-2021 (USD Billion)
Table 72 South Africa: Propulsion Systems Market, By Type, 2015-2021 (USD Billion)
Table 73 South Africa: Market, By Application, 2015-2021 (USD Billion)
Table 74 Contracts, April 2014- September 2016
Table 75 New Product Launches, May 2015- April 2015
Table 76 Acquisitions & Joint Venture, May 2014- July 2016
Table 77 Agreements & Partnerships, July 2012-August 2016
List of Figures (59 Figures)
Figure 1 Propulsion Systems: Markets Covered
Figure 2 Report Flow
Figure 3 Research Design:Propulsion Systems
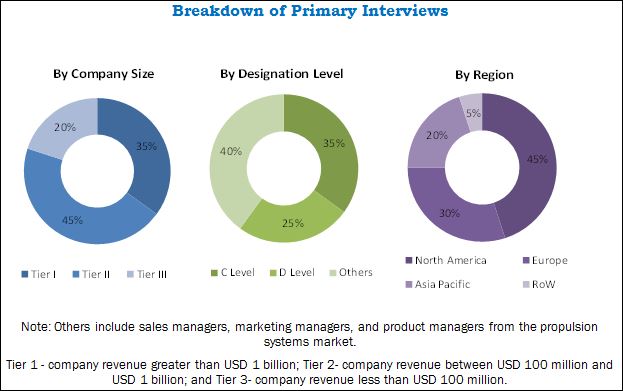
Figure 4 Breakdown of Primary Interviews: By Company Type, Designation, and Region
Figure 5 Top 15 Countries With the Highest Military Spending in 2015 (USD Billion)
Figure 6 Estimated Funding for Unmanned Systems By the U.S. Department of Defense (Dod) Between 2014 and 2018
Figure 7 Market Size Estimation Methodology: Bottom-Up Approach
Figure 8 Market Size Estimation Methodology: Top-Down Approach
Figure 9 Market Breakdown and Data Triangulation
Figure 10 Market, By Type, 2016 & 2021 (USD Billion)
Figure 11 Aircraft Application Segment Projected to Lead the Market Between 2016 and 2021
Figure 12 Asia-Pacific Propulsion Systems Market Projected to Grow at the Highest CAGR During the Forecast Period
Figure 13 Contracts Dominated as the Key Growth Strategy From April, 2014 to September, 2016
Figure 14 Increase in Defense Budgets Drives the Demand for Market
Figure 15 Aircraft Application Segment Projected to Lead the Market During the Forecast Period
Figure 16 Asia-Pacific Propulsion Systems Market in Missiles Application Projected to Grow at the Highest CAGR During the Forecast Period
Figure 17 Liquid Propulsion Segment Projected to Grow at the Highest CAGR During the Forecast Period
Figure 18 Europe Propulsion Systems Market Estimated to Capture Significant Share in 2016
Figure 19 Asia-Pacific Propulsion Systems Market Projected to Grow at the Highest CAGR Between 2016 and 2021
Figure 20 Increasing Commercial Application of Propulsion Systems Expected to Drive the Market During the Forecast Period
Figure 21 Maximum Value Addition Acheived During the Supply of Engine Parts
Figure 22 Maximum Value Addition is During Manufacturing Stage
Figure 23 Top Ten Jet Engines ,1938-2015
Figure 24 Electric Propulsion Segment Projected to Grow at the Highest CAGR Between 2016 and 2021
Figure 25 Gas Turbine & Jet Engine Subsegment Projected to Lead the Air-Breathing Propulsion Systems Market
Figure 26 Hybrid Propulsion Subsegment Anticipated to Account for the Largest Market Share in 2016
Figure 27 Unmanned Aerial Vehicles Segment Projected to Grow at the Highest CAGR During the Forecast Period
Figure 28 Commercial Aircraft Deliveries, 2014-2021 (Units)
Figure 29 Rocket Propulsion Systems Expected to Capture the Largest Market Share in 2016 and 2021
Figure 30 Unmanned Aerial Vehicles to Grow Aggresively Between 2015 and 2035
Figure 31 Market: Regional Snapshot
Figure 32 India, Brazil, and China Expected to Be the Emerging Hot Spots in Market
Figure 33 U.S. Estimated to Lead the North America Propulsion Systems Market in 2016
Figure 34 France Estimated to Lead the Europe Propulsion Systems Market in 2016
Figure 35 Market in China Projected to Grow at the Highest CAGR During the Forecast Period
Figure 36 Israel Projected to Lead the Middle East Propulsion Systems Market in 2016
Figure 37 Market in Brazil Expected to Grow at the Highest CAGR During the Forecast Period
Figure 38 Companies Adopted Agreements & Partnerships as the Key Growth Strategy Between July 2012 and September 2016
Figure 39 Market Share Analysis, 2015
Figure 40 Brand Analysis: Market
Figure 41 Contracts has Been the Most Aggressive Strategy Adopted By the Key Players of the Propulsion Systems Market
Figure 42 Agreements Emerging as A Significant Strategy Adopted By the Players in Propulsion Systems Market
Figure 43 Geographic Revenue Mix of Top 5 Market Players (2015)
Figure 44 Financial Highlights of Top Five Market Players
Figure 45 General Electric Co.: Company Snapshot
Figure 46 General Electric Company: SWOT Analysis
Figure 47 United Technologies Corporation: Company Snapshot
Figure 48 United Technologies Corporation: SWOT Analysis
Figure 49 Rolls-Royce Holding PLC.: Company Snapshot
Figure 50 Rolls-Royce Holdings PLC: SWOT Analysis
Figure 51 Safran S.A: Company Snapshot
Figure 52 Safran S.A: SWOT Analysis
Figure 53 Honeywell International Inc.: Company Snapshot
Figure 54 Honeywell International Inc.: SWOT Analysis
Figure 55 Northrop Grumman Corporation: Company Snapshot
Figure 56 The Raytheon Company: Company Snapshot
Figure 57 Aerojet Rocketdyne Holdings, Inc.: Company Snapshot
Figure 58 Orbital ATK: Company Snapshot
Figure 59 Lockheed Martin Corporation: Company Snapshot
The research methodology used to estimate and forecast the propulsion systems market included study of data and revenues of the key players in the market through secondary resources, such as annual reports, Yahoo Finance, Federal Aviation Admiration (FAA), International Civil Aviation Organization (ICAO), International Air Transport Association (IATA), and Stockholm International Peace Research Institute (SIPRI). Bottom-up procedure was employed to arrive at the overall size of the market from the revenue of the key players in this market. After arriving at the overall market size, the market was split into several segments and subsegments, which were then verified through primary research by conducting extensive interviews of the key industry experts, such as CEOs, vice presidents, directors, and executives, among others. These data triangulation and market breakdown procedures were employed to complete the overall market engineering process and arrive at exact statistics for all segments and subsegments. Breakdown of profiles of primaries is depicted in the figure given below:
To know about the assumptions considered for the study, download the pdf brochure
Market Ecosystem
The ecosystem of the propulsion systems market comprises type and application. The propulsion systems value chain includes raw material manufacturers, such as Safran S.A. (France), Rolls-Royce Holdings plc. (U.K.), and General Electric Company (U.S.), among others. The key players operating in the propulsion systems market include United Technologies Corporation (U.S.), 3W International GmbH (Germany), Orbital ATK Inc. (U.S.), Aerojet Rocketdyne Holdings, Inc. (U.S.), and Honeywell International Inc. (U.S.), among others. Acquisitions and new product launches are the major strategies adopted by the key players operational in the propulsions systems market to strengthen their position in the market.
This report aims at helping manufacturers, suppliers, and distributors of propulsion systems, as well as manufacturers of sub-components to identify hot revenue pockets in the market.
Target Audience for this Report
- Propulsion System Manufacturers
- Original Equipment Manufacturers (OEMs)
- Sub-Component Manufacturers
- Technological Support Providers
- Government and Certification Bodies
- Aircraft Manufacturer Associations
- Manufacturers of Unmanned Aerial Vehicles and Drones
“This study answers several questions for stakeholders, primarily, which market segments to focus on during the next two to five years to prioritize their efforts and investments in the propulsion systems market.”
Scope of the Report:
Propulsion Systems Market, By Type
-
Air-Breathing
- Gas Turbines & Jet Engines
- Ramjets & Scramjets
- Internal Combustion
-
Non-Air Breathing
- Solid Propulsion
- Liquid Propulsion
- Hybrid Propulsion
- Electric Propulsion
Propulsion Systems Market, By Application
- Missiles
- Aircraft
- Spacecraft
- Unnamed Aerial Vehicles
Propulsion Systems Market, By Region
- North America
- Europe
- Asia-Pacific
- Middle East
- Rest of the World
Available Customizations
Along with market data, MarketsandMarkets offers customizations as per specific needs of companies. The following customization options are available for this report:
-
Geographic Analysis
- Further breakdown of the rest of the world propulsion systems market
-
Company Information
- Detailed analysis and profiling of additional market players (up to 5)
- Additional Segmentation


Growth opportunities and latent adjacency in Propulsion Systems Market