Acaricides Market by Type (Organochlorine, Organophosphorus, Natural Sources, and Others), by Application (Agriculture, Animal Husbandry, Industrial, and Others), by Mode of Action (Spray, Dipping Vat, Hand Dressing and Others) & Geography - Trends & Forecasts to 2019


Chemicals that are used to kill ticks and mites are known as acaricides. They help in increasing the productivity by keeping animals and crops healthy and disease-free. Acaricides help crops grow healthy and also increase their productivity. Cattle, when treated with acaricides are less susceptible to tick-borne diseases and there is an increase in the milk and other product yield.
Factors that act as driving forces for this market are the increase in productivity, development in the crop protection industry, and the growing demand of crops and animal products across the world. The high cost of raw materials and the strict regulatory norms by the government pose as hindrances for Acaricides Market.
Various secondary sources such as encyclopedias, directories, and databases, were used to identify and collect information useful for this extensive market-oriented study of the acaricides market. The primary sources�experts from related industries and suppliers�were interviewed to obtain and verify critical information as well as to assess the future prospects of the global market.
To capitalize on the growth trend in this market, several leading companies are taking to new product launches as a growth strategy. The growing demand for acaricides market is compelling global players to focus more on research & development and offer innovative products in the market. The leading players of this industry have also been profiled with their recent developments and other strategic industry activities. These include BASF SE (Germany), Dow The Chemical Company (U.S.), Bayer AG (Germany), Merck &Co. Ltd (U.S.), and Syngenta (Japan).
Asia-Pacific: Acaricides Market Share (Value), by Type, 2013
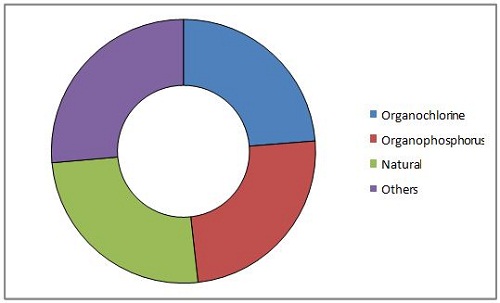
Source: MarketsandMarkets Analysis
Scope Of The Report
This research report categorizes the global acaricides market for acaricides on the basis of type, application, mode of action, and geography; projecting the market value and analyzing the trends in each of the sub-markets:
By type
- Organochlorine
- Organophosphorus
- Natural
- Others
By application
- Agriculture
- Animal Husbandry
- Industrial
- Others
By mode of application
- Spray
- Dipping vat
- Hand dressing
- Others
By geography
- North America
- Europe
- Asia-Pacific
- ROW
The global acaricides market is estimated to be valued at $275.1 million by 2019, at a projected CAGR of 5.2% from 2014.
Acaricides are chemicals that are manufactured and used for controlling the spread of arthropod pests. These pests, if allowed to spread, cause huge losses to agriculture and also infect various animals in the animal husbandry industry. There are numbers of acaricides available, which have different concentrations of various chemicals like chlorine, phosphorus, zinc, and tin. Acaricides have toxic effects too, due to which natural products like neem, clove, and spoiled corns, are also being used for the production of acaricides. These natural acaricides tend to be less toxic.
The Asia-Pacific region is estimated to be the largest consumer of acaricides in the world, followed by Europe. China is estimated as the largest market in the Asia-Pacific, having captured around 44% of the total market in the region, in 2013.
Acaricides Market Size, by Application, 2014 VS. 2019 ($Million)
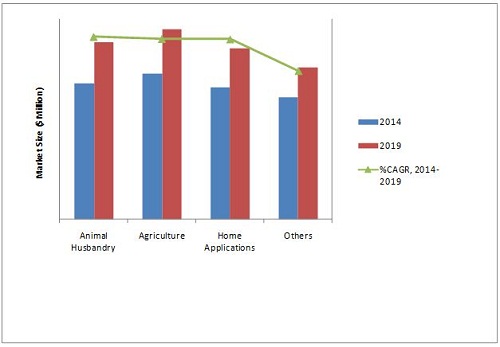
Source: MarketsandMarkets Analysis
The total market for acaricides was worth $195.8 million in 2013 and is projected to be valued at $275.1 million by 2019, growing at a CAGR of 5.2% from 2014. This market is growing steadily due to an increase in the usage of crop protection chemicals to control the spread of ticks and mite-borne diseases. The demand-driving factors of this market are developments in the crop protection industry and the rise in demand for meat and dairy products. The restraining factors are the regulatory restrictions in some countries and the rising cost of acaricides.
Key participants in the acaricides market are BASF SE (Germany), Arysta LifeScience (Japan), Bayer AG (Germany), DuPont (U.S.), and FMC Corporation (U.S.). The acaricides market is witnessing rapid development in the areas of new product launches, with a focus on increasing the availability of various acaricides in the market and also on increasing their global market share.
 Exclusive indicates content/data unique to MarketsandMarkets and not available with any competitors.
Table of Contents
1 Introduction (Page No. - 15)
1.1 Key Take-Aways
1.2 Report Description
1.3 Markets Covered
1.4 Research Methodology
1.4.1 Market Size Estimation
1.4.1.1 Market Crackdown & Data Triangulation
1.4.1.2 Assumptions
1.4.1.2.1 Periodization Considered For the Acaricides Market
1.4.1.3 Key Data Taken From Secondary Sources
1.4.1.4 Key Data Taken From Primary Sources
2 Executive Summary (Page No. - 25)
3 Premium Insights (Page No. - 28)
3.1 Acaricides Market
3.2 Drivers & Restraints
3.3 Market By Application
3.4 Market Size, By Type
3.5 Market By Mode of Action
3.6 Market By Geography
3.7 Asia-Pacific: Acaricides Market Size
3.8 Market Size By Segmentation
4 Market Analysis (Page No. - 37)
4.1 Introduction
4.2 Market Dynamics
4.2.1 Drivers
4.2.1.1 Increase in Productivity
4.2.1.2 Development in Crop Protection Industry
4.2.1.3 Increasing Demand For Meat, Dairy Products, and Crops
4.2.2 Restraints
4.2.2.1 Alternative Acaricides Sources
4.2.2.2 Regulatory Restrictions
4.2.2.3 Rising Cost
4.2.3 Opportunities
4.2.3.1 Rapid Growth in the Bioactive Acaricides Market
4.2.4 Burning Issues
4.2.4.1 Ban on Pesticides in Thailand and Belgium
4.3 Porter�s Five Forces
4.3.1 Suppliers� Bargaining Power
4.3.2 Buyers� Bargaining Power of Buyers
4.3.3 Threat of New Entrants
4.3.4 Threat of Substitutes
4.3.5 Degree of Competition
4.4 Market Share Analysis
5 Market Overview (Page No. - 47)
5.1 Introduction
5.2 Role of Acaricides in Disease Management
5.3 History & Evolution
5.4 Market Statistics
5.4.1 Market Share Analysis
5.4.2 Acaricides Market
5.4.3 Sub-Markets
5.4.4 Related Markets
5.4.4.1 Fungicides Market
5.4.4.2 Insecticides Market
5.4.4.3 Herbicides Market
6 Industry Analysis (Page No. - 57)
6.1 Introduction
6.2 Value Chain Analysis
6.2.1 Reactor System
6.2.2 Fractionation System
6.2.3 Scrubber
6.2.4 Waste Management
6.2.5 Dryer
6.2.6 Packaging
6.2.7 Warehouse
6.3 Supply Chain Analysis
6.3.1 Raw Material Supplier
6.3.2 Manufacturer
6.3.3 Distributor:
6.3.4 End User:
7 Acaricides Market, By Type (Page No. - 62)
7.1 Introduction
7.1.1 Organochlorine Acaricides
7.1.2 Organophosphorus Acaricides
7.1.3 Natural Sources Acaricides
7.1.4 Others
8 Acaricides Market, By Application (Page No. - 69)
8.1 Introduction
8.2 Agriculture
8.3 Animal Husbandry
8.4 Industrial
8.5 Others (Application)
9 Market By Mode of Action (Page No. - 77)
9.1 Introduction
9.1.1 Spray
9.1.2 Dipping Vat
9.1.3 Hand Dressing
9.1.4 Others
10 Acaricides Market By Geography (Page No. - 86)
10.1 Introduction
10.2 North America:
10.2.1 U.S:
10.2.2 Canada
10.2.3 Rest of North America
10.3 Europe
10.3.1 Germany
10.3.2 France
10.3.3 Italy
10.3.4 Rest of Europe
10.4 Asia-Pacific
10.4.1 China
10.4.2 Japan
10.4.3 India
10.4.4 Rest of Asia-Pacific
10.5 Rest of the World
10.5.1 Brazil
10.5.2 Argentina
10.5.3 Other ROW Countries
11 Competitive Landscape (Page No. - 135)
11.1 Introduction
11.2 New Product Launches: the Most Preferred Strategic Approach
11.3 Maximum Developments in 2013
11.4 Dupont: the Most Active Company
12 Company Profile (Page No. - 143)
(Company At A Glance, Recent Financials, Products & Services, Strategies & Insights, & Recent Developments)*
12.1 Arysta Lifescience
12.2 BASF SE
12.3 Bayer AG
12.4 Chemtura Corporation
12.5 Dupont
12.6 FMC Corporation
12.7 Merck & Co., Inc.
12.8 Nissan Chemical Industries, Ltd.
12.9 Syngenta AG
12.10 the Dow Chemical Company
*Details on Company At A Glance, Recent Financials, Products & Services, Strategies & Insights, & Recent Developments Might Not Be Captured in Case of Unlisted Companies.
List of Tables (82 Tables)
Table 1 Acaricides Market Size Estimation
Table 2 Market Size By Type, 2012�2019 ($Million)
Table 3 Market Size By Type 2012-2019 ($Million)
Table 4 Organochlorine Market Size, By Geography, 2012-2019 ($Million)
Table 5 Organophosphorus Acaricides Market Size, By Geography, 2012-2019 ($Million)
Table 6 Natural Sources Market Size, By Geography, 2012-2019 ($Million)
Table 7 Others Market Size, By Geography, 2012-2019 ($Million)
Table 8 Acaricides Market Size, By Application, 2012-2019 ($Million)
Table 9 Agriculture Market Size, By Geography, 2012-2019 ($Million)
Table 10 Animal Husbandry Market Size, By Geography, 2012-2019 ($Million)
Table 11 Industrial Market Size, By Geography, 2012-2019 ($Million)
Table 12 Others Market Size, By Geography, 2012-2019 ($Million)
Table 13 Acaricides Market Size, By Mode of Action, 2012-2019 ($Million)
Table 14 Spary Market Size, By Geography, 2012-2019 ($Million)
Table 15 Dipping Vat Market Size, By Geography, 2012-2019 ($Million)
Table 16 Hand Dressing Market Size, By Geography, 2012-2019 ($Million)
Table 17 Others Market Size, By Geography, 2012-2019 ($Million)
Table 18 Acaricides Market Size, By Geography, 2012-2019 ($Million)
Table 19 North America: Market Size, By Country, 2012-2019 ($Million)
Table 20 U.S.: Acaricides : By Market Size, By Type, 2012-2019 ($Million)
Table 21 U.S.: Acaricides : By Market Size, By Application, 2012-2019 ($Million)
Table 22 U.S.: Acaricides : By Market Size, By Mode of Action, 2012-2019 ($Million)
Table 23 Canada: Acaricides Market Size, By Type, 2012-2019 ($Million)
Table 24 Canada: Market Size, By Application, 2012-2019 ($Million)
Table 25 Canada: Market Size, By Mode of Action, 2012-2019 ($Million)
Table 26 Rest of North America: Acaricides Market Size, By Type, 2012-2019 ($Million)
Table 27 Rest of North America: Market Size, By Application, 2012-2019 ($Million)
Table 28 Rest of North America: Acaricides Market Size, By Mode of Action, 2012-2019 ($Million)
Table 29 Europe: Acaricides : By Market Size, By Country, 2012-2019 ($Million)
Table 30 Germany: Acaricides : By Market Size, By Type, 2012-2019 ($Million)
Table 31 Germany: Acaricides : By Market Size, By Application, 2012-2019 ($Million)
Table 32 Germany: Acaricides : By Market Size Size, By Mode of Action, 2012-2019 ($Million)
Table 33 France: Acaricides : By Market Size, By Type, 2012-2019($Million)
Table 34 France: Acaricides : By Market Size, By Application, 2012-2019 ($Million)
Table 35 France: Acaricides : By Market Size, By Mode of Acttion, 2012-2019 ($Million)
Table 36 Italy: Acaricides Market Size, By Type, 2012-2019 ($Million)
Table 37 Italy: Acaricides : By Market Size, By Application, 2012-2019 ($Million)
Table 38 Italy: Acaricides : By Market Size, By Mode of Action, 2012-2019 ($Million)
Table 39 Rest of Europe: Market Size, By Type, 2012-2019 ($Million)
Table 40 Rest of Europe: Market Size, By Application, 2012-2019 ($Million)
Table 41 Rest of Europe: Market Size, By Mode of Action, 2012-2019 ($Million)
Table 42 Asia-Pacific: Acaricides Market Size, By Country, 2012-2019 ($Million)
Table 43 China: Acaricides : By Market Size, By Type, 2012-2019 ($Million)
Table 44 China: Acaricides : By Market Size, By Application, 2012-2019 ($Million)
Table 45 China: Acaricides : By Market Size, By Mode of Action, 2012-2019 ($Million)
Table 46 Japan: Acaricides Market Size, By Type, 2012-2019 ($Million)
Table 47 Japan: Acaricides : By Market Size, By Application, 2012-2019 ($Million)
Table 48 Japan: Acaricides : By Market Size, By Mode of Action, 2012-2019 ($Million)
Table 49 India: Acaricides : By Market Size, By Type, 2012-2019 ($Million)
Table 50 India: Acaricides Market Size, By Application, 2012-2019 ($Million)
Table 51 India: Acaricides : By Market Size, By Mode of Action, 2012-2019 ($Million)
Table 52 Rest of Asia-Pacific: Market Size, By Type, 2012-2019 ($Million)
Table 53 Rest of Asia-Pacific: Market Size, By Application, 2012-2019 ($Million)
Table 54 Rest of Asia-Pacific: Market Size, By Mode of Action, 2012-2019 ($Million)
Table 55 ROW: Acaricides Market Size, By Country, 2012-2019 ($Million)
Table 56 Brazil: Market Size, By Type, 2012-2019 ($Million)
Table 57 Brazil: Market Size, By Application, 2012-2019 ($Million)
Table 58 Brazil: Market Size, By Mode of Action, 2012-2019 ($Million)
Table 59 Argentina: Acaricides Market Size, By Type, 2012-2019 ($Million)
Table 60 Argentina: Market Size, By Application, 2012-2019 ($Million)
Table 61 Argentina: Market Size, By Mode of Action, 2012-2019 ($Million)
Table 62 Other ROW Countries: Acaricides Market Size, By Type, 2012-2019 ($Million)
Table 63 Other ROW Countries: Market Size, By Application, 2012-2019 ($Million)
Table 64 Other ROW Countries: Acaricides Market Size, By Mode of Action, 2012-2019 ($Million)
Table 65 Mergers & Acquisitions, 2010
Table 66 New Product Launches, 2009-2014
Table 67 Expansions, 2010-2013
Table 68 Divestments, Investments & Agreements, 2012-2014
Table 69 Arysta Lifescience: Products & their Description
Table 70 Acequinol Used By Arysta Lifescience in Plants, in California, 2012
Table 71 BASF SE: Products & their Description
Table 72 Pyridaben Used By BASF SE in Plants, in California, 2012
Table 73 Bayer AG: Products & Their Description
Table 74 Spirondiclofen Used By Bayer AG in Plants, in California, 2012
Table 75 Chemtura Corporation: Products & Their Description
Table 76 Propargite Used By Chemtura Corporation in Plants, in California, 2012
Table 77 Dupont: Products & Their Description
Table 78 FMC Corportaion: Products & Their Description
Table 79 Merck & Co., Inc.: Products & Their Description
Table 80 Nissan Chemical Industries, Ltd.: Products & Their Description
Table 81 Syngenta AG: Products & Their Description
Table 82 The Dow Chemical Company: Products & Their Description
List of Figures (29 Figures)
Figure 1 Acaricides Market Segmentation
Figure 2 Market Size: Estimation Methodology
Figure 3 Market Segmentation
Figure 4 Market: Drivers Vs. Restraints
Figure 5 Acaricides Market Size, By Application, 2014-2019 ($Million)
Figure 6 Market, By Type 2013-2019 ($Million)
Figure 7 Market Size, By Mode of Action, 2013-2019 ($Million)
Figure 8 Acaricides Market Size, By Country, 2012�2019 ($Million)
Figure 9 Asia-Pacific: Market Size, 2013 ($Million)
Figure 10 Acaricides, By Segmentation, 2013 ($Million)
Figure 11 Impact Analysis of Drivers on The Acaricides Market
Figure 12 Porter�s Five Forces Analysis
Figure 13 Acaricides Market Share (Value), By Company, 2013
Figure 14 Evolution of Acaricides
Figure 15 Acaricides Market Share, By Company, 2013
Figure 16 Market Share (Value), By Geography, 2013 ($Million)
Figure 17 Market Share (Value), By Type, 2013 ($Million)
Figure 18 Fungicides Market Size, By Geography,2013 ($Million)
Figure 19 Insecticides Market Share (Value), By Geography, 2013 ($Million)
Figure 20 Herbicides Market Share (Value), By Geography, 2012 ($Million)
Figure 21 Value Chain Analysis of Acaricides Market
Figure 22 Global Acaricides Market Development Share, By Growth Strategy, 2009-2014
Figure 23 Annual Market Developments, By Growth Strategy, 2009-2014
Figure 24 Global Market Development Share, By Company, 2009-2014
Figure 25 BASF SE: SWOT Analysis
Figure 26 Bayer AG: SWOT Analysis
Figure 27 Dupont: SWOT Analysis
Figure 28 FMC Corportaion: SWOT Analysis
Figure 29 The Dow Chemical Company: SWOT Analysis


Growth opportunities and latent adjacency in Acaricides Market