4K Display Resolution Market by Product Types (Digital Camera, Monitor, Projectors, Smart TV, Smartphone and Tablets ), by Resolution, by Application (Aerospace & Defense, Business & Education, Consumer Electronics, and Entertainment), and by Geography - Analysis & Forecast to 2014 - 2020


4K refers to 4,000 pixels in several digital formats of horizontal resolution mainly used for shooting motion pictures in addition to scanning 35 mm film into digital. 4K products are used in various applications like aerospace & defense, business & education, consumer electronics, entertainment, retail & advertisement, and so on. When compared to other products, smart TVs and digital cameras are showing significant growth rate. The cinematographers are also showing interest in capturing high resolution images which can drive the 4K camera market in the coming years. The major challenge is the increase in bandwidth which leads to storage requirement while streaming 4k display resolution pictures and videos.
The 4k display resolution product types include camcorders, smart TVs, projectors, digital cameras, monitors, smartphones & tablets, and others. The smart TVs are expected to witness a high growth rate in the coming two to three years because of the demand of large screen TVs which can capture the 4K market. The 4K market is expected to reach $371.35 billion in 2020 from $57.83 billion in 2014, at a CAGR of 36.33% from 2014 to 2020.
The report also presents the market trends which depicts the growth of the 4k display resolution market from 2014 to 2020. The report presents detail analysis of different segments for global which includes product types, resolutions, application, and geography. The analysis of global is done with special focus on high growth application in each vertical and fast growing application market segment. Illustrative segmentation, analysis, and forecast of the major geographical markets give an overall view of the global market.
The major companies are AU Optronics Corp (Taiwan), EIZO Corporation (Japan), Sony Corporation (Japan), LG Electronics (South Korea), Panasonic Corporation (Japan), Sharp Corporation (Japan), and Samsung Electronics Co., Ltd. (South Korea).
Market by Product Type:
The product type market includes; camcorders, smart TVs, projectors, digital cameras, monitors, smartphones & tablets, and others.
Market by Resolution:
The product type market use different resolution which lies within the range of true 4K. These resolutions are 3840x2160, 4096x2160, 3996x2160, 5120x3200, and 5120x2160.
Market by Application:
The application market for 4k display resolution is growing with high pace. Consumer electronics application is contributing from the past, whereas, other applications like entertainment and retail and advertisement are emerging in this market. Among all applications consumer electronics is one of the fastest growing applications.
Market by Geography:
The 4k display resolution market by geography is segmented into four different regions: Americas, Europe, APAC, and Rest of world.
The report recognizes the market dynamics like drivers, restrains, and opportunities. Apart from the market segmentation, the report also includes critical market data and qualitative information for each product type along with quantitative analysis such as Porter�s five force analysis, market time-line analysis, industry breakdown analysis, and value chain analysis.
Please click here to get the relevant report of 4K Technology Market 4K Technology Market by Product (TVs, Monitors, Digital Signage, Set-Top Boxes, Smartphones, Tablets, Laptops, Projectors, Cameras, and Blu-Ray Players) and Geography (North America, Europe, APAC, and RoW) - Global Analysis and Forecast to 2020
2K resolution provides an image of approximately 2000 pixels and 4k display resolution doubles those dimensions into 4096x2160 which is equal to 8.8 million pixels, precisely four times the count of 2K projection. Generally in professional and everyday products like digital cameras, projectors, TVs, and also in smartphones, the 4K video are being produced.
The report provides the contribution of the 4k display resolution market with inclusive forecasts for revenue across product types, resolution, applications, and geography related to this market. The product type section is further segmented into camcorders, smart TVs, projectors, digital cameras, monitors, smartphones & tablets, and others. Applications of 4k display resolution include aerospace & defense, business & education, consumer electronics, entertainment, retail & advertisement, and so on. This report covers geographical regions which include Americas, Europe, Asia-Pacific and, the Rest of the World (ROW).
The major companies are AU Optronics Corp. (Taiwan), EIZO Corporation (Japan), Sony Corporation (Japan), LG Electronics (South Korea), Panasonic Corporation (Japan), Sharp Corporation (Japan), and Samsung Electronics Co., Ltd. (South Korea).
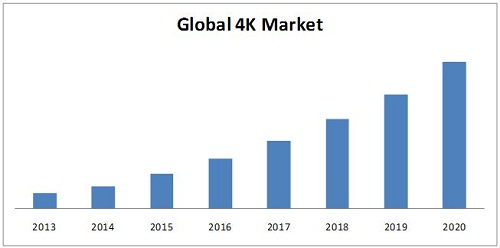
Source: MarketsandMarkets Analysis
The 4k display resolution market is expected to reach $371.35 billion by the end of 2020, at a CAGR of 36.33%. Latest technological breakthrough of 4K in various products can make the overall process more efficient and can significantly improve accuracy in various applications especially in picture image quality. Among all the 4k display resolution products, smart TVs, digital cameras, and projectors are widely used in various applications. The 4k display resolution smart TV market is driven majorly by the growing consumer electronics applications. There is a huge demand from consumers for large screen TVs to get a theatre-like experience. The cinematography camera market is in a mature phase; especially digital cinema camera is expected to show a significant growth in the coming years.
 Exclusive indicates content/data unique to MarketsandMarkets and not available with any competitors.
Table of Contents
1 Introduction (Page No. - 18)
1.1 Key Take-Aways
1.2 Report Description
1.3 Markets Covered
1.4 Stakeholders
1.5 Research Methodology
1.5.1 Market Size
1.5.2 Key Data Taken From Secondary Sources
1.5.3 Key Data Taken From Primary Sources
1.5.4 Assumptions Made for This Report
2 Executive Summary (Page No. - 30)
3 Coverstory (Page No. - 33)
3.1 Cover Story - Interview With Managing Director At Eizo Ltd.
3.2 Cover Story - Interview With Vice President of Marketing At Marseille Networks Inc.
3.3 Cover Story- Interview With Business Strategy and Marketing Director At Zenterio Ab
4 Market Overview (Page No. - 42)
4.1 Introduction
4.2 Market Definition
4.3 Evolution of 4K
4.4 Market Dynamics
4.4.1 Market Drivers
4.4.1.1 Demand for Large Screen TVS With High Resolution, To Get Theatre Like Experience, Boosts the Consumer Interest
4.4.1.2 4K Provides An Ecosystem for Content Creation, Distribution and Processing
4.4.1.3 the Mass Production of 4K Products With Affordable Price
4.4.2 Market Restraints
4.4.2.1 Broadcasting of 4K Content Requires Considerably More Bandwidth Than Hd Content
4.4.2.2 4K Will Require Heavy Investment for Content Creation and Broadcasting
4.4.3 Market Opportunities
4.4.3.1 4K Provides An Opportunity To Generate New Services and Distinguish the Existing Services for Media Companies
4.4.3.2 4K Technology Extending Its Applications From Smartphone and Tablets To Wearable Devices
4.4.4 Burning Issues
4.4.4.1 Lack of Awareness of the 4K Concept Among the Consumers
4.4.5 Winning Imperatives
4.4.5.1 Partnering With Major Players
4.5 Value Chain Analysis
4.6 Porter�s Five forces Model
4.6.1 Threat From New Entrants
4.6.2 Threat of Substitutes
4.6.3 Bargaining Power of Suppliers
4.6.4 Bargaining Power of Buyers
4.6.5 Degree of Competition
5 4K Market By Product Type (Page No. - 66)
5.1 Introduction
5.1.1 Display By Size
5.1.1.1 1 To 30 Inch Displays
5.1.1.2 30 To 40 Inch Displays
5.1.1.3 50 Inch and Above Displays
5.2 Camcorders
5.2.1 Major Companies offering 4K Camcorders
5.3 Digital Cameras
5.3.1 Major Companies offering 4K Digital Cameras
5.3.2 Compact Cameras
5.3.3 Digital Cinema Cameras
5.3.4 Wearable 4K Cameras
5.4 Smart TVs
5.4.1 Ultra HD TVS
5.4.2 Organic Light Emitting Diodes TVs (OLED TVS)
5.4.3 Access Platforms
5.4.3.1 Blu-Ray
5.4.3.2 Internet Protocol Television (IPTV) & Over-the-Top (OTT)
5.4.3.3 Satellite Operators
5.4.3.3.1 Set-Top Boxes
5.4.3.4 Digital Terrestrial Television (DTT)
5.5 Monitors
5.5.1 Major Companies offering 4K Monitors
5.6 Projectors
5.6.1 Major Companies offering 4K Projectors
5.7 Smartphone & Tablets
5.7.1 Major Companies offering 4K Smartphones and Tablets
5.8 Others
6 4K Market By Resolution (Page No. - 133)
6.1 Introduction
6.2 3840 X2160 Resolution
6.3 4096x2160 Resolution
6.4 3996x2160 Resolution
6.5 5120x3200 Resolution
6.6 5120x2160 Resolution
7 4K By formats (Page No. - 138)
7.1 Introduction
7.2 H.264
7.2.1 Major Companies Using H.264 With 4K Resolution
7.3 H.265 (HEVC)
7.3.1 Major Companies Using H.265 With 4K Resolution
7.4 VP9
7.4.1 Major Companies Using Vp9 With 4K Resolution
7.5 VC-8150
8 4K Market By Application (Page No. - 144)
8.1 Introduction
8.2 Aerospace and Defense
8.3 Business and Education
8.4 Consumer Electronics
8.5 Entertainment
8.5.1 Digital Cinemas and Broadcasting
8.5.2 Gaming
8.6 Retail and Advertisement
8.7 Others
9 4K Market By Geography (Page No. - 161)
9.1 Introduction
9.2 Americas
9.2.1 Major Companies offering 4K Products in Americas
9.2.2 North America
9.2.3 the U.S.
9.2.4 Canada
9.2.5 Mexico
9.2.6 South America
9.3 Europe
9.3.1 Major Companies offering 4K Products in Europe
9.3.2 Germany
9.3.3 France
9.3.4 Spain
9.3.5 The U.K.
9.3.6 Others
9.4 APAC
9.4.1 Major Companies offering 4K Products in APAC
9.4.2 India
9.4.3 China
9.4.4 Japan
9.4.5 South Korea
9.4.6 Others
9.5 ROW
9.5.1 Major Companies offering 4K Products in ROW
9.5.2 Israel
9.5.3 The Middle East & Africa
10 Competitive Landscape (Page No. - 198)
10.1 Market Share Analysis
10.2 Key Growth Strategies
10.2.1 New Product Developments
10.2.2 Partnerships, Agreements, Collaborations and Strategic Cooperations
10.2.3 Mergers and Acquisitions
10.2.4 Others
11 Company Profiles (Overview, Products and Services, Financials, Strategy & Development)* (Page No. - 221)
11.1 AJA Video Systems
11.2 AU Optronics Corp.
11.3 Canon Inc.
11.4 Eizo Corporation
11.5 Innolux Corporation
11.6 LG Electronics
11.7 Marseille Networks Inc.
11.8 Panasonic Corporation
11.9 Planar Systems Inc.
11.10 Pointgrab Ltd.
11.11 Red Digital Cinema Camera Company
11.12 Samsung Electronics Co. Ltd.
11.13 Sharp Corporation
11.14 Sony Corporation
*Details on Overview, Products and Services, Financials, Strategy & Development Might Not Be Capturedin Case of Unlisted Companies.
List of Tables (102 Tables)
Table 1 General Assumptions, Terminologies, and Application Keynotes
Table 2 4K Display Resolution Market Size, By Geography, 2013-2020 ($Billion)
Table 3 Technology Providers
Table 4 Display Manufacturers
Table 5 Content Providers
Table 6 Original Equipment Manufacturers (OEMS)
Table 7 Threat From New Entrants
Table 8 4K Display Resolution Market Size, By Type, 2013-2020 ($Billion)
Table 9 4K Display Market Size, By Inch, 2013-2020 ($Billion)
Table 10 4K Camcorder Market Size, By Resolution, 2013-2020 ($Million)
Table 11 4K Camcorder Market Size, By Geography, 2013-2020 ($Million)
Table 12 4K Camcorder Market Size, By Application, 2013-2020 ($Million)
Table 13 4K Camcorder Market Size, for Aerospace & Defense Application, By Geography, 2013-2020 ($Million)
Table 14 4K Camcorder Market Size, for Business & Education Application, By Geography, 2013-2020 ($Million)
Table 15 4K Camcorder Market Size, for Consumer Electronics Application, By Geography, 2013-2020 ($Million)
Table 16 4K Camcorder Market Size, for Other Application, By Geography, 2013-2020 ($Million)
Table 17 4K Digital Camera Market Size, By Type, 2013-2020 ($Billion)
Table 18 4K Digital Camera Market Size, By Resolution, 2013-2020 ($Billion)
Table 19 4K Digital Camera Market Size, By Geography, 2013-2020 ($Billion)
Table 20 4K Digital Camera Market Size, By Application, 2013-2020 ($Billion)
Table 21 4K Digital Camera Market Size, for Aerospace & Defense Application, By Geography, 2013-2020 ($Million)
Table 22 4K Digital Camera Market Size, for Business & Education Application, By Geography, 2013-2020 ($Million)
Table 23 4K Digital Camera Market Size, for Consumer Electronics Application, By Geography, 2013-2020 ($Million)
Table 24 4K Digital Camera Market Size, for Entertainment Application, By Geography, 2013-2020 ($Million)
Table 25 4K Digital Camera Market Size, for Other Application, By Geography, 2013-2020 ($Million)
Table 26 4K Smart TV Market Size, By Type, 2013-2020 ($Billion)
Table 27 4K Smart TV Market Size, By Inch, 2013-2020($Billion)
Table 28 4K Smart TV Market Size, By Resolution, 2013-2020 ($Billion)
Table 29 4K Smart TV Market Size, By Geography, 2013-2020 ($Billion)
Table 30 4K Smart TV Market Size, By Application, 2013-2020 ($Billion)
Table 31 4K Smart TV Market Size, for Business & Education Application, By Geography, 2013-2020 ($Billion)
Table 32 4K Smart TV Market Size, for Consumer Electronics Application, By Geography, 2013-2020 ($Billion)
Table 33 4K Smart TV Market Size, for Entertainment Application, By Geography, 2013-2020 ($Billion)
Table 34 4K Smart TV Market Size, for Retail & Advertisement Application, By Geography, 2013-2020 ($Billion)
Table 35 4K Smart TV Market Size, for Other Application, By Geography, 2013-2020 ($Billion)
Table 36 4K Monitor Market Size, By Resolution, 2013-2020 ($Billion)
Table 37 4K Monitor Market Size, By Geography, 2013-2020 ($Billion)
Table 38 4K Monitor Market Size, By Application, 2013-2020 ($Billion)
Table 39 4K Monitor Market Size, for Aerospace & Defense Application, By Geography, 2013-2020 ($Million)
Table 40 4K Monitor Market Size, for Business & Education Application, By Geography, 2013-2020 ($Million)
Table 41 4K Monitor Market Size, for Consumer Electronics Application, By Geography, 2013-2020 ($Million)
Table 42 4K Monitor Market Size, for Entertainment Application, By Geography, 2013-2020 ($Million)
Table 43 4K Monitor Market Size, for Retail & Advertisement Application, By Geography, 2013-2020 ($Million)
Table 44 4K Monitor Market Size, for Other Application, By Geography, 2013-2020 ($Million)
Table 45 4K Projector Market Size, By Geography, 2013-2020 ($Million)
Table 46 4K Projector Market Size, By Application, 2013-2020 ($Million)
Table 47 4K Projector Market Size, for Aerospace & Defense Application, By Geography, 2013-2020 ($Million)
Table 48 4K Projector Market Size, for Business & Education Application, By Geography, 2013-2020 ($Million)
Table 49 4K Projector Market Size, for Consumer Electronics Application, By Geography, 2013-2020 ($Million)
Table 50 4K Projector Market Size, for Entertainment Application, By Geography, 2013-2020 ($Million)
Table 51 4K Projector Market Size, for Retail & Advertisement Application, By Geography, 2013-2020 ($Million)
Table 52 4K Projector Market Size, for Other Application, By Geography, 2013-2020 ($Million)
Table 53 4K Smartphone & Tablets Market Size, By Geography, 2013-2020 ($Million)
Table 54 4K Smartphone & Tablets Market Size, By Application, 2013-2020 ($Million)
Table 55 4K Smartphones & Tablets Market Size, for Business & Education Application, By Geography, 2013-2020 ($Million)
Table 56 4K Smartphones & Tablets Market Size, for Consumer Electronics Application, By Geography, 2013-2020 ($Million)
Table 57 4K Smartphones & Tablets Market Size, for Entertainment Application, By Geography, 2013-2020 ($Million)
Table 58 4K Smartphones & Tablets Market Size, for Other Application, By Geography, 2013-2020 ($Million)
Table 59 4K Other Products Market Size, By Geography, 2013-2020 ($Million)
Table 60 4K Other Products Market Size, By Application, 2013-2020 ($Million)
Table 61 4K Resolution: Classification
Table 62 4K Display Resolution Market Size By Resolution, 2013-2020 ($Billion)
Table 63 Market Size, By Application, 2013-2020 ($Billion)
Table 64 Market Size for Aerospace & Defense Application, By Type, 2013-2020 ($Million)
Table 65 Market Size for Business & Education Application, By Type, 2013-2020 ($Billion)
Table 66 Market Size for Consumer Application, By Type, 2013-2020 ($Billion)
Table 67 Market Size for Entertainment Application, By Type, 2013-2020 ($Billion)
Table 68 Market Size for Retail & Advertisement Application, By Type, 2013-2020 ($Million)
Table 69 Market Size for Other Application, By Type, 2013-2020 ($Billion)
Table 70 Americas 4K Display Resolution Market Size, By Type, 2013-2020 ($Billion)
Table 71 Americas: Market Size, By Application, 2013-2020 ($Billion)
Table 72 Americas: Market Size, By Region, 2013-2020 ($Billion)
Table 73 North America 4K Display Resolution Market Size, By Country, 2013-2020 ($Billion)
Table 74 The U.S. 4K Display Resolution Market Size, By Type, 2013-2020 ($Billion)
Table 75 Canada 4K Display Resolution Market Size, By Type, 2013-2020 ($Billion)
Table 76 Mexico 4K Display Resolution Market Size, By Type, 2013-2020 ($Billion)
Table 77 South America 4K Display Resolution Market Size, By Country, 2013-2020 ($Billion)
Table 78 Europe 4K Display Resolution Market Size, By Type, 2013-2020 ($Billion)
Table 79 Europe: Market Size, By Application, 2013-2020 ($Billion)
Table 80 Europe: Market Size, By Region, 2013-2020 ($Billion)
Table 81 Germany 4K Display Resolution Market Size, By Type, 2013-2020 ($Billion)
Table 82 France 4K Display Resolution Market Size, By Type, 2013-2020 ($Billion)
Table 83 Spain 4K Display Resolution Market Size, By Type, 2013-2020 ($Billion)
Table 84 The U.K. 4K Display Resolution Market Size, By Type, 2013-2020 ($Billion)
Table 85 Others 4K Display Resolution Market Size, By Type, 2013-2020 ($Million)
Table 86 APAC: Market Size, By Type, 2013-2020 ($Billion)
Table 87 APAC: Market Size, By Application, 2013-2020 ($Billion)
Table 88 APAC: Market Size, By Region, 2013-2020 ($Billion)
Table 89 India 4K Display Resolution Market Size, By Type, 2013-2020 ($Million)
Table 90 China 4K Display Resolution Market Size, By Type, 2013-2020 ($Million)
Table 91 Japan 4K Display Resolution Market Size, By Type, 2013-2020 ($Million)
Table 92 South Korea 4K Display Resolution Market Size, By Type, 2013-2020 ($Million)
Table 93 Others 4K Display Resolution Market Size, By Type, 2013-2020 ($Million)
Table 94 ROW Market Size, By Type, 2013-2020 ($Billion)
Table 95 ROW Market Size, By Application, 2013-2020 ($Billion)
Table 96 ROW Market Size, By Region, 2013-2020 ($Billion)
Table 97 Israel Market Size, By Type, 2013-2020 ($Million)
Table 98 The Middle East & Africa 4K Display Resolution Market Size, By Type, 2013-2020 ($Million)
Table 99 4K Display Resolution Market: New Product Launches, 2011�2014
Table 100 Partnership, Agreements, Collaborations and Strategic Cooperations, 2011�2014
Table 101 Mergers & Acquisitions, 2011�2014
Table 102 Other Developments, 2011�2014
List of Figures (64 Figures)
Figure 1 4K Display Resolution Market Segmentation, 2013
Figure 2 Market Research Methodology
Figure 3 Market Size Estimation
Figure 4 Market Crackdown and Data Triangulation
Figure 5 4K Display Resolution Market Size, 2013-2020 ($Billion)
Figure 6 4 K Resolutions
Figure 7 4K Display Resolution Market Segmentation
Figure 8 Evolution of 4K
Figure 9 Market Drivers: Impact Analysis, 2014-2020
Figure 10 Market Restraints: Impact Analysis, 2014-2020
Figure 11 Market Opportunities: Impact Analysis, 2014-2020
Figure 12 Market: Value Chain Analysis
Figure 13 Porter�s Five forces Analysis of 4K Display Resolution Market
Figure 14 Threat of New Substitutes in Market
Figure 15 Bargaining Power of Suppliers in Market
Figure 16 Bargaining Power of Buyers in Market
Figure 17 Degree of Competition in Market
Figure 18 4K Display Resolution Market: Product Types
Figure 19 Organic Light Emitting Diodes:Types
Figure 20 IPTV: forms
Figure 21 4K Projector Market Size, By Resolution, 2013-2020 ($Million)
Figure 22 4K Smartphones & Tablet Market Size, By Resolution, 2013-2020 ($Billion)
Figure 23 formats of 4K: Different Types
Figure 24 4K Display Resolution Market: Applications
Figure 25 4K Display Resolution Market By Geography: Segmentation
Figure 26 Global 4K Display Resolution Market Share Value, By Geography
Figure 27 Market Share Analysis of Key Players, 2013
Figure 28 4K Display Resolution Market Share, By Growth Strategies, 2011�2014
Figure 29 AJA Video Systems: Company Snapshot
Figure 30 AU Optronics Corp.: Company Snapshot
Figure 31 AU Optronics Corp.: Operating Segments
Figure 32 AU Optronics Inc. Inc: SWOT Analysis
Figure 33 Canon Inc.: Company Snapshot
Figure 34 Canon Inc.: Product Line
Figure 35 Canon Inc.: SWOT Analysis
Figure 36 Eizo Corporation: Company Snapshot
Figure 37 Eizo Corporation: Product Line
Figure 38 Eizo Corporation: SWOT Analysis
Figure 39 Innolux Corporation: Company Snapshot
Figure 40 Innolux Corporation: Product Line
Figure 41 Innolux Corporation: SWOT Analysis
Figure 42 LG Electronics: Company Snapshot
Figure 43 LG Electronics: Product Line
Figure 44 LG Electronics: SWOT Analysis
Figure 45 Marseille Networks Inc.: Product Line
Figure 46 Panasonic Corporation: Company Snapshot
Figure 47 Panasonic Corporation: Product Line
Figure 48 Panasonic Corporation: SWOT Analysis
Figure 49 Planar Systems Inc.: Company Snapshot
Figure 50 Planar Systems Inc.: Product Line
Figure 51 Planar Systems Inc.: SWOT Analysis
Figure 52 Pointgrab Ltd.: Company Snapshot
Figure 53 Pointgrab Ltd.: Software Implementation in Devices
Figure 54 Pointgrab Ltd: Software Applications
Figure 55 Red Digital Cinema Camera Company: Product Line
Figure 56 Samsung Electronics Co. Ltd.: Company Snapshot
Figure 57 Samsung Electronics: Product Line
Figure 58 Samsung Electronics Co., Ltd: SWOT Analysis
Figure 59 Sharp Corporation: Company Snapshot
Figure 60 Sharp Corporation: Product Line
Figure 61 Sharp Corporation: SWOT Analysis
Figure 62 Sony Corporation: Company Snapshot
Figure 63 Sony Corporation: Product Line
Figure 64 Sony Corporation: SWOT Analysis


Growth opportunities and latent adjacency in 4K Display Resolution Market