Ketones Market

Ketones Market by Application (Supplements, Food & Beverages, Cosmetics & Personal Care Products), Supplement Type (Ketone Salts, Ketone Esters, Ketone Oils, Raspberry Ketones), Form (Solid, Liquid, Semi- Liquid) and Region - Global Forecast to 2029

Report Code: FB 7457 Jan, 2024, by marketsandmarkets.com

The global ketones market is witnessing significant growth, with an estimated value projected to reach USD 818.9 million by 2029 from the 2024 valuation of USD 594.9 million, indicating a substantial Compound Annual Growth Rate (CAGR) of 6.6%. The rising trend of consuming supplements due to increasing health concerns and consuming additional nutrients creates an opportunity for manufacturers to attract consumers by launching new ketone-based products. Ketone-based products find profitable opportunities in various industries. The demand for healthy food and drinks, such as low-fat and low-sugar, remains high, and consumers are getting more health-conscious, which is projected to drive the demand for ketones, globally.

The ketones market has been experiencing exponential growth in recent years with the evolving industry trends, reflecting a rapidly changing dynamic landscape like that witnessed in health and wellness. Following the major trend of ketogenic diets and shifts toward lifestyles that are oriented to be healthy, the demand for ketones as supplements is increasing. This growth is propelled by awareness of the potential benefits of ketones to support cognitive function, enhanced athletic performance, and weight management. As consumers continue to search for innovative solutions that augment their well-being the ketones market is experiencing a shift with changing consumer preferences and product offerings. 
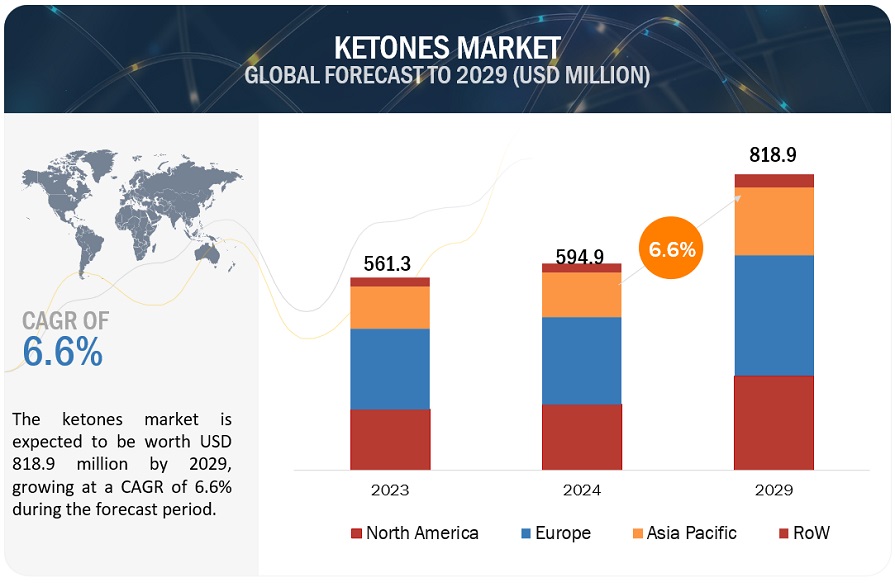
Ketones Market

To know about the assumptions considered for the study, Request for Free Sample Report

Ketones Market Opportunities

To know about the assumptions considered for the study, download the pdf brochure

Market Dynamics

Driver: Increase in new product launches

With the increase in the presence of leading players such as Perfect Keto (US) and Keto Logic (US), the ketone market is projected to witness significant growth. Key players in the market are focusing on launching various new products in the market, buoyed by the spike in consumer demand. The ketone market is propelled by consistent innovation, which is highlighted in recent flavor launches in ketone supplements. For instance, Prüvit's launched the "Prickly Pear" flavor in September 2023. Though this product is met with various mixed reviews due to its unique tartness, reflects the industry's commitment to diversity. In 2018, 80% of the new product launches were witnessed in the North American region, which is dominated by the US, whereas Europe accounted for 10% of the product launches with 30 product launches, and the Asia Pacific region accounted for 6% with 19 new product launches. The increasing research and development and new product launches is propelling the growth of the ketones market.

Restraint: Side-effects and risks associated with the consumption of ketones

Ketone supplements are not advisable to be taken by children below the age of 18 and pregnant women, as they can hurt the metabolism process. In addition, the consumption of a higher dosage of ketone food products and supplements also results in issues, such as nausea, headache, and stomach pain. This acts as a major restraint among consumers for the adoption of supplements during the initial phases of ketone supplement consumption.

Another major issue is that certain clinical trials have shown negative results, which have led consumers to doubt the actual credentials of companies that provide BHB ketone supplements. In a recent study, in 2019, it was discovered that after giving a ketones-based drink to 11 elite cyclists in Australia, the athletes performed worse, had slower times, and all of them reported upset stomachs, which contradicted the intended benefits of these products. These side effects associated with the consumption of ketone-based products is anticipated to hamper the growth of the market.

Opportunity: Increasing use of ketones to create growth opportunities for manufacturers in the beverage industry

Ketone supplements are increasingly being used in the powdered form. However, with the increasing demand for functional drinks, such as protein and other health-related drinks, the demand for keto-based drinks is also on the rise. Sports-based ketone supplements are increasingly being consumed by individuals without being on a keto-based diet. With the results showing a positive impact on the health of individuals, such as the increase in endurance levels, the demand for ketone-based drinks remains high. Key players in the ketones market are competing with research and development and the launch of new products to strengthen their position in the market. The term "drinkable ketones" refers to beverages or supplements that contain externally produced exogenous ketones. In January 2022, Health Via Modern Nutrition, a nutrition company based in the United States, launched Ketone-IQ. Which is considered as next major development in drinkable ketones, Ketone-IQ is developed to maximize metabolic states and provide advantages such as sustained energy, improved endurance and mental health, and control of appetite. The target audience includes a wide range of audiences such as military personnel, high-performing athletes, and health-conscious individuals. The enhanced demand for ketone-based drinks poses as a major opportunity for the growth of the market.

Challenges: High R&D cost and technical difficulties in the manufacturing process

The production of ketone-based food and supplements requires high investment in R&D to test the accurate mixture of ingredients that are to be used in the manufacture of products such as ketone salts and ketone esters. The manufacturing process of ketone esters is a difficult process, as the BHB is bound to precursors such as glycerol through an ester bond, which is an extremely volatile process and requires high skill levels. The binding of a BHB to a mineral such as sodium, calcium, or magnesium also requires a lot of research to get the proper formulation.  The majority of the cost related to the manufacturing of products is utilized during the testing and clinical trial phases of the product. Marketing and distribution costs also remain high, as more companies are focusing on expanding their distribution network by partnering with various e-commerce platforms.

Ketones Market Ecosystem
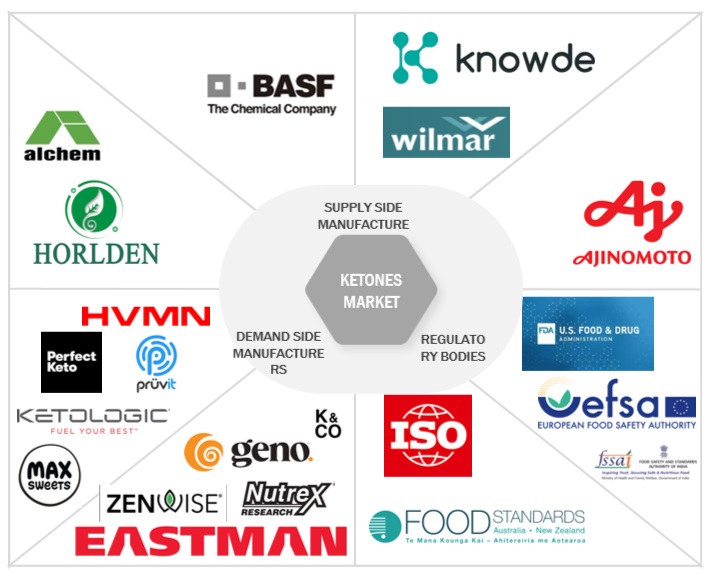
Top Companies in Ketones Market

In the type segment, the market for ketone esters is projected to grow at the highest CAGR during the forecast period.

Ketone esters are salt-free liquids that contain BHB, which is bound to precursors, such as glycerol, via an ester bond. The D-BHB monoester in HVMN Ketone increases blood ketones to exceptional levels of 3–6 mM within 30 minutes of consumption, which results in a faster ketosis process. As these esters are salt-free, they do not impact water retention and have side effects, such as high salt content. Ketone esters are mostly used in the testing phase and have shown a positive impact, which includes increased endurance, enhanced recovery, and cognitive benefits. In February 2022, polyether ether ketone (PEEK) occupied a leading position in innovative materials, due to rapid developments in the manufacturing of additives and material science. Over the years, PEEK emerged as a highly developed engineering thermoplastic, which is commended for its exceptional combination of high-temperature performance, mechanical strength, and chemical resistance. PEEK's application also extends to biomedical realms, where 3D-printed composite materials provide tailored solutions for orthopedic implants and prosthetics, highlighting the material's potential for groundbreaking developments in customized healthcare and further augmenting the growth of the market

In the application segment, food and beverages are anticipated to record the highest CAGR during the forecast period.

In food & beverage applications, ketone molecule is used to prepare ketone beverages, such as ketone drinks. Ketone boosts or supercharges the body, unlike any other source. In recent times, there has been an increasing trend among sports players and younger populations to consume energy drinks or caffeine-containing products that boost their energy and improve performance. These drinks and energy shots are gaining traction across the globe, since the younger population is perceiving their positive effects in concentration, stamina, and endurance, and ignoring the high caffeine effect, such as high dehydration due to the diuretic property, which affects their endurance. The rising awareness regarding the side effects of caffeine on the body is a major factor that is projected to increase the share of the ketone-infused food and beverages market in the future. As ketones are accustomed to the body, their consumption will not adversely affect the body. Due to these factors, they are gaining popularity in the energy drinks market.

The ketones market in the North American region is accounting for the major share during the study period

Due to the change in lifestyles, rising geriatric population, and the growth in disposable income among people, the demand for ketone supplements is growing. The North American region accounted for the largest share of the ketone supplement market. Due to the increased awareness related to health trends, the popularity of ketones remains high in the region. The increase in the elderly population has led people to spend more on nutritional food, which, in turn, is projected to create profitable growth opportunities for this market. Ketone supplements possess other functions, such as improving brain and memory, weight loss, and liver health. These functionalities have encouraged consumers to adopt ketone supplements in higher amounts, particularly ketone sales. Moreover, with the rising trend of consuming functional food, there has been an increase in the availability of ketones across restaurants and food outlets, which has further driven the growth opportunities for ketones. Moreover, the absence of stringent rules and regulations regarding ketone consumption, unlike caffeine, protein, and other macro and micronutrients, further encourages companies to enter this growing market.
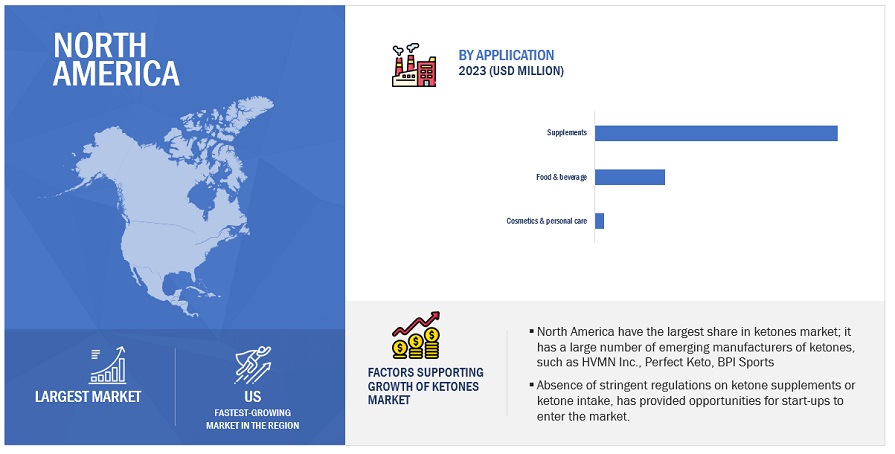
Ketones Market by Region

Key Market Players

Key players in this market include Perfect Keto Group (US), H.V.M.N. INC. (US), KetoLogic (US), Pruvit Ventures, Inc. (US), and KetoneAid (US). Companies are focusing on expanding their production facilities, entering into partnerships as well as agreements, and launching new products to grow their business and, in turn, their market share.

Want to explore hidden markets that can drive new revenue in Ketones Market?

Scope of the Report

Report Metric

Details

Market size estimation

2024–2029

Base year considered

2023

Forecast period considered

2024–2029

Units considered

Value (USD Million), Volume (Kilo Ton)

Segments Covered

Type, Form, Application, and Region 

Regions covered

North America, Europe, Asia Pacific, and RoW

Companies covered

  • Perfect Keto Group (US)
  • H.V.M.N, INC. (US)
  • Ketologic (US)
  • Pruvit Ventures, Inc. (US)
  • Ketoneaid (US)
  • Max Sweets (US)
  • Keto and Co (US)
  • Eastman Chemical Company (US)
  • Zenwise (US)
  • Nutrex Research, Inc. (US)
  • Genomatica, Inc. (US)
  • Lifesense Product (US)
  • TdeltaS Global, Inc. (US)
  • Advanced biotech (US)
  • Boli LLC(US)
  • Hunan nutramax Inc (China)
  • Real ketones (US)
  • Audacious Nutrition (US)
  • Kiss my keto. (US)
  • Taj Pharmaceuticals Limited (India)
  • Drink Kenetik (US)
  • Health Sources Nutrition co. ltd (China)
  • Ancient Brands, LLC (US)
  • Zhou Nutrition. (US)
  • Compound Solutions, Inc. (US)

Target Audience

  • Ketones manufacturers, formulators, and blenders
  • Technological and raw material providers to ketone manufacturers
  • Commercial research & development (R&D) organizations and financial institutions
  • Government departments and regulatory bodies such as the US Food and Drug Administration (FDA), European Food Safety Authority (EFSA) and Canadian Food Inspection Agency (CFIA) among others.

Ketones Market:

By Type
  • Ketone Salts
  • Ketone Esters
  • Ketone Oils
  • Raspberry Ketones
By Form
  • Solid
  • Liquid & Semi-liquid
By Application
  • Supplements
  • Food & Beverages
  • Cosmetics & Personal Care
By Region:
  • North America
  • Europe
  • Asia Pacific
  • Rest of the World (RoW)

Recent Developments

  • In June 2024, one of the major in the health and nutrition space named Intelligent Brands divested the nutraceuticals division Pruvit in a USD 107 Million Deal. Lacore and Harding, through their investment firm Adventures Capital, have now gained control of Pruvit.
  • In June 2023, Advanced Biotech launched a facility in Oneonta, New York, specially crafted to maximize energy efficiency. The facility consists of a 65,000 sq. foot warehouse, and 10,000 sq. feet of refrigeration, along with additional capabilities for spray drying and specialty chemical manufacturing. This production facility will allow the company to enhance the production of ketone-based products like Raspberry Ketone Natural, Methyl Ketone Mix 2hn Natural, Methyl Ketones Mix (Non-Dairy) Natural, and many more.
  • In April 2023, Health Via Modern Nutrition launched Ketone-IQ in all 389 Sprouts Farmers Market grocery store locations in the US. Ketone IQ is designed to health wellness demands of consumers and is available in all the major grocery stores in the functional wellness shot category in grocery stores. It is highly popular because of the affordability of the product, and the company will benefit from these grocery stores.

Frequently Asked Questions (FAQ):

To speak to our analyst for a discussion on the above findings, click Speak to Analyst

Exclusive indicates content/data unique to MarketsandMarkets and not available with any competitors.

TABLE OF CONTENTS
 
1 INTRODUCTION (Page No. - 34)
    1.1 STUDY OBJECTIVES 
    1.2 MARKET DEFINITION 
    1.3 STUDY SCOPE 
           1.3.1 MARKET SEGMENTATION
           1.3.2 REGIONS COVERED
           1.3.3 YEARS CONSIDERED
    1.4 UNITS CONSIDERED 
           1.4.1 CURRENCY CONSIDERED
                    TABLE 1 USD EXCHANGE RATES CONSIDERED, 2019–2022
           1.4.2 VOLUME UNITS
    1.5 STAKEHOLDERS 
    1.6 SUMMARY OF CHANGES 
           1.6.1 RECESSION IMPACT ANALYSIS
 
2 RESEARCH METHODOLOGY (Page No. - 39)
    2.1 RESEARCH DATA 
           FIGURE 1 KETONES MARKET: RESEARCH DESIGN
           2.1.1 SECONDARY DATA
                    2.1.1.1 Key Data from Secondary Sources
           2.1.2 PRIMARY DATA
                    2.1.2.1 Key data from secondary sources
                    2.1.2.2 Breakdown of primaries
    2.2 MARKET SIZE ESTIMATION 
           2.2.1 BOTTOM-UP APPROACH
           2.2.2 TOP-DOWN APPROACH
    2.3 DATA TRIANGULATION 
           FIGURE 2 DATA TRIANGULATION METHODOLOGY
    2.4 ASSUMPTIONS FOR THE STUDY 
    2.5 LIMITATIONS OF THE STUDY 
    2.6 RECESSION IMPACT ON KETONES MARKET 
           2.6.1 RECESSION MACRO INDICATORS
                    FIGURE 3 INDICATORS OF RECESSION
                    FIGURE 4 WORLD INFLATION RATE: 2011-2022
                    FIGURE 5 GLOBAL GDP: 2011-2022 (USD TRILLION)
                    FIGURE 6 RECESSION INDICATORS AND THEIR IMPACT ON KETONES MARKET
                    FIGURE 7 KETONES MARKET: EARLIER FORECAST VS RECESSION FORECAST
 
3 EXECUTIVE SUMMARY (Page No. - 52)
    FIGURE 8 THE SOLID SEGMENT IS PROJECTED TO DOMINATE THE KETONES MARKET THROUGHOUT 2028 
    FIGURE 9 THE KETONE SALTS SEGMENT, ON THE BASIS OF SUPPLEMENT, IS PROJECTED TO DOMINATE THE KETONES MARKET DURING THE FORECAST PERIOD 
    FIGURE 10 THE SUPPLEMENTS SEGMENT, ON THE BASIS OF APPLICATION, IS PROJECTED TO DOMINATE THE KETONES MARKET 
    FIGURE 11 ASIA PACIFIC TO BE THE FASTEST-GROWING REGION IN THE KETONES MARKET DURING THE FORECAST PERIOD 
 
4 PREMIUM INSIGHTS (Page No. - 55)
    4.1 ATTRACTIVE OPPORTUNITIES IN THE KETONES MARKET 
           FIGURE 12 INNOVATIVE PRODUCT DEVELOPMENT, EXPANDING HEALTH AWARENESS, AND GLOBAL MARKET GROWTH OFFER ATTRACTIVE OPPORTUNITIES IN KETONES.
    4.2 KETONES MARKET, BY REGION, 2023 VS. 2028 
                    FIGURE 13 NORTH AMERICA TO DOMINATE THE KETONES MARKET FROM 2023 TO 2028
    4.3 KETONES MARKET, BY SUPPLEMENT TYPE, 2023 VS. 2028 
           FIGURE 14 THE KETONE SALTS SEGMENT, ON THE BASIS OF SUPPLEMENT, IS PROJECTED TO HOLD THE LARGEST SHARE FROM 2023 TO 2028
    4.4 KETONES MARKET, BY FORM, 2023 VS. 2028 (USD MILLION) 
           FIGURE 15 THE SOLID SEGMENT IS PROJECTED TO HOLD A LARGER SHARE IN THE KETONES MARKET FROM 2023 TO 2028 (USD MILLION)
    4.5 NORTH AMERICA: KETONES MARKET, BY APPLICATION AND COUNTRY, 2022 
           FIGURE 16 THE SUPPLEMENTS SEGMENT, ON THE BASIS OF APPLICATION, ACCOUNTED FOR THE LARGEST SHARE IN THE NORTH AMERICAN KETONES MARKET
 
5 MARKET OVERVIEW (Page No. - 58)
    5.1 INTRODUCTION 
    5.2 MACROECONOMIC INDICATORS 
           5.2.1 INCREASE IN RETAIL SALES
                    FIGURE 17 RETAIL AND FOOD SERVICE SALES IN THE US, (BILLION USD)
           5.2.2 GROWTH OPPORTUNITIES IN DEVELOPING REGIONS SUCH AS ASIA PACIFIC AND SOUTH AMERICA
                    FIGURE 18 ANNUAL GDP GROWTH RATE IN ASIAN COUNTRIES, 2022
    5.3 MARKET DYNAMICS 
           FIGURE 19 KETONES MARKET DYNAMICS
           5.3.1 DRIVERS
                    5.3.1.1 Exogenous ketones support the ketosis process.
                    5.3.1.2 New product launches for keto supplements to remain high.
                    5.3.1.3 Ketones to gain prominence in the market due to their various health benefits.
           5.3.2 RESTRAINTS
                    5.3.2.1 High price of ketone supplements to inhibit the adoption in developing economies.
                    5.3.2.2 Side-effects and risks associated with the consumption of ketones.
           5.3.3 OPPORTUNITIES
                    5.3.3.1 Increasing use of ketones to create growth opportunities for manufacturers in the beverage industry.
                    5.3.3.2 High growth potential of manufacturers in markets such as Asia Pacific and South America
           5.3.4 CHALLENGES
                    5.3.4.1 High R&D cost and technical difficulties in the manufacturing process
                    5.3.4.2 Increasing focus and investment on improving the flavor of ketone products
 
6 INDUSTRY TRENDS (Page No. - 65)
    6.1 INTRODUCTION 
    6.2 VALUE CHAIN ANALYSIS 
           6.2.1 RESEARCH AND PRODUCT DEVELOPMENT
           6.2.2 RAW MATERIAL SOURCING
           6.2.3 PROCESSING AND MANUFACTURING
           6.2.4 DISTRIBUTION
           6.2.5 MARKETING & SALES
                    FIGURE 20 VALUE CHAIN ANALYSIS OF KETONES MARKET
    6.3 TECHNOLOGY ANALYSIS 
           6.3.1 CONTINUOUS KETONE MONITORING (CKM)
           6.3.2 KETOSIS BREATH ANALYZER
                    TABLE 2 PRICING ANALYSIS OF BHB KETONE SUPPLEMENTS
    6.4 MARKET MAP AND ECOSYSTEM OF KETONES 
           6.4.1 DEMAND SIDE
           6.4.2 SUPPLY SIDE
                    FIGURE 21 KETONES MARKET: MARKET MAP
                    TABLE 3 KETONES MARKET: ROLE OF PLAYERS IN MARKET ECOSYSTEM
                    FIGURE 22 KETONES: ECOSYSTEM MAPPING
    6.5 TRENDS/DISRUPTIONS IMPACTING CUSTOMERS’ BUSINESSES 
           FIGURE 23 REVENUE SHIFT FOR KETONES MARKET
    6.6 KETONES MARKET: PATENT ANALYSIS 
           FIGURE 24 NUMBER OF PATENTS GRANTED BETWEEN 2013 AND 2023
           FIGURE 25 TOP 10 INVENTORS WITH HIGHEST NUMBER OF PATENT DOCUMENTS
           FIGURE 26 LEADING APPLICANTS WITH HIGHEST NUMBER OF PATENT DOCUMENTS
           TABLE 4 PATENTS PERTAINING TO KETONES, 2022–2023
    6.7 TRADE ANALYSIS 
           6.7.1 KETONES
                    TABLE 5 TOP 10 IMPORTERS AND EXPORTERS OF KETONES, 2022 (USD THOUSAND)
    6.8 KEY CONFERENCES AND EVENTS 
           TABLE 6 KEY CONFERENCES AND EVENTS IN KETONES MARKET, 2023–2024
    6.9 TARIFF AND REGULATORY LANDSCAPE 
           6.9.1 NORTH AMERICA:
                    6.9.1.1 United States
                    6.9.1.2 Canada
                    6.9.1.3 Mexico
           6.9.2 EUROPE
                    6.9.2.1 European Union (EU)
                    6.9.2.2 United Kingdom
                    6.9.2.3 Germany
           6.9.3 ASIA PACIFIC:
                    6.9.3.1 Japan
                    6.9.3.2 China
                    6.9.3.3 Australia and New Zealand
           6.9.4 SOUTH AMERICA:
                    6.9.4.1 Brazil
                    6.9.4.2 Argentina
                    6.9.4.3 Colombia
           6.9.5 REST OF THE WORLD:
                    6.9.5.1 South Africa
                    6.9.5.2 Middle East
                               TABLE 7 NORTH AMERICA: LIST OF REGULATORY BODIES, GOVERNMENT AGENCIES, AND OTHER ORGANIZATIONS
                               TABLE 8 EUROPE: LIST OF REGULATORY BODIES, GOVERNMENT AGENCIES, AND OTHER ORGANIZATIONS
                               TABLE 9 ASIA PACIFIC: LIST OF REGULATORY BODIES, GOVERNMENT AGENCIES, AND OTHER ORGANIZATIONS
    6.1 PORTER’S FIVE FORCES ANALYSIS 
           TABLE 10 KETONES MARKET: PORTER’S FIVE FORCES ANALYSIS
           6.10.1 DEGREE OF COMPETITION
           6.10.2 BARGAINING POWER OF SUPPLIERS
           6.10.3 BARGAINING POWER OF BUYERS
           6.10.4 THREAT OF SUBSTITUTES
           6.10.5 THREAT OF NEW ENTRANTS
    6.11 KEY STAKEHOLDERS AND BUYING CRITERIA 
           6.11.1 KEY STAKEHOLDERS IN BUYING PROCESS
                    FIGURE 27 INFLUENCE OF STAKEHOLDERS IN BUYING PROCESS FOR KEY TYPES
                    TABLE 11 INFLUENCE OF STAKEHOLDERS IN BUYING PROCESS FOR TYPES OF KETONES (%)
           6.11.2 BUYING CRITERIA
                    TABLE 12 KEY CRITERIA FOR SELECTING SUPPLIER/VENDOR
                    FIGURE 28 KEY CRITERIA FOR SELECTING SUPPLIER/VENDOR
    6.12 CASE STUDY 
           6.12.1 H.V.M.N, INC. (US): DEVELOPED "KETONE-IQ," A LINE OF KETONE ESTER PRODUCTS
 
7 KETONES MARKET, BY APPLICATION (Page No. - 88)
    7.1 INTRODUCTION 
           FIGURE 29 KETONES MARKET SIZE, BY APPLICATION, 2023 VS. 2028 (TONS)
           FIGURE 30 KETONES MARKET SIZE, BY APPLICATION, 2023 VS. 2028 (USD MILLION)
           TABLE 13 KETONES MARKET, BY APPLICATION, 2019–2022 (USD MILLION)
           TABLE 14 KETONES MARKET, BY APPLICATION, 2023–2028 (USD MILLION)
           TABLE 15 KETONES MARKET, BY APPLICATION, 2019–2022 (TONS)
           TABLE 16 KETONES MARKET, BY APPLICATION, 2023–2028 (TONS)
           FIGURE 31 KETONES MARKET IN SUPPLEMENTS, BY REGION, 2023 VS. 2028 (TONS)
           FIGURE 32 KETONES MARKET IN SUPPLEMENTS, BY REGION, 2023 VS. 2028 (USD MILLION)
    7.2 SUPPLEMENTS 
           7.2.1 KETONE SUPPLEMENTS PLAY AN IMPORTANT ROLE IN SPORTS BEVERAGES, AS THEY ENHANCE THE PHYSICAL PERFORMANCE OF ATHLETES
                    TABLE 17 SUPPLEMENTS: KETONES MARKET, BY REGION, 2019–2022 (USD MILLION)
                    TABLE 18 SUPPLEMENTS: KETONES MARKET, BY REGION, 2023–2028 (USD MILLION)
                    TABLE 19 SUPPLEMENTS: KETONES MARKET, BY REGION, 2019–2022 (TONS)
                    TABLE 20 SUPPLEMENTS: KETONES MARKET, BY REGION, 2023–2028 (TONS)
    7.3 FOOD & BEVERAGES 
           7.3.1 RISING HEALTH AWARENESS AMONG CONSUMERS TO DRIVE THE DEMAND FOR KETONE-INFUSED FOOD & BEVERAGE PRODUCTS
                    TABLE 21 FOOD & BEVERAGES: KETONES MARKET, BY REGION, 2019–2022 (USD MILLION)
                    TABLE 22 FOOD & BEVERAGES: KETONES MARKET, BY REGION, 2023–2028 (USD MILLION)
                    TABLE 23 FOOD & BEVERAGES: KETONES MARKET, BY REGION, 2019–2022 (TONS)
                    TABLE 24 FOOD & BEVERAGES: KETONES MARKET, BY REGION, 2023–2028 (TONS)
    7.4 COSMETICS & PERSONAL CARE PRODUCTS 
           7.4.1 RASPBERRY KETONES FINDS INCREASING APPLICATION IN COSMETICS & PERSONAL CARE PRODUCTS DUE TO ITS VARIOUS PROPERTIES
                    TABLE 25 COSMETICS & PERSONAL CARE PRODUCTS: KETONES MARKET, BY REGION, 2019–2022 (USD MILLION)
                    TABLE 26 COSMETICS & PERSONAL CARE PRODUCTS: KETONES MARKET, BY REGION, 2023–2028 (USD MILLION)
                    TABLE 27 COSMETICS & PERSONAL CARE PRODUCTS: KETONES MARKET, BY REGION, 2019–2022 (TONS)
                    TABLE 28 COSMETICS & PERSONAL CARE PRODUCTS: KETONES MARKET, BY REGION, 2023–2028 (TONS)
 
8 KETONES MARKET, BY SUPPLEMENT TYPE (Page No. - 98)
    8.1 INTRODUCTION 
           FIGURE 33 KETONES MARKET, BY SUPPLEMENT TYPE, 2023 VS. 2028 (TONS)
           FIGURE 34 KETONES MARKET, BY SUPPLEMENT TYPE, 2023 VS. 2028 (USD MILLION)
           TABLE 29 KETONES MARKET SIZE, BY SUPPLEMENT TYPE, 2019–2022 (USD MILLION)
           TABLE 30 KETONES MARKET SIZE, BY SUPPLEMENT TYPE, 2023–2028 (USD MILLION)
           TABLE 31 KETONES MARKET SIZE, BY SUPPLEMENT TYPE, 2019–2022 (TONS)
           TABLE 32 KETONES MARKET SIZE, BY SUPPLEMENT TYPE, 2023–2028 (TONS)
           FIGURE 35 KETONE SALTS: KETONES MARKET, BY REGION, 2023 VS. 2028 (TONS)
           FIGURE 36 KETONE SALTS: KETONES MARKET, BY REGION, 2023 VS. 2028 (USD MILLION)
    8.2 KETONE SALTS 
           8.2.1 DIETARY SUPPLEMENTS ARE THE MOST PREFERRED APPLICATION FOR KETONE SALTS
                    TABLE 33 KETONE SALTS: KETONES MARKET, BY REGION, 2019–2022 (USD MILLION)
                    TABLE 34 KETONE SALTS: KETONES MARKET, BY REGION, 2023–2028 (USD MILLION)
                    TABLE 35 KETONE SALTS: KETONES MARKET, BY REGION, 2019–2022 (TONS)
                    TABLE 36 KETONE SALTS: KETONES MARKET, BY REGION, 2023–2028 (TONS)
    8.3 KETONE ESTERS 
           8.3.1 BEING A PREMIUM PRODUCT, ADOPTION OF THESE PRODUCTS IS LIMITED
                    TABLE 37 KETONE ESTERS: KETONES MARKET, BY REGION, 2019–2022 (USD MILLION)
                    TABLE 38 KETONE ESTERS: KETONES MARKET, BY REGION, 2023–2028 (USD MILLION)
                    TABLE 39 KETONE ESTERS: KETONES MARKET, BY REGION, 2019–2022 (TONS)
                    TABLE 40 KETONE ESTERS: KETONES MARKET, BY REGION, 2023–2028 (TONS)
    8.4 KETONE OILS 
           8.4.1 DEMAND FOR KETONE OIL HAS BEEN GROWING IN FOOD & BEVERAGES
                    TABLE 41 KETONE OILS: KETONES MARKET, BY REGION, 2019–2022 (USD MILLION)
                    TABLE 42 KETONE OILS: KETONES MARKET, BY REGION, 2023–2028 (USD MILLION)
                    TABLE 43 KETONE OILS: KETONES MARKET, BY REGION, 2019–2022 (TONS)
                    TABLE 44 KETONE OILS: KETONES MARKET, BY REGION, 2023–2028 (TONS)
    8.5 RASPBERRY KETONES 
           8.5.1 COSMETIC INDUSTRY HAS BEEN ON THE APPLICATION OF RASPBERRY KETONES
                    TABLE 45 RASPBERRY KETONES: KETONES MARKET, BY REGION, 2019–2022 (USD MILLION)
                    TABLE 46 RASPBERRY KETONES: KETONES MARKET, BY REGION, 2023–2028 (USD MILLION)
                    TABLE 47 RASPBERRY KETONES: KETONES MARKET, BY REGION, 2019–2022 (TONS)
                    TABLE 48 RASPBERRY KETONES: KETONES MARKET, BY REGION, 2023–2028 (TONS)
 
9 KETONES MARKET, BY FORM (Page No. - 111)
    9.1 INTRODUCTION 
           FIGURE 37 KETONES MARKET SIZE, BY FORM, 2023 VS. 2028 (TONS)
           FIGURE 38 KETONES MARKET SIZE, BY FORM, 2023 VS. 2028 (USD MILLION)
           TABLE 49 KETONES MARKET, BY FORM, 2019–2022 (USD MILLION)
           TABLE 50 KETONES MARKET, BY FORM, 2023–2028 (USD MILLION)
           TABLE 51 KETONES MARKET, BY FORM, 2019–2022 (TONS)
           TABLE 52 KETONES MARKET, BY FORM, 2023–2028 (TONS)
    9.2 SOLID 
           9.2.1 SOLID IS THE MOST PREFERRED FORMULATION FOR KETONES PRODUCTS OWING TO STORAGE PROPERTIES
                    FIGURE 39 SOLID KETONES MARKET SIZE, BY REGION, 2023 VS. 2028 (TONS)
                    FIGURE 40 SOLID KETONES MARKET, BY REGION, 2023 VS. 2028 (USD MILLION)
                    TABLE 53 SOLID FORM: KETONES MARKET, BY REGION, 2019–2022 (USD MILLION)
                    TABLE 54 SOLID FORM: KETONES MARKET, BY REGION, 2023–2028 (USD MILLION)
                    TABLE 55 SOLID FORM: KETONES MARKET, BY REGION, 2019–2022 (TONS)
                    TABLE 56 SOLID FORM: KETONES MARKET, BY REGION, 2023–2028 (TONS)
    9.3 LIQUID AND SEMI-LIQUID 
           9.3.1 LIQUID IS THE PUREST AND FASTEST METABOLIZING FORM OF KETONE
                    TABLE 57 LIQUID AND SEMI-LIQUID FORM: KETONES MARKET, BY REGION, 2019–2022 (USD MILLION)
                    TABLE 58 LIQUID AND SEMI-LIQUID FORM: KETONES MARKET, BY REGION, 2023–2028 (USD MILLION)
                    TABLE 59 LIQUID AND SEMI-LIQUID FORM: KETONES MARKET, BY REGION, 2019–2022 (TONS)
                    TABLE 60 LIQUID AND SEMI-LIQUID FORM: KETONES MARKET, BY REGION, 2023–2028 (TONS)
 
10 KETONES MARKET, BY REGION (Page No. - 119)
     10.1 INTRODUCTION 
               FIGURE 41 CHINA LEADS AS THE FASTEST-GROWING MARKET IN THE FORECASTED PERIOD.
               TABLE 61 KETONES MARKET, BY REGION, 2019–2022 (USD MILLION)
               TABLE 62 KETONES MARKET, BY REGION, 2023–2028 (USD MILLION)
               TABLE 63 KETONES MARKET, BY REGION, 2019–2022 (TONS)
               TABLE 64 KETONES MARKET, BY REGION, 2023–2028 (TONS)
     10.2 NORTH AMERICA 
             10.2.1 NORTH AMERICA: RECESSION IMPACT ANALYSIS
                       FIGURE 42 INFLATION: COUNTRY-LEVEL DATA (2017-2022)
                       FIGURE 43 NORTH AMERICA KETONES MARKET: RECESSION IMPACT ANALYSIS
                       FIGURE 44 NORTH AMERICA: KETONES MARKET SNAPSHOT, 2022
                       TABLE 65 NORTH AMERICA: KETONES MARKET, BY COUNTRY, 2019–2022 (USD MILLION)
                       TABLE 66 NORTH AMERICA: KETONES MARKET, BY COUNTRY, 2023–2028 (USD MILLION)
                       TABLE 67 NORTH AMERICA: KETONES MARKET, BY COUNTRY, 2019–2022 (TONS)
                       TABLE 68 NORTH AMERICA: KETONES MARKET, BY COUNTRY, 2023–2028 (TONS)
                       TABLE 69 NORTH AMERICA: KETONES MARKET, BY FORM, 2019–2022 (USD MILLION)
                       TABLE 70 NORTH AMERICA: KETONES MARKET, BY FORM, 2023–2028 (USD MILLION)
                       TABLE 71 NORTH AMERICA: KETONES MARKET, BY FORM, 2019–2022 (TONS)
                       TABLE 72 NORTH AMERICA: KETONES MARKET, BY FORM, 2023–2028 (TONS)
                       TABLE 73 NORTH AMERICA: KETONES MARKET, BY APPLICATION, 2019–2022 (USD MILLION)
                       TABLE 74 NORTH AMERICA: KETONES MARKET, BY APPLICATION, 2023–2028 (USD MILLION)
                       TABLE 75 NORTH AMERICA: KETONES MARKET, BY APPLICATION, 2019–2022 (TONS)
                       TABLE 76 NORTH AMERICA: KETONES MARKET, BY APPLICATION, 2023–2028 (TONS)
                       TABLE 77 NORTH AMERICA: KETONES MARKET, BY SUPPLEMENT TYPE, 2019–2022 (USD MILLION)
                       TABLE 78 NORTH AMERICA: KETONES MARKET, BY SUPPLEMENT TYPE, 2023–2028 (USD MILLION)
                       TABLE 79 NORTH AMERICA: KETONES MARKET, BY SUPPLEMENT TYPE, 2019–2022 (TONS)
                       TABLE 80 NORTH AMERICA: KETONES MARKET, BY SUPPLEMENT TYPE, 2023–2028 (TONS)
             10.2.2 US
                       10.2.2.1 The availability of innovative ketone-based food products in food outlets, restaurants, and local stores to drive the ketones market in the US.
                                   TABLE 81 US: KETONES MARKET, BY APPLICATION, 2019–2022 (USD MILLION)
                                   TABLE 82 US: KETONES MARKET, BY APPLICATION, 2023–2028 (USD MILLION)
                                   TABLE 83 US: KETONES MARKET, BY APPLICATION, 2019–2022 (TONS)
                                   TABLE 84 US: KETONES MARKET, BY APPLICATION, 2023–2028 (TONS)
                                   TABLE 85 US: KETONES MARKET, BY SUPPLEMENT TYPE, 2019–2022 (USD MILLION)
                                   TABLE 86 US: KETONES MARKET, BY SUPPLEMENT TYPE, 2023–2028 (USD MILLION)
             10.2.3 CANADA
                       10.2.3.1 Local Players to Dominate the Ketones market in the Country.
                                   TABLE 87 CANADA: KETONES MARKET, BY APPLICATION, 2019–2022 (USD MILLION)
                                   TABLE 88 CANADA: KETONES MARKET, BY APPLICATION, 2023–2028 (USD MILLION)
                                   TABLE 89 CANADA: KETONES MARKET, BY APPLICATION, 2019–2022 (TONS)
                                   TABLE 90 CANADA: KETONES MARKET, BY APPLICATION, 2023–2028 (TONS)
                                   TABLE 91 CANADA: KETONES MARKET, BY SUPPLEMENT TYPE, 2019–2022 (USD MILLION)
                                   TABLE 92 CANADA: KETONES MARKET, BY SUPPLEMENT TYPE, 2023–2028 (USD MILLION)
             10.2.4 MEXICO
                       10.2.4.1 Social media to encourage the demand for ketone-based products in Mexico.
                                   TABLE 93 MEXICO: KETONES MARKET, BY APPLICATION, 2019–2022 (USD MILLION)
                                   TABLE 94 MEXICO: KETONES MARKET, BY APPLICATION, 2023–2028 (USD MILLION)
                                   TABLE 95 MEXICO: KETONES MARKET, BY APPLICATION, 2019–2022 (TONS)
                                   TABLE 96 MEXICO: KETONES MARKET, BY APPLICATION, 2023–2028 (TONS)
                                   TABLE 97 MEXICO: KETONES MARKET, BY SUPPLEMENT TYPE, 2019–2022 (USD MILLION)
                                   TABLE 98 MEXICO: KETONES MARKET, BY SUPPLEMENT TYPE, 2023–2028 (USD MILLION)
     10.3 EUROPE 
             10.3.1 RECESSION IMPACT ANALYSIS
                       FIGURE 45 INFLATION: COUNTRY-LEVEL DATA (2017-2022)
                       FIGURE 46 EUROPE: KETONES MARKET: RECESSION IMPACT ANALYSIS
                       FIGURE 47 EUROPE: KETONES MARKET SNAPSHOT, 2022
                       TABLE 99 EUROPE: KETONES MARKET, BY COUNTRY, 2019–2022 (USD MILLION)
                       TABLE 100 EUROPE: KETONES MARKET, BY COUNTRY, 2023–2028 (USD MILLION)
                       TABLE 101 EUROPE: KETONES MARKET, BY COUNTRY, 2019–2022 (TONS)
                       TABLE 102 EUROPE: KETONES MARKET, BY COUNTRY, 2023–2028 (TONS)
                       TABLE 103 EUROPE: KETONES MARKET, BY FORM, 2019–2022 (USD MILLION)
                       TABLE 104 EUROPE: KETONES MARKET, BY FORM, 2023–2028 (USD MILLION)
                       TABLE 105 EUROPE: KETONES MARKET, BY FORM, 2019–2022 (TONS)
                       TABLE 106 EUROPE: KETONES MARKET, BY FORM, 2023–2028 (TONS)
                       TABLE 107 EUROPE: KETONES MARKET, BY APPLICATION, 2019–2022 (USD MILLION)
                       TABLE 108 EUROPE: KETONES MARKET, BY APPLICATION, 2023–2028 (USD MILLION)
                       TABLE 109 EUROPE: KETONES MARKET, BY APPLICATION, 2019–2022 (TONS)
                       TABLE 110 EUROPE: KETONES MARKET, BY APPLICATION, 2023–2028 (TONS)
                       TABLE 111 EUROPE: KETONES MARKET, BY SUPPLEMENT TYPE, 2019–2022 (USD MILLION)
                       TABLE 112 EUROPE: KETONES MARKET, BY SUPPLEMENT TYPE, 2023–2028 (USD MILLION)
                       TABLE 113 EUROPE: KETONES MARKET, BY SUPPLEMENT TYPE, 2019–2022 (TONS)
                       TABLE 114 EUROPE: KETONES MARKET, BY SUPPLEMENT TYPE, 2023–2028 (TONS)
             10.3.2 GERMANY
                       10.3.2.1 Ketones are rapidly replacing caffeine in energy drinks due to their side-effects on health.
                                   TABLE 115 GERMANY: KETONES MARKET, BY APPLICATION, 2019–2022 (USD MILLION)
                                   TABLE 116 GERMANY: KETONES MARKET, BY APPLICATION, 2023–2028 (USD MILLION)
                                   TABLE 117 GERMANY: KETONES MARKET, BY APPLICATION, 2019–2022 (TONS)
                                   TABLE 118 GERMANY: KETONES MARKET, BY APPLICATION, 2023–2028 (TONS)
                                   TABLE 119 GERMANY: KETONES MARKET, BY SUPPLEMENT TYPE, 2019–2022 (USD MILLION)
                                   TABLE 120 GERMANY: KETONES MARKET, BY SUPPLEMENT TYPE, 2023–2028 (USD MILLION)
             10.3.3 FRANCE
                       10.3.3.1 France imports and exports ketones, fostering regional collaboration and market participation.
                                   TABLE 121 FRANCE: KETONES MARKET, BY APPLICATION, 2019–2022 (USD MILLION)
                                   TABLE 122 FRANCE: KETONES MARKET, BY APPLICATION, 2023–2028 (USD MILLION)
                                   TABLE 123 FRANCE: KETONES MARKET, BY APPLICATION, 2019–2022 (TONS)
                                   TABLE 124 FRANCE: KETONES MARKET, BY APPLICATION, 2023–2028 (TONS)
                                   TABLE 125 FRANCE: KETONES MARKET, BY SUPPLEMENT TYPE, 2019–2022 (USD MILLION)
                                   TABLE 126 FRANCE: KETONES MARKET, BY SUPPLEMENT TYPE, 2023–2028 (USD MILLION)
             10.3.4 ITALY
                       10.3.4.1 High caffeine levels in the diet simultaneously increase health risks, due to which ketones are replacing caffeine in energy drinks.
                                   TABLE 127 ITALY: KETONES MARKET, BY APPLICATION, 2019–2022 (USD MILLION)
                                   TABLE 128 ITALY: KETONES MARKET, BY APPLICATION, 2023–2028 (USD MILLION)
                                   TABLE 129 ITALY: KETONES MARKET, BY APPLICATION, 2019–2022 (TONS)
                                   TABLE 130 ITALY: KETONES MARKET, BY APPLICATION, 2023–2028 (TONS)
                                   TABLE 131 ITALY: KETONES MARKET, BY SUPPLEMENT TYPE, 2019–2022 (USD MILLION)
                                   TABLE 132 ITALY: KETONES MARKET, BY SUPPLEMENT TYPE, 2023–2028 (USD MILLION)
             10.3.5 UK
                       10.3.5.1 UK government regulations on caffeine-rich products create opportunities for ketone-based beverages.
                                   TABLE 133 UK: KETONES MARKET, BY APPLICATION, 2019–2022 (USD MILLION)
                                   TABLE 134 UK: KETONES MARKET, BY APPLICATION, 2023–2028 (USD MILLION)
                                   TABLE 135 UK: KETONES MARKET, BY APPLICATION, 2019–2022 (TONS)
                                   TABLE 136 UK: KETONES MARKET, BY APPLICATION, 2023–2028 (TONS)
                                   TABLE 137 UK: KETONES MARKET, BY SUPPLEMENT TYPE, 2019–2022 (USD MILLION)
                                   TABLE 138 UK: KETONES MARKET, BY SUPPLEMENT TYPE, 2023–2028 (USD MILLION)
             10.3.6 THE NETHERLANDS
                       10.3.6.1 Ketone-infused supplements have improved the performance of athletes.
                                   TABLE 139 NETHERLANDS: KETONES MARKET, BY APPLICATION, 2019–2022 (USD MILLION)
                                   TABLE 140 NETHERLANDS: KETONES MARKET, BY APPLICATION, 2023–2028 (USD MILLION)
                                   TABLE 141 NETHERLANDS: KETONES MARKET, BY APPLICATION, 2019–2022 (TONS)
                                   TABLE 142 NETHERLANDS: KETONES MARKET, BY APPLICATION, 2023–2028 (TONS)
                                   TABLE 143 NETHERLANDS: KETONES MARKET, BY SUPPLEMENT TYPE, 2019–2022 (USD MILLION)
                                   TABLE 144 NETHERLANDS: KETONES MARKET, BY SUPPLEMENT TYPE, 2023–2028 (USD MILLION)
             10.3.7 REST OF EUROPE
                       TABLE 145 REST OF EUROPE: KETONES MARKET, BY APPLICATION, 2019–2022 (USD MILLION)
                       TABLE 146 REST OF EUROPE: KETONES MARKET, BY APPLICATION, 2023–2028 (USD MILLION)
                       TABLE 147 REST OF EUROPE: KETONES MARKET, BY APPLICATION, 2019–2022 (TONS)
                       TABLE 148 REST OF EUROPE: KETONES MARKET, BY APPLICATION, 2023–2028 (TONS)
                       TABLE 149 REST OF EUROPE: KETONES MARKET, BY SUPPLEMENT TYPE, 2019–2022 (USD MILLION)
                       TABLE 150 REST OF EUROPE: KETONES MARKET, BY SUPPLEMENT TYPE, 2023–2028 (USD MILLION)
     10.4 ASIA PACIFIC 
             10.4.1 ASIA PACIFIC: RECESSION IMPACT ANALYSIS
                       FIGURE 48 INFLATION: COUNTRY-LEVEL DATA (2017-2022)
                       FIGURE 49 ASIA PACIFIC KETONES MARKET: RECESSION IMPACT ANALYSIS
                       TABLE 151 ASIA PACIFIC: KETONES MARKET, BY COUNTRY, 2019–2022 (USD MILLION)
                       TABLE 152 ASIA PACIFIC: KETONES MARKET, BY COUNTRY, 2023–2028 (USD MILLION)
                       TABLE 153 ASIA PACIFIC: KETONES MARKET, BY COUNTRY, 2019–2022 (TONS)
                       TABLE 154 ASIA PACIFIC: KETONES MARKET, BY COUNTRY, 2023–2028 (TONS)
                       TABLE 155 ASIA PACIFIC: KETONES MARKET, BY APPLICATION, 2019–2022 (USD MILLION)
                       TABLE 156 ASIA PACIFIC: KETONES MARKET, BY APPLICATION, 2023–2028 (USD MILLION)
                       TABLE 157 ASIA PACIFIC: KETONES MARKET, BY APPLICATION, 2019–2022 (TONS)
                       TABLE 158 ASIA PACIFIC: KETONES MARKET, BY APPLICATION, 2023–2028 (TONS)
                       TABLE 159 ASIA PACIFIC: KETONES MARKET, BY SUPPLEMENT TYPE, 2019–2022 (USD MILLION)
                       TABLE 160 ASIA PACIFIC: KETONES MARKET, BY SUPPLEMENT TYPE, 2023–2028 (USD MILLION)
                       TABLE 161 ASIA PACIFIC: KETONES MARKET, BY SUPPLEMENT TYPE, 2019–2022 (TONS)
                       TABLE 162 ASIA PACIFIC: KETONES MARKET, BY SUPPLEMENT TYPE, 2023–2028 (TONS)
                       TABLE 163 ASIA PACIFIC: KETONES MARKET, BY FORM, 2019–2022 (USD MILLION)
                       TABLE 164 ASIA PACIFIC: KETONES MARKET, BY FORM, 2023–2028 (USD MILLION)
                       TABLE 165 ASIA PACIFIC: KETONES MARKET, BY FORM, 2019–2022 (TONS)
                       TABLE 166 ASIA PACIFIC: KETONES MARKET, BY FORM, 2023–2028 (TONS)
             10.4.2 CHINA
                       10.4.2.1 The market for ketone supplements in China is extremely fragmented with generic players.
                                   TABLE 167 CHINA: KETONES MARKET, BY APPLICATION, 2019–2022 (USD MILLION)
                                   TABLE 168 CHINA: KETONES MARKET, BY APPLICATION, 2023–2028 (USD MILLION)
                                   TABLE 169 CHINA: KETONES MARKET, BY APPLICATION, 2019–2022 (TONS)
                                   TABLE 170 CHINA: KETONES MARKET, BY APPLICATION, 2023–2028 (TONS)
                                   TABLE 171 CHINA: KETONES MARKET, BY SUPPLEMENT TYPE, 2019–2022 (USD MILLION)
                                   TABLE 172 CHINA: KETONES MARKET, BY SUPPLEMENT TYPE, 2023–2028 (USD MILLION)
             10.4.3 INDIA
                       10.4.3.1 Keto diet in India has been gaining popularity, which creates an opportunity for ketone-based products.
                                   TABLE 173 INDIA: KETONES MARKET, BY APPLICATION, 2019–2022 (USD MILLION)
                                   TABLE 174 INDIA: KETONES MARKET, BY APPLICATION, 2023–2028 (USD MILLION)
                                   TABLE 175 INDIA: KETONES MARKET, BY APPLICATION, 2019–2022 (TONS)
                                   TABLE 176 INDIA: KETONES MARKET, BY APPLICATION, 2023–2028 (TONS)
                                   TABLE 177 INDIA: KETONES MARKET, BY SUPPLEMENT TYPE, 2019–2022 (USD MILLION)
                                   TABLE 178 INDIA: KETONES MARKET, BY SUPPLEMENT TYPE, 2023–2028 (USD MILLION)
             10.4.4 AUSTRALIA & NEW ZEALAND
                       10.4.4.1 US-based ketone manufacturers have been expanding in this region.
                                   TABLE 179 AUSTRALIA & NEW ZEALAND: KETONES MARKET, BY APPLICATION, 2019–2022 (USD MILLION)
                                   TABLE 180 AUSTRALIA & NEW ZEALAND: KETONES MARKET, BY APPLICATION, 2023–2028 (USD MILLION)
                                   TABLE 181 AUSTRALIA & NEW ZEALAND: KETONES MARKET, BY APPLICATION, 2019–2022 (TONS)
                                   TABLE 182 AUSTRALIA & NEW ZEALAND: KETONES MARKET, BY APPLICATION, 2023–2028 (TONS)
                                   TABLE 183 AUSTRALIA & NEW ZEALAND: KETONES MARKET, BY SUPPLEMENT TYPE, 2019–2022 (USD MILLION)
                                   TABLE 184 AUSTRALIA & NEW ZEALAND: KETONES MARKET, BY SUPPLEMENT TYPE, 2023–2028 (USD MILLION)
             10.4.5 JAPAN
                       10.4.5.1 Premium cosmetic products are highly adopted in the country, and hence ketone-based cosmetic products have huge opportunities for growth.
                                   TABLE 185 JAPAN: KETONES MARKET, BY APPLICATION, 2019–2022 (USD MILLION)
                                   TABLE 186 JAPAN: KETONES MARKET, BY APPLICATION, 2023–2028 (USD MILLION)
                                   TABLE 187 JAPAN: KETONES MARKET, BY APPLICATION, 2019–2022 (TONS)
                                   TABLE 188 JAPAN: KETONES MARKET, BY APPLICATION, 2023–2028 (TONS)
                                   TABLE 189 JAPAN: KETONES MARKET, BY SUPPLEMENT TYPE, 2019–2022 (USD MILLION)
                                   TABLE 190 JAPAN: KETONES MARKET, BY SUPPLEMENT TYPE, 2023–2028 (USD MILLION)
             10.4.6 REST OF ASIA PACIFIC
                       TABLE 191 REST OF ASIA PACIFIC: KETONES MARKET, BY APPLICATION, 2019–2022 (USD MILLION)
                       TABLE 192 REST OF ASIA PACIFIC: KETONES MARKET, BY APPLICATION, 2023–2028 (USD MILLION)
                       TABLE 193 REST OF ASIA PACIFIC: KETONES MARKET, BY APPLICATION, 2019–2022 (TONS)
                       TABLE 194 REST OF ASIA PACIFIC: KETONES MARKET, BY APPLICATION, 2023–2028 (TONS)
                       TABLE 195 REST OF ASIA PACIFIC: KETONES MARKET, BY SUPPLEMENT TYPE, 2019–2022 (USD MILLION)
                       TABLE 196 REST OF ASIA PACIFIC: KETONES MARKET, BY SUPPLEMENT TYPE, 2023–2028 (USD MILLION)
     10.5 REST OF THE WORLD (ROW) 
             10.5.1 REST OF THE WORLD: RECESSION IMPACT ANALYSIS
                       FIGURE 50 INFLATION: COUNTRY-LEVEL DATA (2017-2022)
                       FIGURE 51 REST OF THE WORLD KETONES MARKET: RECESSION IMPACT ANALYSIS
                       TABLE 197 REST OF THE WORLD: KETONES MARKET, BY COUNTRY, 2019–2022 (USD MILLION)
                       TABLE 198 REST OF THE WORLD: KETONES MARKET, BY COUNTRY, 2023–2028 (USD MILLION)
                       TABLE 199 REST OF THE WORLD: KETONES MARKET, BY COUNTRY, 2019–2022 (TONS)
                       TABLE 200 REST OF THE WORLD: KETONES MARKET, BY COUNTRY, 2023–2028 (TONS)
                       TABLE 201 REST OF THE WORLD: KETONES MARKET, BY APPLICATION, 2019–2022 (USD MILLION)
                       TABLE 202 REST OF THE WORLD: KETONES MARKET, BY APPLICATION, 2023–2028 (USD MILLION)
                       TABLE 203 REST OF THE WORLD: KETONES MARKET, BY APPLICATION, 2019–2022 (TONS)
                       TABLE 204 REST OF THE WORLD: KETONES MARKET, BY APPLICATION, 2023–2028 (TONS)
                       TABLE 205 REST OF THE WORLD: KETONES MARKET, BY SUPPLEMENT TYPE, 2019–2022 (USD MILLION)
                       TABLE 206 REST OF THE WORLD: KETONES MARKET, BY SUPPLEMENT TYPE, 2023–2028 (USD MILLION)
                       TABLE 207 REST OF THE WORLD: KETONES MARKET, BY SUPPLEMENT TYPE, 2019–2022 (TONS)
                       TABLE 208 REST OF THE WORLD: KETONES MARKET, BY SUPPLEMENT TYPE, 2023–2028 (TONS)
                       TABLE 209 REST OF THE WORLD: KETONES MARKET, BY FORM, 2019–2022 (USD MILLION)
                       TABLE 210 REST OF THE WORLD: KETONES MARKET, BY FORM, 2023–2028 (USD MILLION)
                       TABLE 211 REST OF THE WORLD: KETONES MARKET, BY FORM, 2019–2022 (TONS)
                       TABLE 212 REST OF THE WORLD: KETONES MARKET, BY FORM, 2023–2028 (TONS)
             10.5.2 SOUTH AMERICA
                       10.5.2.1 Close proximity to the US can accelerate the awareness of ketone-based products in Brazil and Argentina
                                   TABLE 213 SOUTH AMERICA: KETONES MARKET, BY APPLICATION, 2019–2022 (USD MILLION)
                                   TABLE 214 SOUTH AMERICA: KETONES MARKET, BY APPLICATION, 2023–2028 (USD MILLION)
                                   TABLE 215 SOUTH AMERICA: KETONES MARKET, BY APPLICATION, 2019–2022 (TONS)
                                   TABLE 216 SOUTH AMERICA: KETONES MARKET, BY APPLICATION, 2023–2028 (TONS)
                                   TABLE 217 SOUTH AMERICA: KETONES MARKET, BY SUPPLEMENT TYPE, 2019–2022 (USD MILLION)
                                   TABLE 218 SOUTH AMERICA: KETONES MARKET, BY SUPPLEMENT TYPE, 2023–2028 (USD MILLION)
             10.5.3 MIDDLE EAST & AFRICA
                       10.5.3.1 Unfavorable economic conditions can hinder the adoption of ketone-based products
                                   TABLE 219 MIDDLE EAST & AFRICA: KETONES MARKET, BY APPLICATION, 2019–2022 (USD MILLION)
                                   TABLE 220 MIDDLE EAST & AFRICA: KETONES MARKET, BY APPLICATION, 2023–2028 (USD MILLION)
                                   TABLE 221 MIDDLE EAST & AFRICA: KETONES MARKET, BY APPLICATION, 2019–2022 (TONS)
                                   TABLE 222 MIDDLE EAST & AFRICA: KETONES MARKET, BY APPLICATION, 2023–2028 (TONS)
                                   TABLE 223 MIDDLE EAST & AFRICA: KETONES MARKET, BY SUPPLEMENT TYPE, 2019–2022 (USD MILLION)
                                   TABLE 224 MIDDLE EAST & AFRICA: KETONES MARKET, BY SUPPLEMENT TYPE, 2023–2028 (USD MILLION)
 
11 COMPETITIVE LANDSCAPE (Page No. - 186)
     11.1 OVERVIEW 
     11.2 MARKET SHARE ANALYSIS, 2022 
               TABLE 225 GLOBAL KETONES MARKET: DEGREE OF COMPETITION
     11.3 KEY PLAYERS STRATEGIES/RIGHT TO WIN 
               TABLE 226 STRATEGIES ADOPTED BY KEY KETONES MANUFACTURERS
     11.4 REVENUE ANALYSIS 
               TABLE 227 REVENUE ANALYSIS (RANKING) OF KEY PLAYERS, 2018–2022
     11.5 GLOBAL SNAPSHOT OF KEY MARKET PARTICIPANTS 
               FIGURE 52 KETONES: GLOBAL SNAPSHOT OF KEY PARTICIPANTS, 2022
     11.6 COMPANY EVALUATION MATRIX (KEY PLAYERS), 2022 
             11.6.1 STARS
             11.6.2 EMERGING LEADERS
             11.6.3 PERVASIVE PLAYERS
             11.6.4 PARTICIPANTS
                       FIGURE 53 KETONES MARKET: COMPANY EVALUATION QUADRANT, 2022 (KEY PLAYERS)
             11.6.5 COMPANY FOOTPRINT (KEY PLAYERS)
                       TABLE 228 COMPANY FOOTPRINT, BY TYPE (KEY PLAYERS)
                       TABLE 229 COMPANY FOOTPRINT, BY FORM (KEY PLAYERS)
                       TABLE 230 COMPANY FOOTPRINT, BY APPLICATION (KEY PLAYERS)
                       TABLE 231 COMPANY FOOTPRINT, BY REGION (KEY PLAYERS)
                       TABLE 232 COMPETITIVE BENCHMARKING (KEY PLAYERS)
     11.7 KETONES MARKET: START-UP/SME EVALUATION MATRIX, 2022 
             11.7.1 PROGRESSIVE COMPANIES
             11.7.2 RESPONSIVE COMPANIES
             11.7.3 DYNAMIC COMPANIES
             11.7.4 STARTING BLOCKS
                       FIGURE 54 KETONES MARKET: COMPANY EVALUATION QUADRANT, 2022 (STARTUPS/SMES)
             11.7.5 COMPETITIVE BENCHMARKING
                       TABLE 233 GLOBAL KETONES MARKET: DETAILED LIST OF KEY START-UPS/SMES
                       TABLE 234 KETONES MARKET: COMPETITIVE BENCHMARKING OF KEY STARTUPS/SMES
     11.8 COMPETITIVE SCENARIO AND TRENDS 
             11.8.1 PRODUCT LAUNCHES
                       TABLE 235 KETONES MARKET: NEW PRODUCT LAUNCHES, 2019–2023
             11.8.2 DEALS
                       TABLE 236 KETONES MARKET: DEALS, 2019–2022
             11.8.3 OTHERS
                       TABLE 237 KETONES MARKET: OTHERS, 2019–2022
 
12 COMPANY PROFILES (Page No. - 203)
(Business Overview, Products/Services/Solutions Offered, Recent Developments, and MnM View (Key strengths/Right to Win, Strategic Choices Made, and Weaknesses and Competitive Threats))*
     12.1 KEY PLAYERS 
             12.1.1 PERFECT KETO GROUP
                       TABLE 238 PERFECT KETO GROUP: BUSINESS OVERVIEW
                       TABLE 239 PERFECT KETO GROUP: PRODUCTS/SERVICES/SOLUTIONS OFFERED
                       TABLE 240 PERFECT KETO GROUP: DEALS
             12.1.2 H.V.M.N. INC.
                       TABLE 241 H.V.M.N. INC.: BUSINESS OVERVIEW
                       TABLE 242 H.V.M.N. INC.: PRODUCTS/SERVICES/SOLUTIONS OFFERED
                       TABLE 243 H.V.M.N. INC.: PRODUCT LAUNCHES
                       TABLE 244 H.V.M.N. INC.: OTHERS
             12.1.3 KETOLOGIC
                       TABLE 245 KETOLOGIC: BUSINESS OVERVIEW
                       TABLE 246 KETOLOGIC: PRODUCTS/SERVICES/SOLUTIONS OFFERED
                       TABLE 247 KETOLOGIC: OTHERS
             12.1.4 PRUVIT VENTURES, INC.
                       TABLE 248 PRUVIT VENTURES, INC.: BUSINESS OVERVIEW
                       TABLE 249 PRUVIT VENTURES, INC.: PRODUCTS/SERVICES/SOLUTIONS OFFERED
                       TABLE 250 PRUVIT VENTURES, INC.: DEALS
             12.1.5 KETONEAID.
                       TABLE 251 KETONEAID.: BUSINESS OVERVIEW
                       TABLE 252 KETONEAID.: PRODUCTS/SERVICES/SOLUTIONS OFFERED
             12.1.6 MAX SWEETS
                       TABLE 253 MAX SWEETS: BUSINESS OVERVIEW
                       TABLE 254 MAX SWEETS: PRODUCTS/SERVICES/SOLUTIONS OFFERED
                       TABLE 255 MAX SWEETS: OTHERS
             12.1.7 KETO AND CO
                       TABLE 256 KETO AND CO: BUSINESS OVERVIEW
                       TABLE 257 KETO AND CO: PRODUCTS/SERVICES/SOLUTIONS OFFERED
             12.1.8 EASTMAN CHEMICAL COMPANY
                       TABLE 258 EASTMAN CHEMICAL COMPANY: BUSINESS OVERVIEW
                       FIGURE 55 EASTMAN CHEMICAL COMPANY: COMPANY SNAPSHOT
                       TABLE 259 EASTMAN CHEMICAL COMPANY: PRODUCTS/SERVICES/SOLUTIONS OFFERED
             12.1.9 ZENWISE
                       TABLE 260 ZENWISE: BUSINESS OVERVIEW
                       TABLE 261 ZENWISE: PRODUCTS/SERVICES/SOLUTIONS OFFERED
                       TABLE 262 ZENWISE: PRODUCT LAUNCHES
             12.1.10 NUTREX RESEARCH, INC.
                       TABLE 263 NUTREX RESEARCH, INC.: BUSINESS OVERVIEW
                       TABLE 264 NUTREX RESEARCH, INC.: PRODUCTS/SERVICES/SOLUTIONS OFFERED
             12.1.11 GENOMATICA, INC.
                       TABLE 265 GENOMATICA, INC.: BUSINESS OVERVIEW
                       TABLE 266 GENOMATICA, INC.: PRODUCTS/SERVICES/SOLUTIONS OFFERED
                       TABLE 267 GENOMATICA , INC.: PRODUCT LAUNCHES
             12.1.12 TDELTAS GLOBAL, INC.
                       TABLE 268 TDELTAS GLOBAL, INC.: BUSINESS OVERVIEW
                       TABLE 269 TDELTAS GLOBAL, INC.: PRODUCTS/SERVICES/SOLUTIONS OFFERED
                       TABLE 270 TDELTAS GLOBAL, INC. : OTHERS
             12.1.13 ADVANCED BIOTECH
                       TABLE 271 ADVANCED BIOTECH: BUSINESS OVERVIEW
                       TABLE 272 ADVANCED BIOTECH: PRODUCTS/SERVICES/SOLUTIONS OFFERED
                       TABLE 273 ADVANCED BIOTECH: OTHERS
             12.1.14 HUNAN NUTRAMAX INC.
                       TABLE 274 HUNAN NUTRAMAX INC.: BUSINESS OVERVIEW
                       TABLE 275 HUNAN NUTRAMAX INC.: PRODUCTS/SERVICES/SOLUTIONS OFFERED
                       TABLE 276 HUNAN NUTRAMAX INC.: OTHERS
             12.1.15 TAJ PHARMACEUTICALS LIMITED
                       TABLE 277 TAJ PHARMACEUTICALS LIMITED.: BUSINESS OVERVIEW
                       TABLE 278 TAJ PHARMACEUTICALS LIMITED.: PRODUCTS/SERVICES/SOLUTIONS OFFERED
             12.1.16 BOLI LLC
                       TABLE 279 BOLI LLC: BUSINESS OVERVIEW
                       TABLE 280 BOLI LLC: PRODUCTS/SERVICES/SOLUTIONS OFFERED
               12.1.17 LIFESENSE PRODUCTS
                       TABLE 281 LIFESENSE PRODUCTS: BUSINESS OVERVIEW
                       TABLE 282 LIFESENSE PRODUCTS: PRODUCTS/SERVICES/SOLUTIONS OFFERED
                       TABLE 283 LIFESENSE PRODUCTS: PRODUCT LAUNCHES
               12.1.18 REAL KETONES
                       TABLE 284 REAL KETONES: BUSINESS OVERVIEW
                       TABLE 285 REAL KETONES: PRODUCTS/SERVICES/SOLUTIONS OFFERED
               12.1.19 AUDACIOUS NUTRITION
                       TABLE 286 AUDACIOUSNUTRITION: BUSINESS OVERVIEW
                       TABLE 287 AUDACIOUSNUTRITION: PRODUCTS/SERVICES/SOLUTIONS OFFERED
               12.1.20 KISS MY KETO.
                       TABLE 288 KISS MY KETO.: BUSINESS OVERVIEW
                       TABLE 289 KISS MY KETO.: PRODUCTS/SERVICES/SOLUTIONS OFFERED
     12.2 OTHER PLAYERS 
             12.2.1 DRINK KENETIK
                       TABLE 290 DRINK KENETIK.: COMPANY OVERVIEW
             12.2.2 HEALTH SOURCES NUTRITION CO., LTD
                       TABLE 291 HEALTH SOURCES NUTRITION CO., LTD.: COMPANY OVERVIEW
             12.2.3 ANCIENT BRANDS, LLC.
                       TABLE 292 ANCIENT BRANDS, LLC.: COMPANY OVERVIEW
             12.2.4 ZHOU NUTRITION.
                       TABLE 293 ZHOU NUTRITION.: COMPANY OVERVIEW
             12.2.5 COMPOUND SOLUTIONS, INC.
                       TABLE 294 COMPOUND SOLUTIONS, INC.: COMPANY OVERVIEW
*Details on Business Overview, Products/Services/Solutions Offered, Recent Developments, and MnM View (Key strengths/Right to Win, Strategic Choices Made, and Weaknesses and Competitive Threats) might not be captured in case of unlisted companies.
 
13 ADJACENT & RELATED MARKETS (Page No. - 249)
     13.1 INTRODUCTION 
     13.2 LIMITATIONS 
     13.3 PERSONALIZED NUTRITION MARKET 
             13.3.1 MARKET DEFINITION
             13.3.2 MARKET OVERVIEW
             13.3.3 PERSONALIZED NUTRITION MARKET, BY APPLICATION
                       13.3.3.1 Introduction
                                   TABLE 295 PERSONALIZED NUTRITION MARKET, BY APPLICATION, 2019–2021 (USD MILLION)
                                   TABLE 296 PERSONALIZED NUTRITION MARKET, BY APPLICATION, 2022–2027 (USD MILLION)
             13.3.4 PERSONALIZED NUTRITION MARKET, BY REGION
                       13.3.4.1 Introduction
                                   TABLE 297 PERSONALIZED NUTRITION MARKET, BY REGION, 2019–2021 (USD MILLION)
                                   TABLE 298 PERSONALIZED NUTRITION MARKET, BY REGION, 2022–2027 (USD MILLION)
     13.4 BONE & JOINT HEALTH SUPPLEMENTS MARKET 
             13.4.1 MARKET DEFINITION
             13.4.2 MARKET OVERVIEW
             13.4.3 BONE & JOINT HEALTH SUPPLEMENTS MARKET, BY TYPE
                       13.4.3.1 Introduction
                                   TABLE 299 BONE & JOINT HEALTH SUPPLEMENTS MARKET, BY TYPE, 2017–2021 (USD MILLION)
                                   TABLE 300 BONE & JOINT HEALTH SUPPLEMENTS MARKET, BY TYPE, 2022–2027 (USD MILLION)
             13.4.4 GLOBAL BONE & JOINT HEALTH SUPPLEMENTS MARKET SIZE, BY REGION
                       13.4.4.1 Introduction
                                   TABLE 301 GLOBAL BONE & JOINT HEALTH SUPPLEMENTS MARKET SIZE, BY REGION, 2017–2021 (USD MILLION)
                                   TABLE 302 GLOBAL BONE & JOINT HEALTH SUPPLEMENTS MARKET SIZE, BY REGION, 2022–2027 (USD MILLION)
 
14 APPENDIX (Page No. - 256)
     14.1 DISCUSSION GUIDE 
     14.2 KNOWLEDGESTORE: MARKETSANDMARKETS’ SUBSCRIPTION PORTAL 
     14.3 CUSTOMIZATION OPTIONS 
     14.4 RELATED REPORTS 
     14.5 AUTHOR DETAILS 

This research involves the extensive use of secondary sources; directories; and databases (Bloomberg and Factiva) to identify and collect information useful for a technical, market-oriented, and commercial study of the Ketones market. In-depth interviews were conducted with various primary respondents, such as key industry participants, Subject Matter Experts (SMEs), C-level executives of key market players, and industry consultants, to obtain and verify critical qualitative and quantitative information and to assess prospects.

Secondary Research

In the secondary research process, various sources, such as the Food and Agricultural Organization (FAO), United States Department of Agriculture (USDA), U.S. Food and Drug Administration (FDA) U.S. Food and Drug Administration (FDA), European Food Safety Authority (EFSA), World Health Organization (WHO), Consumer Healthcare Products Association (CHPA), European Federation of Associations of Health Product Manufacturers (EHPM), Canadian Health Food Association (CHFA), and Health Food Manufacturers' Association (HFMA), associations were referred to identify and collect information for this study. The secondary sources also include journals, press releases, investor presentations of companies, whitepapers, certified publications, articles by recognized authors and regulatory bodies, trade directories, and paid databases.

Primary Research

The Ketones market encompasses various stakeholders involved in the supply chain, raw material manufacturers, raw material suppliers, regulatory organizations, and research institutions. To gather comprehensive information, primary sources from both the supply and demand sides were engaged. Primary interviewees from the supply side consisted of manufacturers, distributors, importers, and technology providers involved in the production and distribution of Ketones. On the demand side, key opinion leaders, executives, and CEOs of companies in the Ketones market were approached through questionnaires, emails, and telephonic interviews. This approach ensured a comprehensive and well-rounded understanding of the Ketones market from various perspectives.
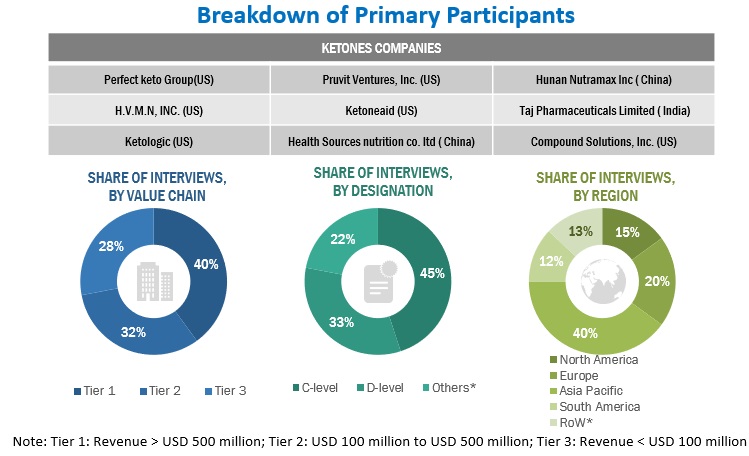
Ketones Market Primary Research

To know about the assumptions considered for the study, download the pdf brochure

Market Size Estimation

The top-down and bottom-up approaches were used to estimate and validate the size of the marketand various dependent submarkets. The research methodology used to estimate the market size includes extensive secondary research of key players, reports, reviews, and newsletters of top market players, along with extensive interviews from leaders, such as CEOs, directors, and marketing executives.

Global Ketones Market Size: Bottom-Up Approach
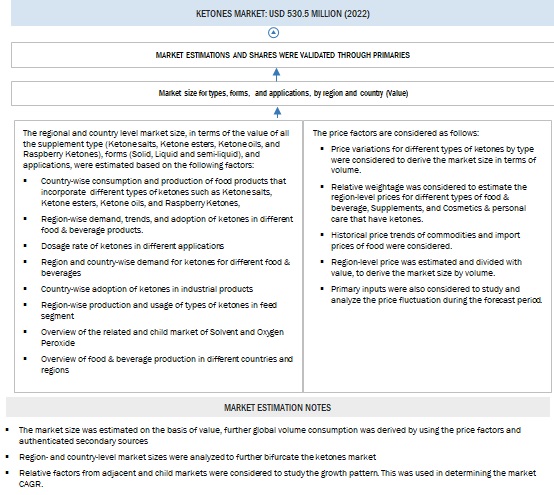
Ketones Market Bottom-Up Approach

To know about the assumptions considered for the study, Request for Free Sample Report

Global Ketones Market Size: Top-Down Approach

Ketones Market Top-Down Approach

Market Definition

Ketones are organic compounds that are characterized by the presence of the carbonyl group, in which carbon atom is covalently bonded to an oxygen atom and are also known as ketone bodies. Ketones are the by-products of the human body that break down fats for energy. They are chemicals that are usually produced in the liver, particularly due to insufficient stored glucose or sugar to turn into energy. Three types of ketones are burned in the body during ketosis, namely, acetoacetate, beta-hydroxybutyric acid, and acetone.

Data Triangulation

The data triangulation and market breakdown procedures explained above were implemented, wherever applicable, to complete the overall market engineering process and arrive at the exact statistics for various market segments and subsegments. The data was triangulated by studying various factors and trends from the demand and supply sides. Along with this, the market size was validated using both the top-down and bottom-up approaches.

Key Stakeholders

  • Food & beverage suppliers and manufacturers
  • Food & beverage importers and exporters
  • Food & beverage traders and distributors
  • Government and research organizations
  • Associations and industry bodies
  • World Health Organization (WHO)
  • Food and Drug Administration (FDA)
  • Institute of Food and Agricultural Sciences (IFAS)
  • Global Food & Beverage Association (GFBA)
  • The National Food Safety and Quality Service (SENASA)
  • Food Safety and Standards Authority of India (FSSAI)
  • US Department of Agriculture (USDA)
  • Food Standards Australia New Zealand (FSANZ)
  • Institute of Food Technologists
  • Food and Agriculture Organization (FAO)
  • EC EUROPA

Report Objectives

  • To define, segment, and project the global market for Ketones based on type, form, application, and region. 
  • To provide detailed information regarding the key factors influencing the growth of the market (drivers, restraints, opportunities, and industry-specific challenges)
  • To strategically analyze the micro markets for individual growth trends, prospects, and their contribution to the total market
  • To analyze the opportunities in the market for stakeholders and provide a competitive landscape of the market leaders.
  • To project the size of the market and its submarkets, in terms of value with respect to the regions (along with the key countries)
  • To strategically profile the key players and comprehensively analyze their market position and core competencies.
  • To analyze competitive developments in the Ketones market, including joint ventures, mergers & acquisitions, new product developments, and research & development activities

Available Customizations:

With the given market data, MarketsandMarkets offers customizations according to company-specific scientific needs.

The following customization options are available for the report:

Product Analysis

  • Product Matrix, which gives a detailed comparison of the product portfolio of each company

Geographic Analysis

With the given market data, MarketsandMarkets offers customizations according to company-specific scientific needs.

  • Further breakdown of the Rest of the European Ketones market, by key country
  • Further breakdown of the Rest of the Asia Pacific Ketones market, by key country
  • Further breakdown of the Rest of South America Ketones market, by key country

Company Information

  • Detailed analyses and profiling of additional market players
Custom Market Research Services

We will customize the research for you, in case the report listed above does not meet with your exact requirements. Our custom research will comprehensively cover the business information you require to help you arrive at strategic and profitable business decisions.

Request Customization
Report Code
FB 7457
Published ON
Jan, 2024
Choose License Type
BUY NOW
  • SHARE
X
Request Customization
Speak to Analyst
Speak to Analyst
OR FACE-TO-FACE MEETING
PERSONALIZE THIS RESEARCH
  • Triangulate with your Own Data
  • Get Data as per your Format and Definition
  • Gain a Deeper Dive on a Specific Application, Geography, Customer or Competitor
  • Any level of Personalization
REQUEST A FREE CUSTOMIZATION
LET US HELP YOU!
  • What are the Known and Unknown Adjacencies Impacting the Ketones Market
  • What will your New Revenue Sources be?
  • Who will be your Top Customer; what will make them switch?
  • Defend your Market Share or Win Competitors
  • Get a Scorecard for Target Partners
CUSTOMIZED WORKSHOP REQUEST
knowledgestore logo

Hold On!

Want to explore hidden markets that can drive new revenue in Ketones Market?

Find Hidden Markets
  • Call Us
  • +1-888-600-6441 (Corporate office hours)
  • +1-888-600-6441 (US/Can toll free)
  • +44-800-368-9399 (UK office hours)
CONNECT WITH US
ABOUT TRUST ONLINE
©2024 MarketsandMarkets Research Private Ltd. All rights reserved
DMCA.com Protection Status
Website Feedback