Theranostics Market by Product (Diagnostic imaging (PET, CT, MRI), Radiopharmaceuticals (Lu-177, Sm-153, Ra-223, I-131), Biomarker screening, Software), Application (Prostate Cancer, Bone metastasis), & Stakeholder Expectations - Global Forecast to 2028
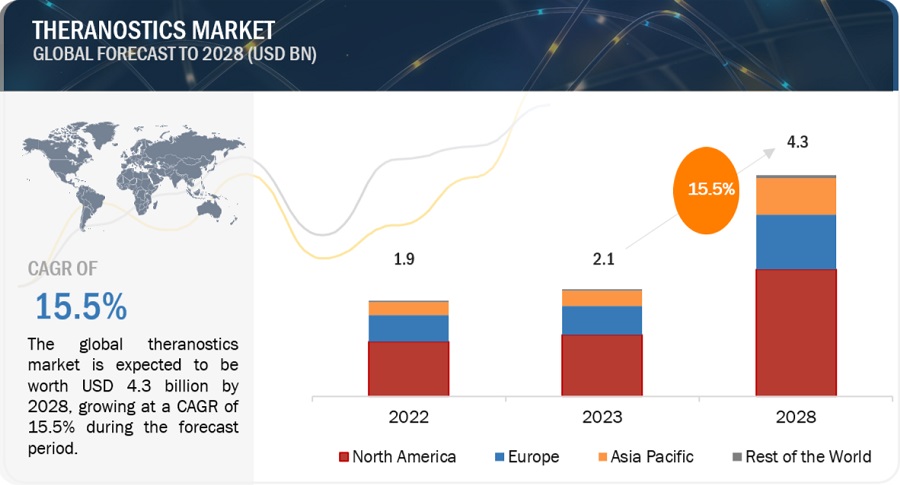
The global theranostics market in terms of revenue was estimated to be worth $2.1 Billion in 2023 and is poised to reach $4.3 Billion by 2028, growing at a CAGR of 15.5% from 2023 to 2028. The new research study consists of an industry trend analysis of the market. The new research study consists of industry trends, pricing analysis, patent analysis, conference and webinar materials, key stakeholders, and buying behaviour in the market. Increasing establishment of hospitals, rising focus on targeted therapies, and introduction of novel theranostic approaches are expected to drive the market during the forecast period. Introduction of artificial intelligence (AI) helps to improve the diagnostic accuracy. Recent FDA approvals increases the awareness and supports rising adoption of theranostics.
Global Theranostics Market
To know about the assumptions considered for the study, Request for Free Sample Report
e- Estimated; p- Projected
Theranostics Market: Market Dynamics
Driver: Rising focus on precision medicine to propel the market
Precision medicine or personalized medicine involves the targeted approach for a patient by considering the difference in the genes and other factors such as lifestyles and environments. Specific characteristics of a patient are analyzed tailored for innovative approach to medical treatment. The treatment or therapy designed for the patient by considering the molecular and cellular profile results in effective prevention, diagnosis, improved outcomes, and reduced side effects.
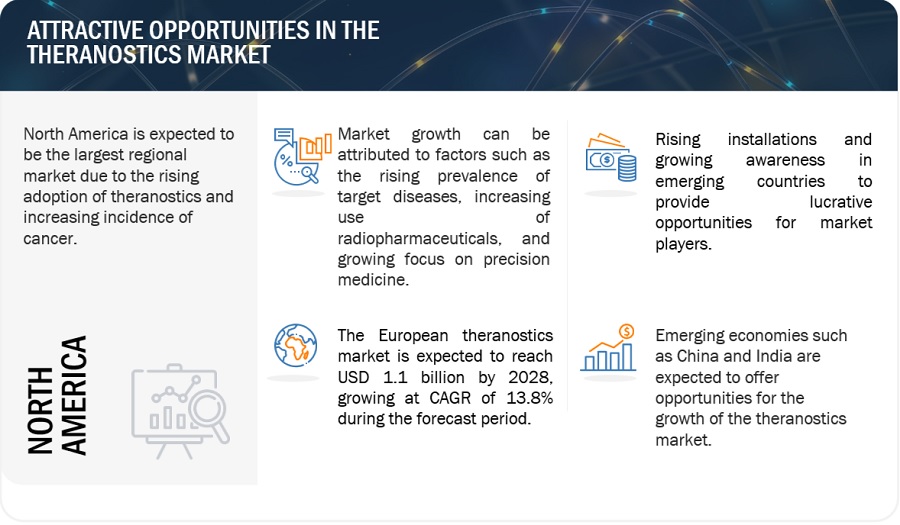
Theranostics, a combination of diagnostics and therapy, emphasizes individualized and targeted therapies. Theranostics and precision medicine proves to be helpful with the better management of patients suffering through cancer. Specific biomarkers are identified to know the patient’s response to the treatment. This helps healthcare professionals with decisions such as drug selection that leads to higher treatment success rates. Identification of molecular basis of the disease in precision medicine is supported by theranostics. Theranostics provides diagnostic tools that helps with identifying the patients that are best suited for the treatment. Hence, rising incidents of cancer and increasing focus on presonlized treatment is anticipated to propel the market in future.
Restraint: Short half-life of radiopharmaceuticals
The expiry of a radiopharmaceutical primarily depends on the half-life of the radioisotope and the content of the radionuclide. For example, the radioactivity of F-18 decreases if not used within 110 minutes, while the radioactivity of C-11 decreases within 20 minutes. Whereas the radioactivity of Tc-99m is reduced after six hours, while I-123 and In-111 isotopes should be utilized within 13 and 67 hours, respectively. The non-utilization of radioisotopes within the prescribed shelf life causes radiation and chemical decomposition. This leads to reduction in the radiochemical purity to an unacceptable form, which may prove fatal during diagnosis and therapy. As a result, the geographic locations of the production site and usage site of radioisotopes have to be proximate. This increases the investment required for the establishment of production facilities. Additionally, the shorter half-life of radiopharmaceuticals creates a need for in-house radiopharmaceutical production in cyclotrons/generators within hospital premises, further increasing the capital expenditure for hospitals.
Opportunity: Growth opportunities in emerging countries
Developing economies such as offer growth opportunities for the major players in the market. Although the cost factor is a concern in these developing countries, their huge population base—especially in India and China—offers a sustainable market for theranostics.
The high incidence of chronic diseases such as cancer, strokes, and neurological and cardiovascular diseases, as well as the high death rates in these countries, have increased the need for early detection. According to a GLOBOCAN 2020 report, the number of new cancer cases diagnosed in 2020 was 19.3 million, and almost 10.0 million died due to cancer.
Key market players are adopting various growth strategies to strengthen their foothold in this region. For instance, in August 2019, Eckert & Ziegler (Germany) initiated a joint venture with Chengdu New Radiomedicine Technology Co., Ltd. (China) to set up a new production facility for radiopharmaceuticals used in the treatment of hepatocellular carcinomas in China. According to an article published in the European Journal of Nuclear Medicine and Molecular Imaging 2022, by 2025, about 50 new centralized radiopharmacies will be built across China, and the availability and accessibility of radiopharmaceuticals will be significantly improved by then.
All these factors are expected to offer growth opportunities for players operating in the market.
Challenge: Shortage of trained professionals
The rising cost of prescription drugs and a sharp decline in the proposed budget allocations for Health and Human Services in the US have significantly reduced hospital budgets. A study by the American Hospital Association estimates that federal payment cuts to hospitals would amount to USD 218 billion by 2028, forcing hospitals to allocate smaller budgets annually.
Healthcare facilities that purchase expensive equipment such as cyclotron or nuclear reactors and radiotracers often depend on third-party payers (such as Medicare, Medicaid, or private health insurance plans) to avail reimbursements for costs incurred in diagnostic, screening, and therapeutic procedures performed with these devices. However, continuous cuts in the reimbursement and the increasing cost of radiotracers due to their limited availability prevent imaging centers from investing in these modalities.
Moreover, owing to the high cost of the equipment, most hospitals in developing countries are unable to afford this highly sophisticated technology. Due to the high cost of these systems and financial limitations, healthcare facilities such as small hospitals and cancer care centers are reluctant to invest in this equipment. This will force them to focus on lower-priced alternatives, such as refurbished devices or upgrades of existing devices.
Market Ecosystem
By product, the diagnostic imaging segment of theranostics industry accounted for the largest share in 2022.
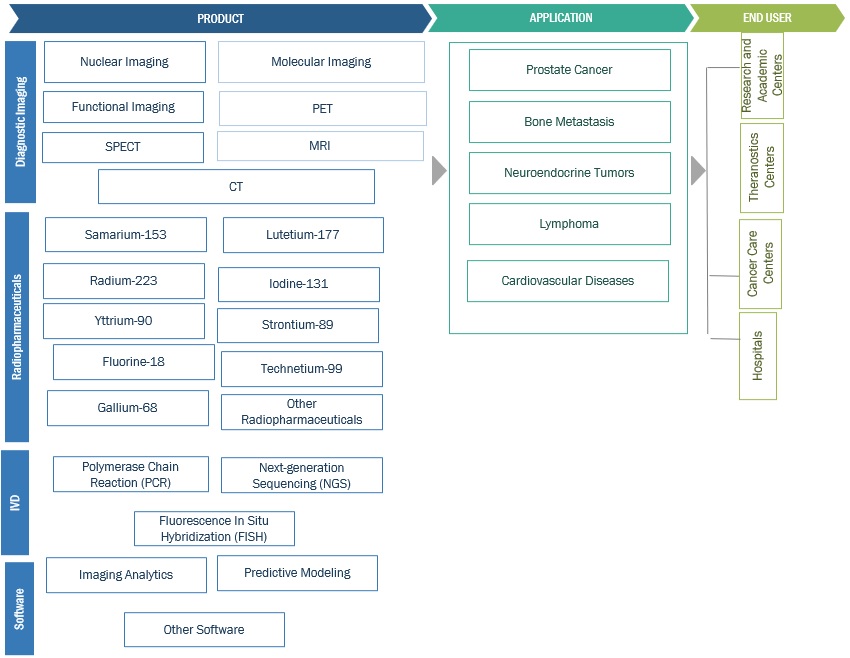
Based on product, the theranostics market is segmented into diagnostic imaging, radiopharmaceuticals, IVD/biomarker screening, and software and services. In 2022, the diagnostic imaging segment accounted for the largest market share. The rising use of advanced instruments supporting accurate diagnosis and availability of systems with better sensitivity is driving the segment growth.
By application, the prostate cancer segment of theranostics industry to register significant growth in the near future.
Based on application, the theranostics market is segmented into prostate cancer, bone metastasis, other cancer, and other applications. Prostate cancer segment to register the highest growth rate during the forecast period. The major factors responsible for the highest growth rate of this segment are the rising incidence of prostate cancer and increasing investments and funds related to cancer.
By end user, the hospitals segment of theranostics industry accounted for the largest share in 2022.
Based on end user, the global theranostics market is segmented into hospitals and cancer care centers, theranostics centers, and research and academic centers. In 2022, hospitals and cancer care segment accounted for the largest market share. The highest share of this segment is attributed to the rising aoption of theranostic treatment at the hospitals for and increasing awareness regarding benefits of the treamtment. This is primarily attributed to the recent approvals and the rising adoption advanced diagnostic imaging systems with improved features in hospitals supporting patient care.
Theranostics Industry By region, North America is expected to be the largest market during the forecast period.
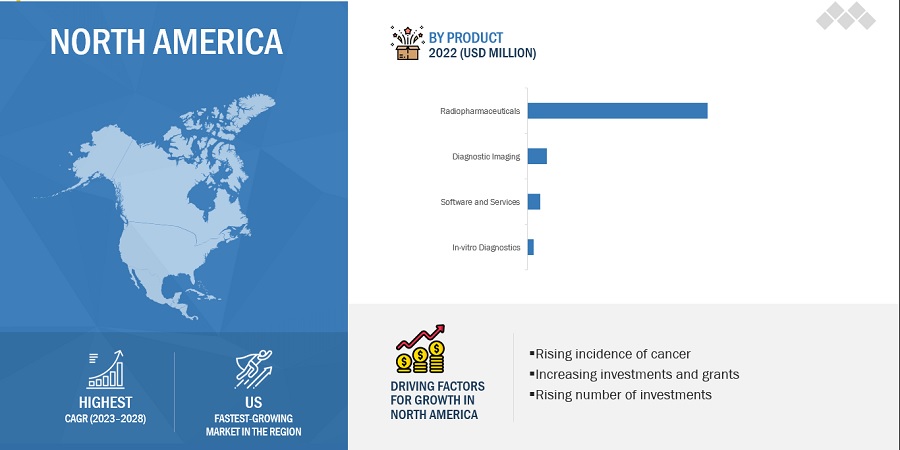
North America accounted for the largest share of the Theranostics Market in 2022. Factors such as rising cancer incidence and rising number of investments supporting increasing adoption of theranostics is driving the market growth. Rapid growth in the old age population in the region and establishment of the theransotics centers are supporting the growth of the market.
To know about the assumptions considered for the study, download the pdf brochure
As of 2022, prominent players in the market are Advanced Accelerator Applications (France), Bayer AG (Germany), GE Healthcare (US).
Scope of the Theranostics Industry:
|
Report Metric |
Details |
|
Market Revenue in 2023 |
$2.1 Billion |
|
Projected Revenue by 2028 |
$4.3 Billion |
|
Revenue Rate |
Poised to Grow at a CAGR of 15.5% |
|
Market Driver |
Rising focus on precision medicine to propel the market |
|
Market Opportunity |
Growth opportunities in emerging countries |
This report has segmented the global theranostics market to forecast revenue and analyze trends in each of the following submarkets:
By Product
- Diagnostic Imaging
- Radiopharmaceuticals
- IVD/Biomarker Screening
- Software and Services
By Application
- Prostate Cancer
- Bone Metastasis
- Other Cancers
- Other Applications
By End User
- Hospitals and Cancer Care Centers
- Theranostics Centers
- Research and Academic Centers
By Region
-
North America
- US
- Canada
-
Europe
- Germany
- France
- UK
-
Rest of Europe
- Asia Pacific
- Japan
- China
- India
- Rest of Asia Pacific
- Rest of the World
Recent Developments of Theranostics Industry:
- Advanced Accelerator Applications (France) received FDA approval for Pluvicto (lutetium Lu 177 vipivotide tetraxetan). Pluvicto is a targeted radioligand therapy for patients with prostate cancer with a therapeutic radioisotope.
- Bayer AG (Germany) and the Broad Institute of MIT and Harvard (US) extended their long term collaboration for the advancement of new therapeutic approaches in cancer.
- GE Healthcare collaborated with the Mayo Clinic (US) for innovation in research and product development. The collaboration aims to have the technology for clinicians for the precise diagnosis and approaches to theranostics and medical imaging.
Frequently Asked Questions (FAQ):
What is the projected market revenue value of the global theranostics market?
The global theranostics market boasts a total revenue value of $4.3 Billion by 2028.
What is the estimated growth rate (CAGR) of the global theranostics market?
The global theranostics market has an estimated compound annual growth rate (CAGR) of 15.5% and a revenue size in the region of $2.1 Billion in 2023.
To speak to our analyst for a discussion on the above findings, click Speak to Analyst


- 5.1 INTRODUCTION
-
5.2 MARKET DYNAMICSDRIVERS- Growing geriatric population and rising prevalence of target diseases- Increasing use of radiopharmaceuticals in neurological applications- Growing focus on precision medicineRESTRAINTS- Short half-life of radiopharmaceuticals- Unfavorable healthcare reimbursement scenarioOPPORTUNITIES- Growth opportunities in emerging economies- Rising number of R&D programs for radiopharmaceuticalsCHALLENGES- Hospital budget cuts and high equipment costs
- 5.3 PRICING ANALYSIS
- 5.4 VALUE CHAIN ANALYSIS
-
5.5 ECOSYSTEM/MARKET MAP
-
5.6 SUPPLY CHAIN ANALYSISPROMINENT COMPANIESSMALL & MEDIUM-SIZED ENTERPRISESEND USERS
-
5.7 PORTER’S FIVE FORCES ANALYSISINTENSITY OF COMPETITIVE RIVALRYBARGAINING POWER OF SUPPLIERSBARGAINING POWER OF BUYERSTHREAT OF SUBSTITUTESTHREAT OF NEW ENTRANTS
-
5.8 REGULATORY LANDSCAPENORTH AMERICA- US- CanadaEUROPEASIA PACIFIC- Australia- India- ChinaREST OF THE WORLD- Turkey- UAE- South Africa
- 5.9 TIMELINE FOR THERANOSTICS MARKET
- 5.10 REIMBURSEMENT ANALYSIS
-
5.11 TRADE ANALYSISTRADE ANALYSIS FOR THERANOSTICS MARKET
-
5.12 PATENT ANALYSIS
- 5.13 CASE STUDY ANALYSIS
-
5.14 KEY STAKEHOLDERS & BUYING CRITERIAKEY STAKEHOLDERSIMPACT ANALYSIS OF KEY BUYING CRITERIA
- 5.15 KEY CONFERENCES & EVENTS
- 5.16 CLINICAL RESEARCH DATA FOR THERANOSTICS MARKET
- 6.1 INTRODUCTION
-
6.2 DIAGNOSTIC IMAGINGEASY ANALYSIS OF DISEASE CONDITIONS AND ACCURATE THERAPIES TO DRIVE MARKET
-
6.3 RADIOPHARMACEUTICALSLUTETIUM-177- Increasing incidence of neuroendocrine cancer to boost segment- Samarium-153- Rising incidence of bone metastasis to drive segment growth- Radium-223- Iodine-131- Yttrium-90- Other radiopharmaceuticals
-
6.4 IVD/BIOMARKER SCREENINGRISING ADOPTION OF THERANOSTICS TREATMENT TO SUPPORT MARKET GROWTH
-
6.5 SOFTWARE & SERVICESRISING USE OF NOVEL SOFTWARE AND INCREASING DEMAND FOR IMAGING SERVICES TO PROPEL MARKET
- 7.1 INTRODUCTION
-
7.2 PROSTATE CANCERRISING INCIDENCE OF PROSTATE CANCER AMONG MEN TO FUEL MARKET
-
7.3 BONE METASTASISINTRODUCTION OF NOVEL MEDICAL THERAPIES TO DRIVE MARKET
- 7.4 OTHER CANCERS
- 7.5 OTHER APPLICATIONS
- 8.1 INTRODUCTION
-
8.2 HOSPITALS AND CANCER CARE CENTERSRISING TREND OF MODERNIZING IMAGING WORKFLOW SYSTEMS TO DRIVE MARKET
-
8.3 THERANOSTICS CENTERSGROWING FOCUS ON TARGETED THERAPIES AND RISING PREVALENCE OF CHRONIC DISEASES TO PROPEL MARKET
-
8.4 RESEARCH AND ACADEMIC CENTERSINCREASING COLLABORATIONS BETWEEN THERANOSTICS COMPANIES AND ACADEMIA TO SUPPORT MARKET GROWTH
- 9.1 INTRODUCTION
- 9.2 NORTH AMERICA
-
9.3 NORTH AMERICA: RECESSION IMPACTUS- US to dominate North American theranostics market during forecast periodCANADA- Rising geriatric population and increasing number of initiatives for medical isotope development to drive market
-
9.4 EUROPEEUROPE: RECESSION IMPACTGERMANY- Well-established healthcare system and increased geriatric population to drive marketUK- Increasing government funding in diagnostic imaging to support market growthFRANCE- Favorable government initiatives and high incidence of cancer to propel marketREST OF EUROPE
-
9.5 ASIA PACIFICASIA PACIFIC: RECESSION IMPACTJAPAN- Established nuclear medicine infrastructure and better accessibility of healthcare services to drive marketCHINA- Increasing number of government initiatives and growing geriatric population to drive marketINDIA- Rising number of nuclear medicine facilities and increasing incidence of chronic diseases to propel marketREST OF ASIA PACIFIC
-
9.6 REST OF THE WORLDREST OF THE WORLD: RECESSION IMPACT

- 10.1 OVERVIEW
- 10.2 KEY STRATEGIES/RIGHT TO WIN
- 10.3 MAJOR STRATEGIES ADOPTED BY KEY PLAYERS IN THERANOSTICS MARKET
- 10.4 REVENUE SHARE ANALYSIS
- 10.5 MARKET SHARE ANALYSIS
-
10.6 COMPANY EVALUATION MATRIXSTARSEMERGING LEADERSPERVASIVE PLAYERSPARTICIPANTSCOMPANY FOOTPRINT
-
10.7 START-UP/SME EVALUATION MATRIXPROGRESSIVE COMPANIESRESPONSIVE COMPANIESDYNAMIC COMPANIESSTARTING BLOCKSCOMPETITIVE BENCHMARKING
- 10.8 COMPETITIVE SCENARIOS & TRENDS
-
11.1 KEY PLAYERSADVANCED ACCELERATOR APPLICATIONS- Business overview- Products/Services/Solutions offered- Recent developments- MnM viewBAYER AG- Business overview- Products/Services/Solutions offered- Recent developments- MnM viewGE HEALTHCARE- Business overview- Products/Services/Solutions offered- Recent developments- MnM viewSIEMENS HEALTHINEERS AG- Business overview- Products/Services/Solutions offered- Recent developmentsCARDINAL HEALTH- Business overview- Products/Services/Solutions offered- Recent developmentsPHILIPS HEALTHCARE- Business overview- Products/Services/Solutions offered- Recent developmentsCANON INC.- Business overview- Products/Services/Solutions offered- Recent developmentsCURIUM- Business overview- Products/Services/Solutions offered- Recent developmentsLANTHEUS- Business overview- Products/Services/Solutions offered- Recent developmentsNORTHSTAR MEDICAL RADIOISOTOPES- Business overview- Products/Services/Solutions offered- Recent developmentsECKERT & ZIEGLER- Business overview- Products/Services/Solutions offered- Recent developmentsPHARMALOGIC- Business overview- Products/Services/Solutions offered- Recent developmentsECZACIBASI-MONROL- Business overview- Products/Services/Solutions offered- Recent developmentsACROTECH BIOPHARMA, INC.- Business overview- Products/Services/Solutions offered
-
11.2 OTHER PLAYERSTHERMO FISHER SCIENTIFIC INC.GLOBAL MEDICAL SOLUTIONSSHINE TECHNOLOGIES, LLCISOTOPIA MOLECULAR IMAGING LTD.INSTITUTE OF ISOTOPESCHINA ISOTOPE & RADIATION CORPORATIONYANTAI DONGCHENG PHARMACEUTICAL GROUP CO., LTD.ATOMVIEABX ADVANCED BIOCHEMICAL COMPOUNDS GMBHTELIX PHARMACEUTICALS LIMITEDBLUE EARTH DIAGNOSTICSSOFIE BIOSCIENCESTHERAGNOSTICS
- 12.1 DISCUSSION GUIDE
- 12.2 KNOWLEDGESTORE: MARKETSANDMARKETS’ SUBSCRIPTION PORTAL
- 12.3 CUSTOMIZATION OPTIONS
- 12.4 RELATED REPORTS
- 12.5 AUTHOR DETAILS
- TABLE 1 RISK ASSESSMENT: THERANOSTICS MARKET
- TABLE 2 PHYSICAL HALF-LIFE OF RADIOPHARMACEUTICALS
- TABLE 3 AVERAGE COST FOR THERANOSTICS TREATMENT, BY REGION
- TABLE 4 PORTER’S FIVE FORCES ANALYSIS: THERANOSTICS MARKET
- TABLE 5 REGULATORY AGENCIES AND GUIDELINES
- TABLE 6 MEDICAL REIMBURSEMENT CODES FOR THERANOSTICS IN US, 2022
- TABLE 7 IMPORT DATA FOR RADIOPHARMACEUTICALS, BY COUNTRY, 2018–2022 (USD THOUSAND)
- TABLE 8 EXPORT DATA FOR RADIOPHARMACEUTICALS, BY COUNTRY, 2018–2022 (USD THOUSAND)
- TABLE 9 CASE STUDY 1: LUTETIUM-177-PSMA-617 FOR METASTATIC CASTRATION-RESISTANT PROSTATE CANCER
- TABLE 10 KEY STAKEHOLDERS AND THEIR REQUIREMENTS
- TABLE 11 IMPACT OF KEY STAKEHOLDERS ON BUYING CRITERIA
- TABLE 12 LIST OF KEY CONFERENCES & EVENTS, 2023–2024
- TABLE 13 THERANOSTICS MARKET, BY PRODUCT, 2021–2028 (USD MILLION)
- TABLE 14 THERANOSTICS MARKET FOR DIAGNOSTIC IMAGING, BY REGION, 2021–2028 (USD MILLION)
- TABLE 15 THERANOSTICS MARKET FOR RADIOPHARMACEUTICALS, BY TYPE, 2021–2028 (USD MILLION)
- TABLE 16 THERANOSTICS MARKET FOR RADIOPHARMACEUTICALS, BY REGION, 2021–2028 (USD MILLION)
- TABLE 17 LUTETIUM-177 MARKET, BY REGION, 2021–2028 (USD MILLION)
- TABLE 18 SAMARIUM-153 MARKET, BY REGION, 2021–2028 (USD MILLION)
- TABLE 19 RADIUM-223 MARKET, BY REGION, 2021–2028 (USD MILLION)
- TABLE 20 IODINE-131 MARKET, BY REGION, 2021–2028 (USD MILLION)
- TABLE 21 YTTRIUM-90 MARKET, BY REGION, 2021–2028 (USD MILLION)
- TABLE 22 OTHER RADIOPHARMACEUTICALS MARKET, BY REGION, 2021–2028 (USD MILLION)
- TABLE 23 THERANOSTICS MARKET FOR IVD/BIOMARKER SCREENING, BY REGION, 2021–2028 (USD MILLION)
- TABLE 24 THERANOSTICS MARKET FOR SOFTWARE & SERVICES, BY REGION, 2021–2028 (USD MILLION)
- TABLE 25 THERANOSTICS MARKET, BY APPLICATION, 2021–2028 (USD MILLION)
- TABLE 26 THERANOSTICS MARKET FOR PROSTATE CANCER, BY REGION, 2021–2028 (USD MILLION)
- TABLE 27 THERANOSTICS MARKET FOR BONE METASTASIS, BY REGION, 2021–2028 (USD MILLION)
- TABLE 28 THERANOSTICS MARKET FOR OTHER CANCERS, BY REGION, 2021–2028 (USD MILLION)
- TABLE 29 THERANOSTICS MARKET FOR OTHER APPLICATIONS, BY REGION, 2021–2028 (USD MILLION)
- TABLE 30 THERANOSTICS MARKET, BY END USER, 2021–2028 (USD MILLION)
- TABLE 31 THERANOSTICS MARKET FOR HOSPITALS AND CANCER CARE CENTERS, BY REGION, 2021–2028 (USD MILLION)
- TABLE 32 THERANOSTICS MARKET FOR THERANOSTICS CENTERS, BY REGION, 2021–2028 (USD MILLION)
- TABLE 33 THERANOSTICS MARKET FOR RESEARCH AND ACADEMIC CENTERS, BY REGION, 2021–2028 (USD MILLION)
- TABLE 34 THERANOSTICS MARKET, BY REGION, 2021–2028 (USD MILLION)
- TABLE 35 NORTH AMERICA: THERANOSTICS MARKET, BY COUNTRY, 2021–2028 (USD MILLION)
- TABLE 36 NORTH AMERICA: THERANOSTICS MARKET, BY PRODUCT, 2021–2028 (USD MILLION)
- TABLE 37 NORTH AMERICA: THERANOSTICS MARKET FOR RADIOPHARMACEUTICALS, BY TYPE, 2021–2028 (USD MILLION)
- TABLE 38 NORTH AMERICA: THERANOSTICS MARKET, BY APPLICATION, 2021–2028 (USD MILLION)
- TABLE 39 NORTH AMERICA: THERANOSTICS MARKET, BY END USER, 2021–2028 (USD MILLION)
- TABLE 40 US: KEY MACROINDICATORS
- TABLE 41 US: THERANOSTICS MARKET, BY PRODUCT, 2021–2028 (USD MILLION)
- TABLE 42 US: THERANOSTICS MARKET RADIOPHARMACEUTICALS, BY TYPE, 2021–2028 (USD MILLION)
- TABLE 43 CANADA: KEY MACROINDICATORS
- TABLE 44 CANADA: THERANOSTICS MARKET, BY PRODUCT, 2021–2028 (USD MILLION)
- TABLE 45 CANADA: THERANOSTICS MARKET FOR RADIOPHARMACEUTICALS, BY TYPE, 2021–2028 (USD MILLION)
- TABLE 46 EUROPE: THERANOSTICS MARKET, BY COUNTRY, 2021–2028 (USD MILLION)
- TABLE 47 EUROPE: THERANOSTICS MARKET, BY PRODUCT, 2021–2028 (USD MILLION)
- TABLE 48 EUROPE: THERANOSTICS MARKET FOR RADIOPHARMACEUTICALS, BY TYPE, 2021–2028 (USD MILLION)
- TABLE 49 EUROPE: THERANOSTICS MARKET, BY APPLICATION, 2021–2028 (USD MILLION)
- TABLE 50 EUROPE: THERANOSTICS MARKET, BY END USER, 2021–2028 (USD MILLION)
- TABLE 51 GERMANY: THERANOSTICS MARKET, BY PRODUCT, 2021–2028 (USD MILLION)
- TABLE 52 GERMANY: THERANOSTICS MARKET FOR RADIOPHARMACEUTICALS, BY TYPE, 2021–2028 (USD MILLION)
- TABLE 53 UK: THERANOSTICS MARKET, BY PRODUCT, 2021–2028 (USD MILLION)
- TABLE 54 UK: THERANOSTICS MARKET FOR RADIOPHARMACEUTICALS, BY TYPE, 2021–2028 (USD MILLION)
- TABLE 55 FRANCE: THERANOSTICS MARKET, BY PRODUCT, 2021–2028 (USD MILLION)
- TABLE 56 FRANCE: THERANOSTICS MARKET FOR RADIOPHARMACEUTICALS, BY TYPE, 2021–2028 (USD MILLION)
- TABLE 57 REST OF EUROPE: THERANOSTICS MARKET, BY PRODUCT, 2021–2028 (USD MILLION)
- TABLE 58 REST OF EUROPE: THERANOSTICS MARKET FOR RADIOPHARMACEUTICALS, BY TYPE, 2021–2028 (USD MILLION)
- TABLE 59 ASIA PACIFIC: THERANOSTICS MARKET, BY COUNTRY, 2021–2028 (USD MILLION)
- TABLE 60 ASIA PACIFIC: THERANOSTICS MARKET, BY PRODUCT, 2021–2028 (USD MILLION)
- TABLE 61 ASIA PACIFIC: THERANOSTICS MARKET FOR RADIOPHARMACEUTICALS, BY TYPE, 2021–2028 (USD MILLION)
- TABLE 62 ASIA PACIFIC: THERANOSTICS MARKET, BY APPLICATION, 2021–2028 (USD MILLION)
- TABLE 63 ASIA PACIFIC: THERANOSTICS MARKET, BY END USER, 2021–2028 (USD MILLION)
- TABLE 64 JAPAN: THERANOSTICS MARKET, BY PRODUCT, 2021–2028 (USD MILLION)
- TABLE 65 JAPAN: THERANOSTICS MARKET FOR RADIOPHARMACEUTICALS, BY TYPE, 2021–2028 (USD MILLION)
- TABLE 66 CHINA: THERANOSTICS MARKET, BY PRODUCT, 2021–2028 (USD MILLION)
- TABLE 67 CHINA: THERANOSTICS MARKET FOR RADIOPHARMACEUTICALS, BY TYPE, 2021–2028 (USD MILLION)
- TABLE 68 INDIA: THERANOSTICS MARKET, BY PRODUCT, 2021–2028 (USD MILLION)
- TABLE 69 INDIA: THERANOSTICS MARKET FOR RADIOPHARMACEUTICALS, BY TYPE, 2021–2028 (USD MILLION)
- TABLE 70 REST OF ASIA PACIFIC: THERANOSTICS MARKET, BY PRODUCT, 2021–2028 (USD MILLION)
- TABLE 71 REST OF ASIA PACIFIC: THERANOSTICS MARKET FOR RADIOPHARMACEUTICALS, BY TYPE, 2021–2028 (USD MILLION)
- TABLE 72 REST OF THE WORLD: THERANOSTICS MARKET, BY PRODUCT, 2021–2028 (USD MILLION)
- TABLE 73 REST OF THE WORLD: THERANOSTICS MARKET FOR RADIOPHARMACEUTICALS, BY TYPE, 2021–2028 (USD MILLION)
- TABLE 74 REST OF THE WORLD: THERANOSTICS MARKET, BY APPLICATION, 2021–2028 (USD MILLION)
- TABLE 75 REST OF THE WORLD: THERANOSTICS MARKET, BY END USER, 2021–2028 (USD MILLION)
- TABLE 76 DEGREE OF COMPETITION IN THERANOSTICS MARKET
- TABLE 77 PRODUCT AND REGIONAL FOOTPRINT
- TABLE 78 DETAILED LIST OF KEY START-UPS/SMES
- TABLE 81 ADVANCED ACCELERATOR APPLICATIONS: COMPANY OVERVIEW
- TABLE 82 BAYER AG: COMPANY OVERVIEW
- TABLE 83 GE HEALTHCARE: COMPANY OVERVIEW
- TABLE 84 SIEMENS HEALTHINEERS AG: COMPANY OVERVIEW
- TABLE 85 CARDINAL HEALTH: COMPANY OVERVIEW
- TABLE 86 PHILIPS HEALTHCARE: COMPANY OVERVIEW
- TABLE 87 CANON INC.: COMPANY OVERVIEW
- TABLE 88 CURIUM: COMPANY OVERVIEW
- TABLE 89 LANTHEUS: COMPANY OVERVIEW
- TABLE 90 NORTHSTAR MEDICAL RADIOISOTOPES: COMPANY OVERVIEW
- TABLE 91 ECKERT & ZIEGLER: COMPANY OVERVIEW
- TABLE 92 PHARMALOGIC: COMPANY OVERVIEW
- TABLE 93 ECZACIBASI-MONROL: COMPANY OVERVIEW
- TABLE 94 ACROTECH BIOPHARMA, INC.: COMPANY OVERVIEW
- FIGURE 1 RESEARCH DESIGN METHODOLOGY
- FIGURE 2 BREAKDOWN OF PRIMARY INTERVIEWS: SUPPLY-SIDE AND DEMAND-SIDE PARTICIPANTS
- FIGURE 3 BREAKDOWN OF PRIMARY INTERVIEWS: BY COMPANY TYPE, DESIGNATION, AND REGION
- FIGURE 4 RESEARCH METHODOLOGY: HYPOTHESIS BUILDING
- FIGURE 5 COMPANY REVENUE ESTIMATION
- FIGURE 6 REVENUE SHARE ANALYSIS: ILLUSTRATIVE EXAMPLE OF BAYER AG
- FIGURE 7 BOTTOM-UP APPROACH: THERANOSTICS MARKET
- FIGURE 8 CAGR PROJECTIONS: SUPPLY-SIDE ANALYSIS
- FIGURE 9 DATA TRIANGULATION METHODOLOGY
- FIGURE 10 THERANOSTICS MARKET, BY PRODUCT, 2023 VS. 2028 (USD MILLION)
- FIGURE 11 THERANOSTICS MARKET, BY APPLICATION, 2023 VS. 2028 (USD MILLION)
- FIGURE 12 THERANOSTICS MARKET, BY END USER, 2023 VS. 2028 (USD MILLION)
- FIGURE 13 REGIONAL SNAPSHOT OF THERANOSTICS MARKET
- FIGURE 14 RISING PREVALENCE OF CANCER AND GROWING FOCUS ON PRECISION MEDICINE TO DRIVE MARKET
- FIGURE 15 RADIOPHARMACEUTICALS TO COMMAND LARGEST MARKET SHARE IN NORTH AMERICAN THERANOSTICS MARKET DURING FORECAST PERIOD
- FIGURE 16 PROSTATE CANCER TO REGISTER HIGHEST GROWTH RATE DURING STUDY PERIOD
- FIGURE 17 HOSPITALS AND CANCER CARE CENTERS TO COMMAND LARGEST SHARE IN ASIA PACIFIC MARKET DURING FORECAST PERIOD
- FIGURE 18 CHINA TO WITNESS HIGHEST GROWTH RATE DURING STUDY PERIOD
- FIGURE 19 DRIVERS, RESTRAINTS, OPPORTUNITIES, AND CHALLENGES: THERANOSTICS MARKET
- FIGURE 20 AVERAGE SELLING PRICE FOR RADIOPHARMACEUTICALS
- FIGURE 21 VALUE CHAIN ANALYSIS: THERANOSTICS MARKET
- FIGURE 22 SUPPLY CHAIN ANALYSIS: THERANOSTICS MARKET
- FIGURE 23 TOP 10 PATENT APPLICANTS FOR THERANOSTICS (JANUARY 2012–DECEMBER 2022)
- FIGURE 24 NORTH AMERICA: CANCER PREVALENCE, 2012–2020
- FIGURE 25 NORTH AMERICA: THERANOSTICS MARKET SNAPSHOT (2022)
- FIGURE 26 ASIA PACIFIC: CANCER PREVALENCE, 2012–2020
- FIGURE 27 ASIA PACIFIC: THERANOSTICS MARKET SNAPSHOT (2022)
- FIGURE 28 KEY STRATEGIES ADOPTED BY MAJOR PLAYERS IN THERANOSTICS MARKET
- FIGURE 29 REVENUE SHARE ANALYSIS OF TOP THREE PLAYERS, 2020–2022
- FIGURE 30 ADVANCED ACCELERATOR APPLICATIONS COMMANDED LARGEST MARKET SHARE IN 2022
- FIGURE 31 COMPANY EVALUATION MATRIX, 2022
- FIGURE 32 START-UP/SME EVALUATION MATRIX, 2022
- FIGURE 33 BAYER AG: COMPANY SNAPSHOT (2022)
- FIGURE 34 GE HEALTHCARE: COMPANY SNAPSHOT (2022)
- FIGURE 35 SIEMENS HEALTHINEERS AG: COMPANY SNAPSHOT (2022)
- FIGURE 36 CARDINAL HEALTH: COMPANY SNAPSHOT (2022)
- FIGURE 37 PHILIPS HEALTHCARE: COMPANY SNAPSHOT (2022)
- FIGURE 38 CANON INC.: COMPANY SNAPSHOT (2022)
- FIGURE 39 LANTHEUS: COMPANY SNAPSHOT (2022)
- FIGURE 40 ECKERT & ZIEGLER: COMPANY SNAPSHOT (2022)
The study involved four major activities in estimating the current size of the theranostics market. Exhaustive secondary research was done to collect information on the market, peer, and parent markets. The next step was to validate these findings, assumptions, and sizing with industry experts across the value chain through primary research. Both top-down and bottom-up approaches were employed to estimate the complete market size. After that, market breakdown and data triangulation were used to estimate the market size of segments and subsegments.
Secondary Research
The secondary research process involves the widespread use of secondary sources, directories, databases (such as Bloomberg Businessweek, Factiva, and D&B Hoovers), white papers, annual reports, company house documents, investor presentations, and SEC filings of companies. Secondary research was used to identify and collect information useful for the extensive, technical, market-oriented, and commercial theranostics market study. It was also used to obtain important information about the key players and market classification & segmentation according to industry trends to the bottom-most level, and key developments related to market and technology perspectives. A database of the key industry leaders was also prepared using secondary research.
Primary Research
In the primary research process, various supply and demand sources were interviewed to obtain qualitative and quantitative information for this report. The primary sources from the supply side include industry experts such as OEMs, CEOs, vice presidents, marketing and sales directors, technology & innovation directors, and related key executives from various key companies and organizations in the theranostics market. The primary sources from the demand side include medical CDMOs, oncologists, doctors, radiologists, technicians, and service providers. Primary research was conducted to validate the market segmentation, identify key players, and gather insights on key industry trends & key market dynamics.
A breakdown of the primary respondents is provided below:
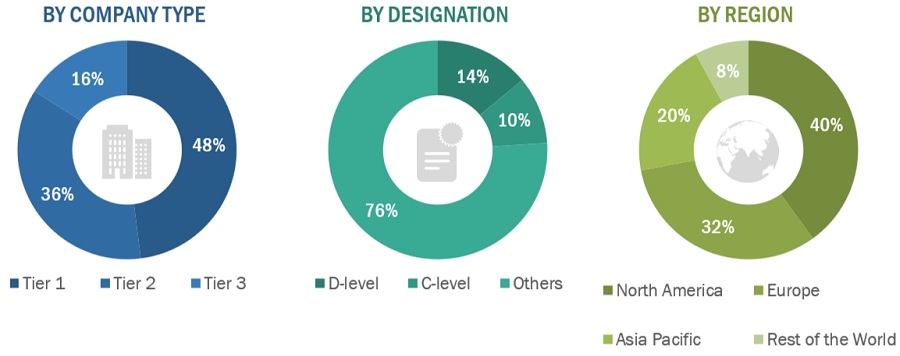
*Others include sales managers, marketing managers, business development managers, product managers, distributors, and suppliers.
Note: Companies are classified into tiers based on their total revenue. As of 2021, Tier 1 = >USD 1,000 million, Tier 2 = USD 500–1,000 million, and Tier 3 = <USD 500 million.
To know about the assumptions considered for the study, download the pdf brochure
Market Estimation Methodology
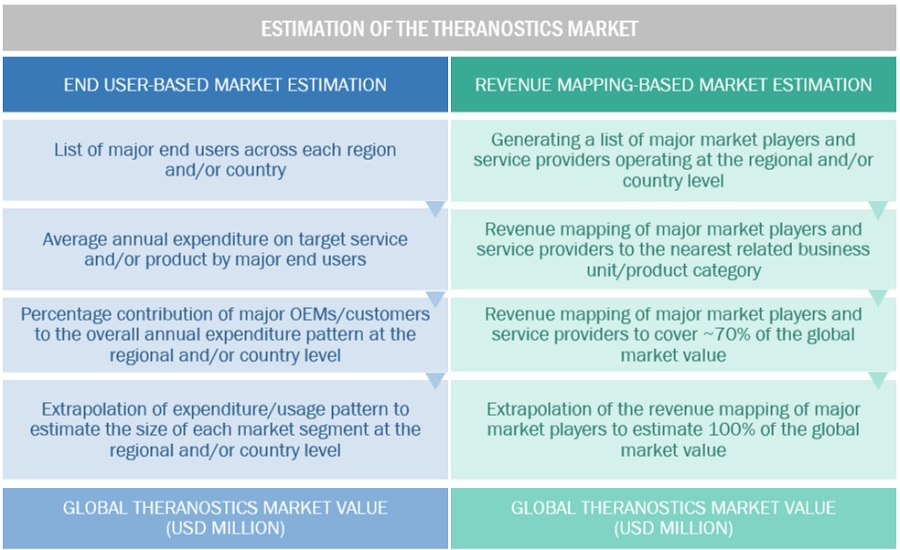
In this report, the theranostics market’s size was determined using the revenue share analysis of leading players. For this purpose, key players in the market were identified, and their revenues from the market business were determined through various insigh ts gathered during the primary and secondary research phases. Secondary research included the study of the annual and financial reports of the top market players. In contrast, primary research included extensive interviews with key opinion leaders, such as CEOs, directors, and key marketing executives.
Segmental revenues were calculated based on the revenue mapping of major solution/service providers to calculate the global market value. This process involved the following steps:
- Generating a list of major global players operating in the theranostics market.
- Mapping annual revenues generated by major global players from the product segment (or nearest reported business unit/category)
- Revenue mapping of major players to cover a major share of the global market share, as of 2022
- Extrapolating the global value of the theranostics market industry
Data Triangulation
After arriving at the overall market size from the market size estimation process explained above, the global theranostics market was split into segments and subsegments. Data triangulation and market breakdown procedures were employed to complete the overall market engineering process and arrive at the exact statistics for all segments and subsegments. The data was triangulated by studying various factors and trends from both the demand and supply sides. Additionally, the market was validated using top-down and bottom-up approaches.
Market Definition
Theranostics is a term used for diagnosis and therapy. Theranostics can be broadly defined as a combination of molecularly targeted imaging and therapy, whereas imaging helps to gain information regarding presence of targeted moleculaes on cell surface and therapy progression. Radiotheranostics involves the use of radionuclide/radiopharmaceutical that delivers targeted radiation to kill the cancerous cells and imaging modality such as positron emission tomography (PET) is used to locate the cancer. FDA approved theranostics procedures are performed for different applications such as prostate cancer, neuroendocrine tumor, etc. These procedures are mainly performed in hospitals, cancer care centers, and theranostics centers.
Key Stakeholders
- Senior Management
- End Users
- R&D Department
- Finance/Procurement Department
Objectives of the Study
- To define, describe, and forecast the size of theranostics market based on product, application, end user, and region
- To provide detailed information regarding the major factors influencing the growth potential of the global market (drivers, restraints, opportunities, challenges, and trends)
- To analyze the micro markets with respect to individual growth trends, prospects, and contributions to the global market.
- To analyze key growth opportunities in the global market for key stakeholders and provide details of the competitive landscape for market leaders
- To forecast the size of market segments and/or subsegments with respect to three major regions, namely, North America (US and Canada), Europe (Germany, France, the UK, and the RoE), Asia Pacific (Japan, China, India, and the RoAPAC), and Rest of the World (Latin America and Middle East and Africa).
- To profile the key players in the market and comprehensively analyze their market shares and core competencies.
- To track and analyze the competitive developments undertaken in the global market, such as product launches; agreements; expansions; and mergers & acquisitions.
Available Customizations
With the given market data, MarketsandMarkets offers customizations per the company’s specific needs. The following customization options are available for the present global theranostics market report:
Product Analysis
- Product matrix, which gives a detailed comparison of the product portfolios of the top fifteen companies
Company Information
- Detailed analysis and profiling of additional market players (up to five)
Geographic Analysis
- Further breakdown of the Rest of Europe theranostics market into Italy, Spain Russia, Belgium, the Netherlands, Switzerland, Austria, Finland, Sweden, Poland, and Portugal, among others
- Further breakdown of the Rest of Asia Pacific theranostics market into Australia, South Korea, Singapore, Taiwan, New Zealand, Philippines, Malaysia, and other APAC countries


Growth opportunities and latent adjacency in Theranostics Market