Contactless Connector Market Size, Share, Trends

Contactless Connector Market by Product Type (Wireless Charging, Wireless Data Transfer), Technology (Inductive Coupling, RF, Magnetic Field), Operation (Simplex, Half-duplex, Full-duplex), Data Rate Gbps (1, 3, Up to 6) - Global Forecast to 2029

Report Code: SE 8957 Feb, 2024, by marketsandmarkets.com

Updated on : October 23, 2024

Contactless Connector Market Size & Growth

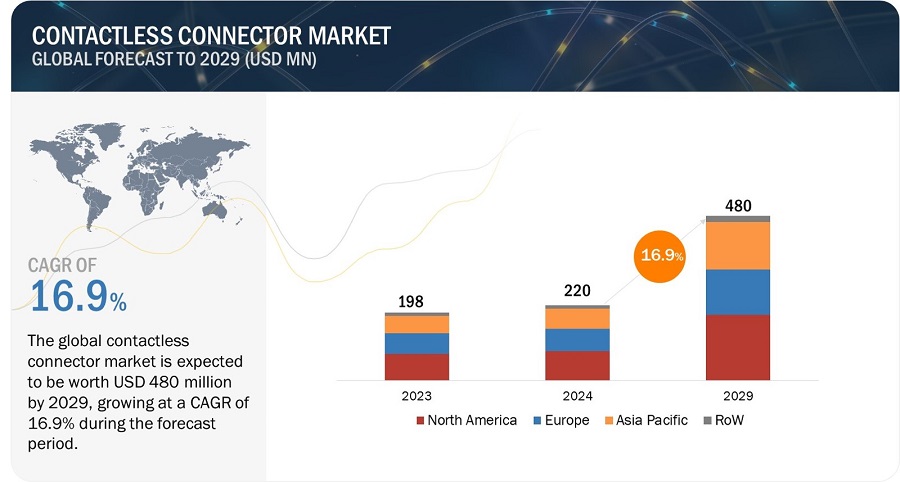
[217 Pages Report] The global contactless connector market size is expected to be valued at USD 220 million in 2024 and is projected to reach USD 480 million by 2029, growing at a CAGR of 16.9% from 2024 to 2029. The growing popularity of wireless charging technology in consumer electronics, automotive, and other industries fuels the demand for contactless connectors. Wireless charging offers users a convenient and cable-free way to power their devices, enhancing user experience and convenience. Contactless connectors enable wireless charging by facilitating power transmission between the charging pad or dock and the device, thereby driving market demand.
Contactless Connector Market

Contactless Connector Market

Contactless Connector Market Forecast to 2029

To know about the assumptions considered for the study, Request for Free Sample Report

Contactless Connector Market Trends 

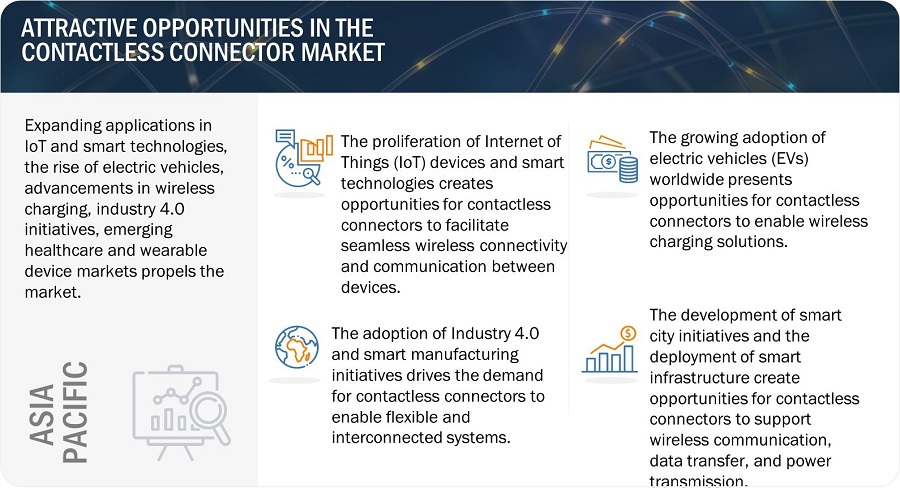
Driver: Increasing adoption of Internet of Things (IoT) devices across various industries

The increasing adoption of IoT devices drives the contactless connector market by creating a demand for seamless wireless connectivity solutions. Contactless connectors play a pivotal role in facilitating the communication and data exchange between IoT devices, enabling the integration of diverse sensors, actuators, and controllers without the constraints of physical connections. This trend is fueled by the need for flexible and interconnected systems that can support the growing complexity and scale of IoT deployments, thereby driving the expansion of the contactless connector market.

Restraint: Risk of system vulnerabilities and exploits

The risk of system vulnerabilities poses a restraint for the contactless connector market as it raises concerns about potential security breaches and data integrity issues. With wireless communication and data transfer integral to contactless connectors, vulnerabilities such as unauthorized access, interception of data, and malicious attacks become significant risks. Addressing these concerns requires robust encryption protocols, authentication mechanisms, and cybersecurity measures to ensure the integrity and security of data transmission, which may increase the complexity and cost of implementing contactless connector solutions, thus restraining market growth.

Opportunity: The evolution of smart homes and the increasing demand for connected consumer electronics devices

The evolution of smart homes and the growing demand for connected devices present significant opportunities for the contactless connector market. As smart home ecosystems become more prevalent, contactless connectors enable seamless wireless connectivity between various devices, sensors, and appliances, facilitating interoperability and enhancing user experience. With the increasing adoption of connected devices such as smart thermostats, security cameras, and voice assistants, the demand for contactless connectors grows as they enable convenient and reliable communication without the constraints of physical connections, positioning the market for substantial growth in the burgeoning smart home industry.

Challenge: Risk of rapid technological changes and obsolescence

The risk of rapid technological changes and obsolescence poses a significant challenge for the contactless connector market as advancements in wireless communication, power transfer, and data transmission technologies may quickly render existing connector solutions outdated. This challenge necessitates continuous innovation and adaptation to emerging technologies to stay competitive and meet evolving customer demands. Moreover, the lifecycle of contactless connector products may be shortened due to rapid technological obsolescence, requiring manufacturers to invest in research and development to maintain relevance in the dynamic market landscape. Additionally, the risk of investing in outdated technology could deter potential adopters, further complicating market growth.

Contactless Connector Market Ecosystem

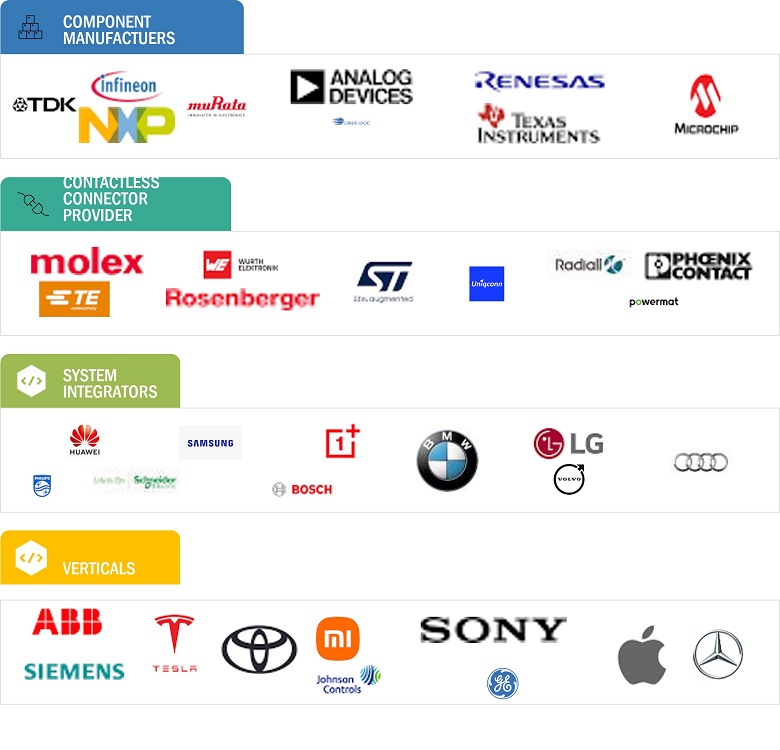
The contactless connector market is dominated by established and financially sound manufacturers with extensive experience in the industry. These companies have diversified product portfolios, cutting-edge technologies, and strong global sales and marketing networks. Leading players in the market include STMicroelectronics from Switzerland, TE Connectivity from Switzerland, Molex from the US, Rosenberger Hochfrequenztechnik GmbH & Co. KG from  Germany, and Radiall from France.
Contactless Connector Market by Ecosystem

Contactless Connector Market Share

Based on the product type, wireless charging connectors hold the highest market share during the forecast period

the expanding ecosystem of smart home devices and IoT gadgets creates additional opportunities for wireless charging connectors. With the proliferation of connected devices in homes and workplaces, there's a growing need for seamless charging solutions that can accommodate multiple devices simultaneously, further driving the demand for wireless charging connectors. Overall, the increasing popularity of smart devices plays a significant role in driving the adoption of wireless charging technology and, consequently, the growth of the wireless charging connector market.

Based on technology, the contactless connector market for inductive coupling to hold the highest market share during the forecast period

The contactless connector market for inductive coupling technology is growing due to several key factors. The increasing adoption of electric vehicles (EVs) and the need for wireless charging solutions in automotive applications are driving the expansion of the contactless connector market for inductive coupling technology. Inductive coupling technology enables convenient and efficient charging of EVs without the need for cumbersome cables, thus improving user experience and promoting the widespread adoption of electric vehicles.

Based on data rate, the contactless connector market for 1 Gbps data rate to hold the highest market share during the forecast period

the proliferation of IoT devices, smart technologies, and edge computing applications drives the need for high-speed connectivity solutions capable of handling large volumes of data generated by sensors, devices, and systems. Contactless connectors with 1 Gbps data rates enable efficient communication between IoT devices, edge servers, and cloud platforms, facilitating the deployment of smart city, industrial automation, and IoT solutions. Additionally, the evolution of wireless communication standards such as Wi-Fi 6 (802.11ax) and 5G technology is driving the demand for contactless connectors indsutry capable of supporting higher data rates to meet the requirements of next-generation wireless networks.

Based on vertical, the contactless connector for consumer electronics to hold the highest market share during the forecast period

Rapid technological advancements in the contactless connector market drive growth in the consumer electronics vertical by enabling innovative features and enhancing user experience. These advancements include data transfer speeds, efficiency, reliability, and compatibility improvements. As consumers increasingly demand high-performance and convenient solutions, such as wireless charging, seamless data transfer, and compact designs, technological advancements in contactless connectors enable manufacturers to meet these expectations and differentiate their products in a competitive market.

Contactless Connector Market Regional Analysis

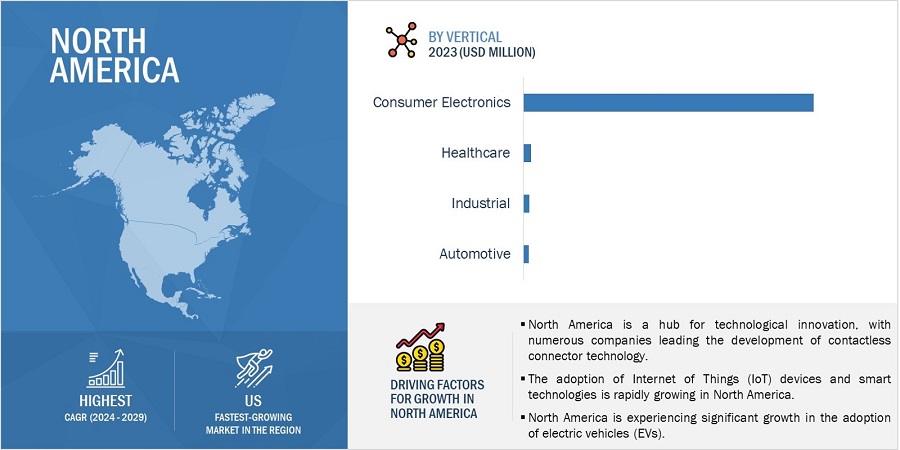
Contactless connector market in North America to hold the highest market share during the forecast period

Increasing infrastructure investment in North America drives the contactless connector market by creating opportunities to deploy contactless technologies in various sectors. This investment includes the development of wireless charging infrastructure for electric vehicles, smart city initiatives, and expanding telecommunications networks. Contactless connectors enable seamless communication, data transfer, and power transmission in these infrastructure projects, driving the demand for contactless connector solutions. As North America invests in building smart and sustainable infrastructure, the need for reliable and efficient contactless connectors increases, stimulating market growth in the region.
Contactless Connector Market
 by Region

Contactless Connector Market by Region

To know about the assumptions considered for the study, download the pdf brochure

Top Contactless Connector Companies - Key Market Players:

The contactless connector companies is dominated by players such as

Contactless Connector Market Report Scope : 

Report Metric

Details

Estimated Market Size USD 220 million in 2024
Projected Market Size  USD 480 million by 2029
Growth Rate  At CAGR of 16.9%

Market size available for years

2020-2029

Base year considered

2023

Forecast period

2024-2029

Forecast units

Value (USD Million)

Segments Covered

  • By Product Type,
  • By Technology,
  • By Data Rate,
  • By Mode of Operation, and
  • By Vertical

Geographies covered

  • North America,
  • Europe,
  • Asia Pacific, and RoW

Companies covered

The major market players include STMicroelectronics (Switzerland), TE Connectivity (Switzerland), Molex (US), Rosenberger Hochfrequenztechnik GmbH & Co. KG (Germany), Radiall (France), Weidmüller (Germany),  Uniqconn Inc. (South Korea), Phoenix Contact (Germany), Commscope (US), Omega Engineering Inc. (US). (Total 25 players are profiled)

Contactless Connector Market Highlights

The study categorizes the contactless connector market based on the following segments:

Segment

Subsegment

By Product Type

  • Wireless Charging Connectors
  • Wireless Data Transfer Connectors
    • NFC Connectors
    • RFID Connectors
    • Others

By Technology

  • Inductive Coupling
  • Radio Frequency
  • Magnetic Field

By Data Rate

  • 1 Gbps
  • 3 Gbps
  • Up to 6 Gbps

By Mode of Operation

  • Simplex Connectivity
  • Half-duplex Connectivity
  • Full-duplex Connectivity

By Vertical

  • Consumer Electronics
  • Automotive
  • Healthcare
  • Industrial

By Rregion

  • North America
  • Europe
  • Asia Pacific
  • RoW

Recent Developments In Contactless Connector Industry  

  • In September 2023, Molex introduced the MX60 series of contactless connectivity solutions. These low-power, high-speed, solid-state devices feature miniaturized mmWave RF transceivers and built-in antennas in one package for faster, simpler, device-to-device communications without physical cables or connectors.

Frequently Asked Questions:

To speak to our analyst for a discussion on the above findings, click Speak to Analyst

Exclusive indicates content/data unique to MarketsandMarkets and not available with any competitors.

TABLE OF CONTENTS
 
1 INTRODUCTION (Page No. - 29)
    1.1 STUDY OBJECTIVES 
    1.2 MARKET DEFINITION 
           1.2.1 INCLUSIONS AND EXCLUSIONS
    1.3 STUDY SCOPE 
           1.3.1 MARKETS COVERED
                    FIGURE 1 CONTACTLESS CONNECTOR MARKET SEGMENTATION
           1.3.2 REGIONAL SCOPE
           1.3.3 YEARS CONSIDERED
           1.3.4 CURRENCY CONSIDERED
           1.3.5 UNITS CONSIDERED
    1.4 LIMITATIONS 
    1.5 STAKEHOLDERS 
    1.6 RECESSION IMPACT 
 
2 RESEARCH METHODOLOGY (Page No. - 34)
    2.1 RESEARCH DATA 
           FIGURE 2 CONTACTLESS CONNECTOR MARKET: RESEARCH DESIGN
           2.1.1 SECONDARY DATA
                    2.1.1.1 List of major secondary sources
                    2.1.1.2 Key data from secondary sources
           2.1.2 PRIMARY DATA
                    2.1.2.1 List of key participants for primary interviews
                    2.1.2.2 Key data from primary sources
                    2.1.2.3 Key industry insights
                    2.1.2.4 Breakdown of primaries
           2.1.3 SECONDARY AND PRIMARY RESEARCH
    2.2 MARKET SIZE ESTIMATION 
           FIGURE 3 CONTACTLESS CONNECTOR MARKET: RESEARCH FLOW
           FIGURE 4 MARKET SIZE ESTIMATION METHODOLOGY (SUPPLY SIDE): REVENUE FROM SALES OF CONTACTLESS CONNECTORS
           2.2.1 BOTTOM-UP APPROACH
                    2.2.1.1 Approach to estimate market size using bottom-up analysis (demand side)
                               FIGURE 5 MARKET SIZE ESTIMATION METHODOLOGY: BOTTOM-UP APPROACH
           2.2.2 TOP-DOWN APPROACH
                    2.2.2.1 Approach to estimate market size using top-down analysis (supply side)
                               FIGURE 6 MARKET SIZE ESTIMATION METHODOLOGY: TOP-DOWN APPROACH
    2.3 DATA TRIANGULATION 
           FIGURE 7 DATA TRIANGULATION
    2.4 RESEARCH ASSUMPTIONS 
    2.5 RISK ASSESSMENT 
    2.6 PARAMETERS CONSIDERED TO ANALYZE IMPACT OF RECESSION ON STUDIED MARKET 
    2.7 RESEARCH LIMITATIONS 
 
3 EXECUTIVE SUMMARY (Page No. - 48)
    FIGURE 8 WIRELESS CHARGING CONNECTORS SEGMENT TO HOLD LARGEST MARKET SHARE DURING FORECAST PERIOD
    FIGURE 9 RADIO FREQUENCY TECHNOLOGY TO LEAD MARKET DURING FORECAST PERIOD
    FIGURE 10 CONSUMER ELECTRONICS SEGMENT TO CAPTURE LARGEST MARKET SHARE IN 2029
    FIGURE 11 NORTH AMERICA ACCOUNTED FOR LARGEST MARKET SHARE IN 2023
 
4 PREMIUM INSIGHTS (Page No. - 51)
    4.1 ATTRACTIVE OPPORTUNITIES FOR PLAYERS IN CONTACTLESS CONNECTOR MARKET 
           FIGURE 12 PROLIFERATION OF IOT DEVICES ACROSS VARIOUS INDUSTRIES TO OFFER LUCRATIVE GROWTH OPPORTUNITIES
    4.2 CONTACTLESS CONNECTOR MARKET IN ASIA PACIFIC, BY COUNTRY AND SYSTEM 
           FIGURE 13 CHINA AND CONSUMER ELECTRONICS SEGMENTS TO HOLD LARGEST MARKET SHARES IN ASIA PACIFIC CONTACTLESS CONNECTOR MARKET IN 2024
    4.3 CONTACTLESS CONNECTOR MARKET IN NORTH AMERICA, BY COUNTRY 
           FIGURE 14 US TO HOLD LARGEST MARKET SHARE IN NORTH AMERICAN CONTACTLESS CONNECTOR MARKET DURING FORECAST PERIOD
    4.4 CONTACTLESS CONNECTOR MARKET, BY COUNTRY 
           FIGURE 15 CHINA TO REGISTER HIGHEST CAGR IN CONTACTLESS CONNECTOR MARKET DURING FORECAST PERIOD
 
5 MARKET OVERVIEW (Page No. - 54)
    5.1 INTRODUCTION 
    5.2 MARKET DYNAMICS 
           FIGURE 16 CONTACTLESS CONNECTOR MARKET: DRIVERS, RESTRAINTS, OPPORTUNITIES, AND CHALLENGES
           5.2.1 DRIVERS
                    5.2.1.1 Increasing adoption of IoT devices in various industries
                    5.2.1.2 Growing popularity of wireless charging technologies
                    5.2.1.3 Increased use of digital technologies and data-driven processes in manufacturing
                    5.2.1.4 Advent of 5G and Wi-Fi 6
                               FIGURE 17 IMPACT ANALYSIS: DRIVERS
           5.2.2 RESTRAINTS
                    5.2.2.1 Lack of standardized protocols
                    5.2.2.2 Risk of system vulnerabilities
                    5.2.2.3 High initial investment
                               FIGURE 18 IMPACT ANALYSIS: RESTRAINTS
           5.2.3 OPPORTUNITIES
                    5.2.3.1 Evolution of smart homes
                    5.2.3.2 Government initiatives to develop smart cities and enhance urban infrastructure
                    5.2.3.3 Growing demand for connected devices and medical equipment in healthcare sector
                               FIGURE 19 IMPACT ANALYSIS: OPPORTUNITIES
           5.2.4 CHALLENGES
                    5.2.4.1 Risk of rapid technological changes and obsolescence
                    5.2.4.2 Complexities in integrating contactless connectors with existing infrastructure
                               FIGURE 20 IMPACT ANALYSIS: CHALLENGES
    5.3 TRENDS/DISRUPTIONS IMPACTING CUSTOMERS’ BUSINESSES 
           FIGURE 21 TRENDS/DISRUPTIONS IMPACTING CUSTOMERS’ BUSINESSES
    5.4 PRICING ANALYSIS 
           5.4.1 AVERAGE SELLING PRICE (ASP) TREND OF CONTACTLESS CONNECTORS, BY DATA RATE
                    5.4.1.1 Average selling price (ASP) trend of contactless connectors, by data rate
           5.4.2 AVERAGE SELLING PRICE (ASP) TREND OF CONTACTLESS CONNECTORS, BY REGION (USD)
    5.5 VALUE CHAIN ANALYSIS 
           FIGURE 22 CONTACTLESS CONNECTOR MARKET: VALUE CHAIN ANALYSIS
    5.6 ECOSYSTEM ANALYSIS 
           FIGURE 23 CONTACTLESS CONNECTOR ECOSYSTEM ANALYSIS
           TABLE 1 ROLE OF COMPANIES IN CONTACTLESS CONNECTOR ECOSYSTEM
    5.7 INVESTMENT AND FUNDING SCENARIO 
           FIGURE 24 DEALS IN CONTACTLESS CONNECTOR MARKET
           FIGURE 25 FUNDING IN CONTACTLESS CONNECTOR MARKET
    5.8 TECHNOLOGY ANALYSIS 
           5.8.1 KEY TECHNOLOGIES
                    5.8.1.1 NFC
                    5.8.1.2 RFID
                    5.8.1.3 Bluetooth low energy
                    5.8.1.4 Wireless charging
           5.8.2 COMPLEMENTARY TECHNOLOGIES
                    5.8.2.1 Inductive coupling
                    5.8.2.2 Zigbee
                    5.8.2.3 Wi-Fi
           5.8.3 ADJACENT TECHNOLOGIES
                    5.8.3.1 Printed electronics
                    5.8.3.2 Advanced materials
                    5.8.3.3 MEMS
    5.9 PATENT ANALYSIS 
           FIGURE 26 NUMBER OF PATENTS GRANTED IN CONTACTLESS CONNECTOR MARKET, 2013–2023
           TABLE 2 LIST OF PATENTS IN CONTACTLESS CONNECTOR MARKET, 2020–2023
    5.1 TRADE ANALYSIS 
           TABLE 3 IMPORT DATA FOR HS CODE 853690-COMPLIANT PRODUCTS, BY COUNTRY, 2018–2022 (USD MILLION)
           FIGURE 27 IMPORT DATA FOR HS CODE 853690-COMPLIANT PRODUCTS, BY COUNTRY, 2018–2022 (USD MILLION)
           TABLE 4 EXPORT DATA FOR HS CODE 853690-COMPLIANT PRODUCTS, BY COUNTRY, 2018–2022 (USD MILLION)
           FIGURE 28 EXPORT DATA FOR HS CODE 853690-COMPLIANT PRODUCTS, BY COUNTRY, 2018–2022 (USD MILLION)
    5.11 TARIFF ANALYSIS 
           TABLE 5 MFN TARIFF LEVIED ON HS CODE 853690-COMPLIANT PRODUCTS EXPORTED BY US
           TABLE 6 MFN TARIFF LEVIED ON HS CODE 853690-COMPLIANT PRODUCTS EXPORTED BY CHINA
           TABLE 7 MFN TARIFF LEVIED ON HS CODE 853690-COMPLIANT PRODUCTS EXPORTED BY GERMANY
    5.12 KEY CONFERENCES AND EVENTS, 2024–2025 
           TABLE 8 CONTACTLESS CONNECTOR MARKET: LIST OF CONFERENCES AND EVENTS, 2024–2025
    5.13 CASE STUDY ANALYSIS 
           TABLE 9 NEST COLLABORATES WITH PHILIPS HUE TO ENABLE SEAMLESS CONNECTIVITY BETWEEN NEST SMART HOME DEVICES AND PHILIPS HUE SMART LIGHTING SYSTEMS
           TABLE 10 BMW COLLABORATES WITH QUALCOMM TECHNOLOGIES TO INTEGRATE CONTACTLESS CHARGING TECHNOLOGY INTO BMW'S ELECTRIC VEHICLES
           TABLE 11 FITBIT INC. COLLABORATES WITH SEVERAL HEALTHCARE PROVIDERS TO INTEGRATE CONTACTLESS CONNECTORS INTO ITS DEVICES FOR HEALTH MONITORING APPLICATIONS
           TABLE 12 WITHINGS COLLABORATES WITH MAYO CLINIC TO DEVELOP INNOVATIVE HEALTH MONITORING SOLUTIONS USING IOT DEVICES
           TABLE 13 SIEMENS AND BOSCH REXROTH COLLABORATE TO DEPLOY WIRELESS SENSOR NETWORKS IN INDUSTRIAL AUTOMATION SETTINGS
    5.14 STANDARDS AND REGULATORY LANDSCAPE 
           5.14.1 REGULATORY BODIES, GOVERNMENT AGENCIES, AND OTHER ORGANIZATIONS
                    TABLE 14 NORTH AMERICA: LIST OF REGULATORY BODIES, GOVERNMENT AGENCIES, AND OTHER ORGANIZATIONS
                    TABLE 15 EUROPE: LIST OF REGULATORY BODIES, GOVERNMENT AGENCIES, AND OTHER ORGANIZATIONS
                    TABLE 16 ASIA PACIFIC: LIST OF REGULATORY BODIES, GOVERNMENT AGENCIES, AND OTHER ORGANIZATIONS
                    TABLE 17 ROW: LIST OF REGULATORY BODIES, GOVERNMENT AGENCIES, AND OTHER ORGANIZATIONS
           5.14.2 STANDARDS AND REGULATIONS
                    5.14.2.1 ISO/IEC 14443 - Identification cards - Contactless integrated circuit cards - Proximity cards
                    5.14.2.2 ISO/IEC 18092 - Information technology - Telecommunications and information exchange between systems - Near Field Communication - Interface and Protocol (NFCIP-1)
                    5.14.2.3 ISO/IEC 15693 - Identification cards - Contactless integrated circuit(s) cards - Vicinity cards
                    5.14.2.4 FCC Part 15 - Radio Frequency Devices
                    5.14.2.5 CE Marking (Europe)
    5.15 PORTER'S FIVE FORCES ANALYSIS 
           TABLE 18 CONTACTLESS CONNECTOR MARKET: PORTER'S FIVE FORCES ANALYSIS
           FIGURE 29 CONTACTLESS CONNECTOR MARKET: PORTER'S FIVE FORCES ANALYSIS
           5.15.1 THREAT OF NEW ENTRANTS
           5.15.2 THREAT OF SUBSTITUTES
           5.15.3 BARGAINING POWER OF SUPPLIERS
           5.15.4 BARGAINING POWER OF BUYERS
           5.15.5 INTENSITY OF COMPETITIVE RIVALRY
    5.16 KEY STAKEHOLDERS AND BUYING PROCESS 
           5.16.1 KEY STAKEHOLDERS IN BUYING PROCESS
                    FIGURE 30 INFLUENCE OF STAKEHOLDERS ON BUYING PROCESS FOR TOP THREE VERTICALS
                    TABLE 19 INFLUENCE OF STAKEHOLDERS ON BUYING PROCESS FOR TOP THREE VERTICALS
           5.16.2 BUYING CRITERIA
                    FIGURE 31 KEY BUYING CRITERIA, BY VERTICAL
                    TABLE 20 KEY BUYING CRITERIA, BY VERTICAL
 
6 CONTACTLESS CONNECTOR MARKET, BY PRODUCT TYPE (Page No. - 87)
    6.1 INTRODUCTION 
           FIGURE 32 WIRELESS CHARGING CONNECTORS SEGMENT TO SECURE LARGEST MARKET SHARE IN 2029
           TABLE 21 CONTACTLESS CONNECTOR MARKET, BY PRODUCT TYPE, 2020–2023 (USD MILLION)
           TABLE 22 CONTACTLESS CONNECTOR MARKET, BY PRODUCT TYPE, 2024–2029 (USD MILLION)
    6.2 WIRELESS CHARGING CONNECTORS 
           6.2.1 INCREASING APPLICATION IN CONSUMER ELECTRONICS AND AUTOMOTIVE INDUSTRIES TO BOOST DEMAND
    6.3 WIRELESS DATA TRANSFER CONNECTORS 
           6.3.1 NEAR FIELD COMMUNICATION CONNECTORS
                    6.3.1.1 Low power consumption and compatibility with various devices to foster segmental growth
           6.3.2 RADIO FREQUENCY IDENTIFICATION CONNECTORS
                    6.3.2.1 Rising application in inventory management for real-time tracking of products to drive market
           6.3.3 OTHERS
 
7 CONTACTLESS CONNECTOR MARKET, BY TECHNOLOGY (Page No. - 91)
    7.1 INTRODUCTION 
           FIGURE 33 RADIO FREQUENCY SEGMENT TO DOMINATE MARKET DURING FORECAST PERIOD
           TABLE 23 CONTACTLESS CONNECTOR MARKET, BY TECHNOLOGY, 2020–2023 (USD MILLION)
           TABLE 24 CONTACTLESS CONNECTOR MARKET, BY TECHNOLOGY, 2024–2029 (USD MILLION)
    7.2 INDUCTIVE COUPLING 
           7.2.1 ABILITY TO PROVIDE CONVENIENT AND CABLE-FREE CHARGING SOLUTION FOR ELECTRONIC DEVICES TO DRIVE MARKET
                    TABLE 25 INDUCTIVE COUPLING: CONTACTLESS CONNECTOR MARKET, BY VERTICAL, 2020–2023 (USD MILLION)
                    TABLE 26 INDUCTIVE COUPLING: CONTACTLESS CONNECTOR MARKET, BY VERTICAL, 2024–2029 (USD MILLION)
    7.3 RADIO FREQUENCY 
           7.3.1 RISING APPLICATIONS IN IN-CAR ENTERTAINMENT SYSTEMS AND VEHICLE-TO-VEHICLE COMMUNICATION TO BOOST DEMAND
                    TABLE 27 RADIO FREQUENCY: CONTACTLESS CONNECTOR MARKET, BY VERTICAL, 2020–2023 (USD MILLION)
                    TABLE 28 RADIO FREQUENCY: CONTACTLESS CONNECTOR MARKET, BY VERTICAL, 2024–2029 (USD MILLION)
    7.4 MAGNETIC FIELD 
           7.4.1 GROWING APPLICATION IN SMARTPHONES AND CHARGING PADS TO DRIVE MARKET
                    TABLE 29 MAGNETIC COUPLING: CONTACTLESS CONNECTOR MARKET, BY VERTICAL, 2020–2023 (USD MILLION)
                    TABLE 30 MAGNETIC COUPLING: CONTACTLESS CONNECTOR MARKET, BY VERTICAL, 2024–2029 (USD MILLION)
 
8 CONTACTLESS CONNECTOR MARKET, BY DATA RATE (Page No. - 97)
    8.1 INTRODUCTION 
           FIGURE 34 1 GBPS DATA RATE SEGMENT TO HOLD LARGEST MARKET SHARE IN 2024
           TABLE 31 CONTACTLESS CONNECTOR MARKET, BY DATA RATE, 2020–2023 (USD MILLION)
           TABLE 32 CONTACTLESS CONNECTOR MARKET, BY DATA RATE, 2024–2029 (USD MILLION)
           TABLE 33 CONTACTLESS CONNECTOR MARKET, BY DATA RATE, 2020–2023 (MILLION UNITS)
           TABLE 34 CONTACTLESS CONNECTOR MARKET, BY DATA RATE, 2024–2029 (MILLION UNITS)
    8.2 1 GBPS 
           8.2.1 RISING POPULARITY OF HIGH-DEFINITION VIDEOS, ONLINE GAMING, AND CLOUD-BASED SERVICES TO BOOST DEMAND
    8.3 3 GBPS 
           8.3.1 INCREASING DEMAND FOR HIGH-SPEED CONNECTIVITY IN AUTOMOTIVE APPLICATIONS TO FOSTER SEGMENTAL GROWTH
    8.4 UP TO 6 GBPS 
           8.4.1 ABILITY TO PROVIDE HIGH-SPEED COMMUNICATION WITHOUT PHYSICAL CONNECTION TO DRIVE DEMAND
 
9 MODES OF OPERATION OF CONTACTLESS CONTACTORS (Page No. - 101)
    9.1 INTRODUCTION 
    9.2 SIMPLEX CONNECTIVITY 
           9.2.1 CAPIBILITY TO PERFORM COST-EFFECTIVE UNIDIRECTIONAL DATA TRANSMISSION TO DRIVE MARKET
    9.3 HALF-DUPLEX CONNECTIVITY 
           9.3.1 GROWING APPLICATION IN WALKIE-TALKIES AND INTERCOM SYSTEMS TO BOOST DEMAND
    9.4 FULL-DUPLEX CONNECTIVITY 
           9.4.1 ABILITY TO OFFER HIGH-SPEED CONNECTIVITY FOR VOICE, DATA, AND VIDEO SERVICES TO FOSTER SEGMENTAL GROWTH
 
10 CONTACTLESS CONNECTOR MARKET, BY VERTICAL (Page No. - 103)
     10.1 INTRODUCTION 
              FIGURE 35 AUTOMOTIVE SEGMENT TO DISPLAY HIGHEST CAGR DURING FORECAST PERIOD
              TABLE 35 CONTACTLESS CONNECTOR MARKET, BY VERTICAL, 2020–2023 (USD MILLION)
              TABLE 36 CONTACTLESS CONNECTOR MARKET, BY VERTICAL, 2024–2029 (USD MILLION)
     10.2 CONSUMER ELECTRONICS 
             10.2.1 PROLIFERATION OF IOT AND SMART TECHNOLOGIES IN CONSUMER ELECTRONICS TO BOOST DEMAND
             10.2.2 CASE STUDY: XIAOMI CORPORATION COLLABORATES WITH ENERGOUS CORPORATION FOR CONTACTLESS WIRELESS CHARGING TECHNOLOGY
                        TABLE 37 CONSUMER ELECTRONICS: CONTACTLESS CONNECTOR MARKET, BY TECHNOLOGY, 2020–2023 (USD MILLION)
                        TABLE 38 CONSUMER ELECTRONICS: CONTACTLESS CONNECTOR MARKET, BY TECHNOLOGY, 2024–2029 (USD MILLION)
                        TABLE 39 CONSUMER ELECTRONICS: CONTACTLESS CONNECTOR MARKET, BY REGION, 2020–2023 (USD MILLION)
                        TABLE 40 CONSUMER ELECTRONICS: CONTACTLESS CONNECTOR MARKET, BY REGION, 2024–2029 (USD MILLION)
                        TABLE 41 CONSUMER ELECTRONICS: CONTACTLESS CONNECTOR MARKET, BY NORTH AMERICA, 2020–2023 (USD MILLION)
                        TABLE 42 CONSUMER ELECTRONICS: CONTACTLESS CONNECTOR MARKET, BY NORTH AMERICA, 2024–2029 (USD MILLION)
                        TABLE 43 CONSUMER ELECTRONICS: CONTACTLESS CONNECTOR MARKET, BY EUROPE, 2020–2023 (USD MILLION)
                        TABLE 44 CONSUMER ELECTRONICS: CONTACTLESS CONNECTOR MARKET, BY EUROPE, 2024–2029 (USD MILLION)
                        TABLE 45 CONSUMER ELECTRONICS: CONTACTLESS CONNECTOR MARKET, BY ASIA PACIFIC, 2020–2023 (USD MILLION)
                        TABLE 46 CONSUMER ELECTRONICS: CONTACTLESS CONNECTOR MARKET, BY ASIA PACIFIC, 2024–2029 (USD MILLION)
                        TABLE 47 CONSUMER ELECTRONICS: CONTACTLESS CONNECTOR MARKET, BY ROW, 2020–2023 (USD MILLION)
                        TABLE 48 CONSUMER ELECTRONICS: CONTACTLESS CONNECTOR MARKET, BY ROW, 2024–2029 (USD MILLION)
     10.3 AUTOMOTIVE 
             10.3.1 SHIFT FROM FUEL-BASED VEHICLES TO EVS AND AVS TO FOSTER SEGMENTAL GROWTH
             10.3.2 CASE STUDY: BMW GROUP PARTNERS WITH QUALCOMM TECHNOLOGIES TO INTRODUCE WIRELESS CHARGING TECHNOLOGY FOR HYBRID ELECTRIC VEHICLES
                        TABLE 49 AUTOMOTIVE: CONTACTLESS CONNECTOR MARKET, BY TECHNOLOGY, 2020–2023 (USD MILLION)
                        TABLE 50 AUTOMOTIVE: CONTACTLESS CONNECTOR MARKET, BY TECHNOLOGY, 2024–2029 (USD MILLION)
                        TABLE 51 AUTOMOTIVE CONTACTLESS CONNECTOR MARKET, BY REGION, 2020–2023 (USD MILLION)
                        TABLE 52 AUTOMOTIVE: CONTACTLESS CONNECTOR MARKET, BY REGION, 2024–2029 (USD MILLION)
                        TABLE 53 AUTOMOTIVE: CONTACTLESS CONNECTOR MARKET, BY NORTH AMERICA, 2020–2023 (USD THOUSAND)
                        TABLE 54 AUTOMOTIVE: CONTACTLESS CONNECTOR MARKET, BY NORTH AMERICA, 2024–2029 (USD THOUSAND)
                        TABLE 55 AUTOMOTIVE: CONTACTLESS CONNECTOR MARKET, BY EUROPE, 2020–2023 (USD THOUSAND)
                        TABLE 56 AUTOMOTIVE: CONTACTLESS CONNECTOR MARKET, BY EUROPE, 2024–2029 (USD THOUSAND)
                        TABLE 57 AUTOMOTIVE: CONTACTLESS CONNECTOR MARKET, BY ASIA PACIFIC, 2020–2023 (USD THOUSAND)
                        TABLE 58 AUTOMOTIVE: CONTACTLESS CONNECTOR MARKET, BY ASIA PACIFIC, 2024–2029 (USD THOUSAND)
                        TABLE 59 AUTOMOTIVE: CONTACTLESS CONNECTOR MARKET, BY ROW, 2020–2023 (USD THOUSAND)
                        TABLE 60 AUTOMOTIVE: CONTACTLESS CONNECTOR MARKET, BY ROW, 2024–2029 (USD THOUSAND)
     10.4 HEALTHCARE 
             10.4.1 RISING SHIFT TOWARD REMOTE PATIENT MONITORING SOLUTIONS TO FOSTER SEGMENTAL GROWTH
             10.4.2 CASE STUDY: PHILIPS HEALTHCARE COLLABORATES WITH CENTRAK TO IMPLEMENT CONTACTLESS PATIENT MONITORING SOLUTIONS IN HEALTHCARE FACILITIES
                        TABLE 61 HEALTHCARE: CONTACTLESS CONNECTOR MARKET, BY TECHNOLOGY, 2020–2023 (USD THOUSAND)
                        TABLE 62 HEALTHCARE: CONTACTLESS CONNECTOR MARKET, BY TECHNOLOGY, 2024–2029 (USD THOUSAND)
                        TABLE 63 HEALTHCARE: CONTACTLESS CONNECTOR MARKET, BY REGION, 2020–2023 (USD MILLION)
                        TABLE 64 HEALTHCARE: CONTACTLESS CONNECTOR MARKET, BY REGION, 2024–2029 (USD MILLION)
                        TABLE 65 HEALTHCARE: CONTACTLESS CONNECTOR MARKET, BY NORTH AMERICA, 2020–2023 (USD MILLION)
                        TABLE 66 HEALTHCARE: CONTACTLESS CONNECTOR MARKET, BY NORTH AMERICA, 2024–2029 (USD MILLION)
                        TABLE 67 HEALTHCARE: CONTACTLESS CONNECTOR MARKET, BY EUROPE, 2020–2023 (USD THOUSAND)
                        TABLE 68 HEALTHCARE: CONTACTLESS CONNECTOR MARKET, BY EUROPE, 2024–2029 (USD THOUSAND)
                        TABLE 69 HEALTHCARE: CONTACTLESS CONNECTOR MARKET, BY ASIA PACIFIC, 2020–2023 (USD THOUSAND)
                        TABLE 70 HEALTHCARE: CONTACTLESS CONNECTOR MARKET, BY ASIA PACIFIC, 2024–2029 (USD THOUSAND)
                        TABLE 71 HEALTHCARE: CONTACTLESS CONNECTOR MARKET, BY ROW, 2020–2023 (USD THOUSAND)
                        TABLE 72 HEALTHCARE: CONTACTLESS CONNECTOR MARKET, BY ROW, 2024–2029 (USD THOUSAND)
     10.5 INDUSTRIAL 
             10.5.1 IMPLEMENTATION OF INDUSTRY 4.0 TO ENHANCE INDUSTRIAL PROCESSES TO FOSTER SEGMENTAL GROWTH
             10.5.2 CASE STUDY: GENERAL ELECTRIC COLLABORATES WITH ABB TO IMPLEMENT WIRELESS MONITORING SOLUTIONS FOR INDUSTRIAL EQUIPMENT
                        TABLE 73 INDUSTRIAL: CONTACTLESS CONNECTOR MARKET, BY TECHNOLOGY, 2020–2023 (USD MILLION)
                        TABLE 74 INDUSTRIAL: CONTACTLESS CONNECTOR MARKET, BY TECHNOLOGY, 2024–2029 (USD MILLION)
                        TABLE 75 INDUSTRIAL: CONTACTLESS CONNECTOR MARKET, BY REGION, 2020–2023 (USD MILLION)
                        TABLE 76 INDUSTRIAL: CONTACTLESS CONNECTOR MARKET, BY REGION, 2024–2029 (USD MILLION)
                        TABLE 77 INDUSTRIAL: CONTACTLESS CONNECTOR MARKET, BY NORTH AMERICA, 2020–2023 (USD MILLION)
                        TABLE 78 INDUSTRIAL: CONTACTLESS CONNECTOR MARKET, BY NORTH AMERICA, 2024–2029 (USD MILLION)
                        TABLE 79 INDUSTRIAL: CONTACTLESS CONNECTOR MARKET, BY EUROPE, 2020–2023 (USD THOUSAND)
                        TABLE 80 INDUSTRIAL: CONTACTLESS CONNECTOR MARKET, BY EUROPE, 2024–2029 (USD THOUSAND)
                        TABLE 81 INDUSTRIAL: CONTACTLESS CONNECTOR MARKET, BY ASIA PACIFIC, 2020–2023 (USD THOUSAND)
                        TABLE 82 INDUSTRIAL: CONTACTLESS CONNECTOR MARKET, BY ASIA PACIFIC, 2024–2029 (USD THOUSAND)
                        TABLE 83 INDUSTRIAL: CONTACTLESS CONNECTOR MARKET, BY ROW, 2020–2023 (USD THOUSAND)
                        TABLE 84 INDUSTRIAL: CONTACTLESS CONNECTOR MARKET, BY ROW, 2024–2029 (USD THOUSAND)
 
11 CONTACTLESS CONNECTOR MARKET, BY REGION (Page No. - 125)
     11.1 INTRODUCTION 
             FIGURE 36 CONTACTLESS CONNECTOR MARKET IN ASIA PACIFIC TO GROW AT HIGHEST CAGR DURING FORECAST PERIOD
             TABLE 85 CONTACTLESS CONNECTOR MARKET, BY REGION, 2020–2023 (USD MILLION)
             TABLE 86 CONTACTLESS CONNECTOR MARKET, BY REGION, 2024–2029 (USD MILLION)
     11.2 NORTH AMERICA 
             FIGURE 37 NORTH AMERICA: CONTACTLESS CONNECTOR MARKET SNAPSHOT
             11.2.1 NORTH AMERICA: RECESSION IMPACT
                        TABLE 87 NORTH AMERICA: CONTACTLESS CONNECTOR MARKET, BY COUNTRY, 2020–2023 (USD MILLION)
                        TABLE 88 NORTH AMERICA: CONTACTLESS CONNECTOR MARKET, BY COUNTRY, 2024–2029 (USD MILLION)
                        TABLE 89 NORTH AMERICA: CONTACTLESS CONNECTOR MARKET, BY VERTICAL, 2020–2023 (USD MILLION)
                        TABLE 90 NORTH AMERICA: CONTACTLESS CONNECTOR MARKET, BY VERTICAL, 2024–2029 (USD MILLION)
             11.2.2 US
                        11.2.2.1 Growing adoption of IoT in manufacturing and healthcare sectors to boost demand
                                     TABLE 91 US: CONTACTLESS CONNECTOR MARKET, BY VERTICAL, 2020–2023 (USD MILLION)
                                     TABLE 92 US: CONTACTLESS CONNECTOR MARKET, BY VERTICAL, 2024–2029 (USD MILLION)
             11.2.3 CANADA
                        11.2.3.1 Government-led initiatives to promote digital transformation to accelerate demand
                                     TABLE 93 CANADA: CONTACTLESS CONNECTOR MARKET, BY VERTICAL, 2020–2023 (USD MILLION)
                                     TABLE 94 CANADA: CONTACTLESS CONNECTOR MARKET, BY VERTICAL, 2024–2029 (USD MILLION)
             11.2.4 MEXICO
                        11.2.4.1 Rising adoption of healthcare technologies to boost demand
                                     TABLE 95 MEXICO: CONTACTLESS CONNECTOR MARKET, BY VERTICAL, 2020–2023 (USD THOUSAND)
                                     TABLE 96 MEXICO: CONTACTLESS CONNECTOR MARKET, BY VERTICAL, 2024–2029 (USD THOUSAND)
     11.3 EUROPE 
             FIGURE 38 EUROPE: CONTACTLESS CONNECTOR MARKET SNAPSHOT
             11.3.1 EUROPE: RECESSION IMPACT
                        TABLE 97 EUROPE: CONTACTLESS CONNECTOR MARKET, BY COUNTRY, 2020–2023 (USD MILLION)
                        TABLE 98 EUROPE: CONTACTLESS CONNECTOR MARKET, BY COUNTRY, 2024–2029 (USD MILLION)
                        TABLE 99 EUROPE: CONTACTLESS CONNECTOR MARKET, BY VERTICAL, 2020–2023 (USD MILLION)
                        TABLE 100 EUROPE: CONTACTLESS CONNECTOR MARKET, BY VERTICAL, 2024–2029 (USD MILLION)
             11.3.2 UK
                        11.3.2.1 Development of connected cars and in-vehicle connectivity technologies to boost demand
                                     TABLE 101 UK: CONTACTLESS CONNECTOR MARKET, BY VERTICAL, 2020–2023 (USD MILLION)
                                     TABLE 102 UK: CONTACTLESS CONNECTOR MARKET, BY VERTICAL, 2024–2029 (USD MILLION)
             11.3.3 GERMANY
                        11.3.3.1 Adoption of industrial automation and Industry 4.O to drive market
                                     TABLE 103 GERMANY: CONTACTLESS CONNECTOR MARKET, BY VERTICAL, 2020–2023 (USD MILLION)
                                     TABLE 104 GERMANY: CONTACTLESS CONNECTOR MARKET, BY VERTICAL, 2024–2029 (USD MILLION)
             11.3.4 FRANCE
                        11.3.4.1 Development of EVs and smart infrastructure to drive market
                                     TABLE 105 FRANCE: CONTACTLESS CONNECTOR MARKET, BY VERTICAL, 2020–2023 (USD MILLION)
                                     TABLE 106 FRANCE: CONTACTLESS CONNECTOR MARKET, BY VERTICAL, 2024–2029 (USD MILLION)
             11.3.5 REST OF EUROPE
                        TABLE 107 REST OF EUROPE: CONTACTLESS CONNECTOR MARKET, BY VERTICAL, 2020–2023 (USD THOUSAND)
                        TABLE 108 REST OF EUROPE: CONTACTLESS CONNECTOR MARKET, BY VERTICAL, 2024–2029 (USD THOUSAND)
     11.4 ASIA PACIFIC 
             FIGURE 39 ASIA PACIFIC: CONTACTLESS CONNECTOR MARKET SNAPSHOT
             11.4.1 ASIA PACIFIC: RECESSION IMPACT
                        TABLE 109 ASIA PACIFIC: CONTACTLESS CONNECTOR MARKET, BY COUNTRY, 2020–2023 (USD MILLION)
                        TABLE 110 ASIA PACIFIC: CONTACTLESS CONNECTOR MARKET, BY COUNTRY, 2024–2029 (USD MILLION)
                        TABLE 111 ASIA PACIFIC: CONTACTLESS CONNECTOR MARKET, BY VERTICAL, 2020–2023 (USD MILLION)
                        TABLE 112 ASIA PACIFIC: CONTACTLESS CONNECTOR MARKET, BY VERTICAL, 2024–2029 (USD MILLION)
             11.4.2 CHINA
                        11.4.2.1 Increasing investment in smart city initiatives due to rising urbanization to offer lucrative growth opportunities to players
                                     TABLE 113 CHINA: CONTACTLESS CONNECTOR MARKET, BY VERTICAL, 2020–2023 (USD MILLION)
                                     TABLE 114 CHINA: CONTACTLESS CONNECTOR MARKET, BY VERTICAL, 2024–2029 (USD MILLION)
             11.4.3 JAPAN
                        11.4.3.1 Rising investment by automakers in electric mobility to drive market
                                     TABLE 115 JAPAN: CONTACTLESS CONNECTOR MARKET, BY VERTICAL, 2020–2023 (USD MILLION)
                                     TABLE 116 JAPAN: CONTACTLESS CONNECTOR MARKET, BY VERTICAL, 2024–2029 (USD MILLION)
             11.4.4 SOUTH KOREA
                        11.4.4.1 Increasing adoption of consumer electronics to boost demand
                                     TABLE 117 SOUTH KOREA: CONTACTLESS CONNECTOR MARKET, BY VERTICAL, 2020–2023 (USD MILLION)
                                     TABLE 118 SOUTH KOREA: CONTACTLESS CONNECTOR MARKET, BY VERTICAL, 2024–2029 (USD MILLION)
             11.4.5 REST OF ASIA PACIFIC
                        TABLE 119 REST OF ASIA PACIFIC: CONTACTLESS CONNECTOR MARKET, BY VERTICAL, 2020–2023 (USD THOUSAND)
                        TABLE 120 REST OF ASIA PACIFIC: CONTACTLESS CONNECTOR MARKET, BY VERTICAL, 2024–2029 (USD THOUSAND)
     11.5 ROW 
             11.5.1 ROW: RECESSION IMPACT
                        TABLE 121 CONTACTLESS CONNECTOR MARKET, FOR ROW, BY COUNTRY/REGION, 2020–2023 (USD MILLION)
                        TABLE 122 CONTACTLESS CONNECTOR MARKET, FOR ROW, BY COUNTRY/REGION, 2024–2029 (USD MILLION)
                        TABLE 123 ROW: CONTACTLESS CONNECTOR MARKET, BY VERTICAL, 2020–2023 (USD MILLION)
                        TABLE 124 ROW: CONTACTLESS CONNECTOR MARKET, BY VERTICAL, 2024–2029 (USD MILLION)
             11.5.2 MIDDLE EAST
                        11.5.2.1 Rising investments in digital transformation to boost demand
                                     TABLE 125 MIDDLE EAST: CONTACTLESS CONNECTOR MARKET, BY VERTICAL, 2020–2023 (USD THOUSAND)
                                     TABLE 126 MIDDLE EAST: CONTACTLESS CONNECTOR MARKET, BY VERTICAL, 2024–2029 (USD THOUSAND)
             11.5.3 SOUTH AMERICA
                        11.5.3.1 Increasing investments in electric vehicle and connected car manufacturing automakers to drive market
                                     TABLE 127 SOUTH AMERICA: CONTACTLESS CONNECTOR MARKET, BY VERTICAL, 2020–2023 (USD THOUSAND)
                                     TABLE 128 SOUTH AMERICA: CONTACTLESS CONNECTOR MARKET, BY VERTICAL, 2024–2029 (USD THOUSAND)
             11.5.4 AFRICA
                        11.5.4.1 Increasing investments in smart city projects, digital healthcare solutions, and renewable energy infrastructure development to drive demand
                                     TABLE 129 AFRICA: CONTACTLESS CONNECTOR MARKET, BY VERTICAL, 2020–2023 (USD THOUSAND)
                                     TABLE 130 AFRICA: CONTACTLESS CONNECTOR MARKET, BY VERTICAL, 2024–2029 (USD THOUSAND)
 
12 COMPETITIVE LANDSCAPE (Page No. - 156)
     12.1 OVERVIEW 
     12.2 KEY STRATEGIES ADOPTED BY MAJOR PLAYERS, 2023 
             TABLE 131 CONTACTLESS CONNECTOR MARKET: OVERVIEW OF STRATEGIES ADOPTED BY KEY PLAYERS, 2023
     12.3 REVENUE ANALYSIS, 2018–2022 
             FIGURE 40 CONTACTLESS CONNECTOR MARKET: REVENUE ANALYSIS OF THREE KEY PLAYERS, 2018–2022
     12.4 MARKET SHARE ANALYSIS, 2023 
             FIGURE 41 CONTACTLESS CONNECTOR MARKET SHARE ANALYSIS, 2023
             TABLE 132 DEGREE OF COMPETITION, 2023
     12.5 COMPANY VALUATION AND FINANCIAL METRICS, 2023 
             FIGURE 42 CONTACTLESS CONNECTOR MARKET: COMPANY VALUATION, 2023
             FIGURE 43 CONTACTLESS CONNECTOR MARKET: FINANCIAL METRICS (EV/EBITDA), 2023
     12.6 BRAND/PRODUCT COMPARISON 
             FIGURE 44 BRAND/PRODUCT COMPARISON
     12.7 COMPANY EVALUATION MATRIX: KEY PLAYERS, 2023 
             12.7.1 STARS
             12.7.2 EMERGING LEADERS
             12.7.3 PERVASIVE PLAYERS
             12.7.4 PARTICIPANTS
                        FIGURE 45 CONTACTLESS CONNECTOR MARKET: COMPANY EVALUATION MATRIX: KEY PLAYERS, 2023
             12.7.5 COMPANY FOOTPRINT: KEY PLAYERS, 2023
                        12.7.5.1 Overall footprint
                                     FIGURE 46 COMPANY OVERALL FOOTPRINT
                        12.7.5.2 Product type footprint
                                     TABLE 133 COMPANY PRODUCT TYPE FOOTPRINT
                        12.7.5.3 Technology footprint
                                     TABLE 134 COMPANY TECHNOLOGY FOOTPRINT
                        12.7.5.4 Data rate footprint
                                     TABLE 135 COMPANY DATA RATE FOOTPRINT
                        12.7.5.5 Vertical footprint
                                     TABLE 136 COMPANY VERTICAL FOOTPRINT
                        12.7.5.6 Regional footprint
                                     TABLE 137 COMPANY REGIONAL FOOTPRINT
     12.8 COMPANY EVALUATION MATRIX: STARTUPS/SMES, 2023 
             12.8.1 PROGRESSIVE COMPANIES
             12.8.2 RESPONSIVE COMPANIES
             12.8.3 DYNAMIC COMPANIES
             12.8.4 STARTING BLOCKS
                        FIGURE 47 CONTACTLESS CONNECTOR MARKET: COMPANY EVALUATION MATRIX: STARTUPS/SMES, 2023
             12.8.5 COMPETITIVE BENCHMARKING: STARTUPS/SMES, 2023
                        12.8.5.1 List of key startups/SMES
                                     TABLE 138 CONTACTLESS CONNECTOR MARKET: LIST OF KEY STARTUPS/SMES
             12.8.6 COMPANY FOOTPRINT: STARTUP/SME, 2023
                        12.8.6.1 Product footprint
                                     TABLE 139 STARTUP/SME: PRODUCT FOOTPRINT
                        12.8.6.2 Product footprint
                                     TABLE 140 STARTUP/SME: PRODUCT TYPE FOOTPRINT
                        12.8.6.3 Technology footprint
                                     TABLE 141 STARTUP/SME: TECHNOLOGY FOOTPRINT
                        12.8.6.4 Data rate footprint
                                     TABLE 142 STARTUP/SME: DATA RATE FOOTPRINT
                        12.8.6.5 Vertical footprint
                                     TABLE 143 STARTUP/SME: VERTICAL FOOTPRINT
                        12.8.6.6 Regional footprint
                                     TABLE 144 STARTUP/SME: REGIONAL FOOTPRINT
     12.9 COMPETITIVE SCENARIOS AND TRENDS 
             12.9.1 PRODUCT LAUNCHES/DEVELOPMENTS
                        TABLE 145 CONTACTLESS CONNECTOR MARKET: PRODUCT LAUNCHES/DEVELOPMENTS, SEPTEMBER 2023
             12.9.2 DEALS
                        TABLE 146 CONTACTLESS CONNECTOR MARKET: DEALS, OCTOBER 2021–JANUARY 2023
 
13 COMPANY PROFILES (Page No. - 180)
(Business Overview, Products Offered, Recent Developments, MnM View Right to win, Strategic choices made, Weaknesses and competitive threats) *  
     13.1 KEY PLAYERS 
             13.1.1 STMICROELECTRONICS
                        TABLE 147 STMICROELECTRONICS: COMPANY OVERVIEW
                        FIGURE 48 STMICROELECTRONICS: COMPANY SNAPSHOT
                        TABLE 148 STMICROELECTRONICS: PRODUCTS/SOLUTIONS/SERVICES OFFERED
                        TABLE 149 STMICROELECTRONICS: DEALS
             13.1.2 TE CONNECTIVITY
                        TABLE 150 TE CONNECTIVITY: COMPANY OVERVIEW
                        FIGURE 49 TE CONNECTIVITY: COMPANY SNAPSHOT
                        TABLE 151 TE CONNECTIVITY: PRODUCTS/SOLUTIONS/SERVICES OFFERED
             13.1.3 MOLEX
                        TABLE 152 MOLEX: COMPANY OVERVIEW
                        TABLE 153 MOLEX: PRODUCTS/SOLUTIONS/SERVICES OFFERED
                        TABLE 154 MOLEX: PRODUCT LAUNCHES
                        TABLE 155 MOLEX: DEALS
             13.1.4 ROSENBERGER HOCHFREQUENZTECHNIK GMBH & CO. KG
                        TABLE 156 ROSENBERGER HOCHFREQUENZTECHNIK GMBH & CO. KG: COMPANY OVERVIEW
                        TABLE 157 ROSENBERGER HOCHFREQUENZTECHNIK GMBH & CO. KG: PRODUCTS/SOLUTIONS/SERVICES OFFERED
             13.1.5 RADIALL
                        TABLE 158 RADIALL: COMPANY OVERVIEW
                        TABLE 159 RADIALL: PRODUCTS/SOLUTIONS/SERVICES OFFERED
             13.1.6 WEIDMÜLLER
                        TABLE 160 WEIDMÜLLER: COMPANY OVERVIEW
                        TABLE 161 WEIDMÜLLER: PRODUCTS/SOLUTIONS/SERVICES OFFERED
             13.1.7 UNIQCONN INC.
                        TABLE 162 UNIQCONN INC.: COMPANY OVERVIEW
                        TABLE 163 UNIQCONN INC.: PRODUCTS/SOLUTIONS/SERVICES OFFERED
             13.1.8 PHOENIX CONTACT
                        TABLE 164 PHOENIX CONTACT: COMPANY OVERVIEW
                        TABLE 165 PHOENIX CONTACT: PRODUCTS/SOLUTIONS/SERVICES OFFERED
                        TABLE 166 PHOENIX CONTACT: DEALS
                        TABLE 167 COMMSCOPE: COMPANY OVERVIEW
                        FIGURE 50 COMMSCOPE: COMPANY SNAPSHOT
                        TABLE 168 COMMSCOPE: PRODUCTS/SOLUTIONS/SERVICES OFFERED
             13.1.10 OMEGA ENGINEERING INC.
                        TABLE 169 OMEGA ENGINEERING, INC.: COMPANY OVERVIEW
                        TABLE 170 OMEGA ENGINEERING, INC.: PRODUCTS/SOLUTIONS/SERVICES OFFERED
     13.2 OTHER PLAYERS 
             13.2.1 POWERMAT
             13.2.2 COLDER PRODUCTS COMPANY
             13.2.3 ALTEC AUTOMOTIVE
             13.2.4 LAIRD CONNECTIVITY
             13.2.5 YAMAICHI ELECTRONICS CO., LTD.
             13.2.6 YAZAKI CORPORATION
             13.2.7 ODU GMBH & CO.KG
             13.2.8 AVIC JONHON OPTRONIC TECHNOLOGY CO., LTD
             13.2.9 SAMTEC
             13.2.10 CONEXTIVITY GROUP SA
             13.2.11 WÜRTH ELEKTRONIK EISOS GMBH & CO. KG
             13.2.12 POWERCAST CORPORATION
             13.2.13 POWERSPHYR INCORPORATED
             13.2.14 MOJO MOBILITY INC.
             13.2.15 INDUCTEV INC.
*Details on Business Overview, Products Offered, Recent Developments, MnM View, Right to win, Strategic choices made, Weaknesses and competitive threats might not be captured in case of unlisted companies.  
 
14 APPENDIX (Page No. - 211)
     14.1 DISCUSSION GUIDE 
     14.2 KNOWLEDGESTORE: MARKETSANDMARKETS’ SUBSCRIPTION PORTAL 
     14.3 CUSTOMIZATION OPTIONS 
     14.4 RELATED REPORTS 
     14.5 AUTHOR DETAILS 


The study involved four major activities in estimating the current size of the contactless connector market. Exhaustive secondary research was done to collect information on the market, peer market, and parent market. The next step was to validate these findings, assumptions, and sizing with industry experts across the value chain through primary research. Both top-down and bottom-up approaches were employed to estimate the complete market size. After that, market breakdown and data triangulation were used to estimate the market size of segments and subsegments.

Secondary Research

Secondary sources for this research study included corporate filings (such as annual reports, investor presentations, and financial statements); trade, business, and professional associations; white papers; certified publications; articles by recognized authors; directories; and databases. The secondary data was collected and analyzed to determine the overall market size, further validated through primary research.

List of major secondary sources

SOURCE

SWEB LINK

Federal Communications Commission (FCC)

https://www.fcc.gov/

National Institute of Standards and Technology (NIST)

https://www.nist.gov/

Ministry of Electronics and Information Technology (MeitY)

https://www.meity.gov.in/

Ministry of Industry and Information Technology (MIIT)

https://english.miit.gov.cn/

Ministry of Internal Affairs and Communications (MIC)

https://www.soumu.go.jp/english/

Primary Research

Extensive primary research was conducted after gaining knowledge about the current scenario of the contactless connector market through secondary research. Several primary interviews were conducted with experts from both demand and supply sides across four major regions—North America, Europe, Asia Pacific, and RoW. This primary data was collected through questionnaires, emails, and telephonic interviews.
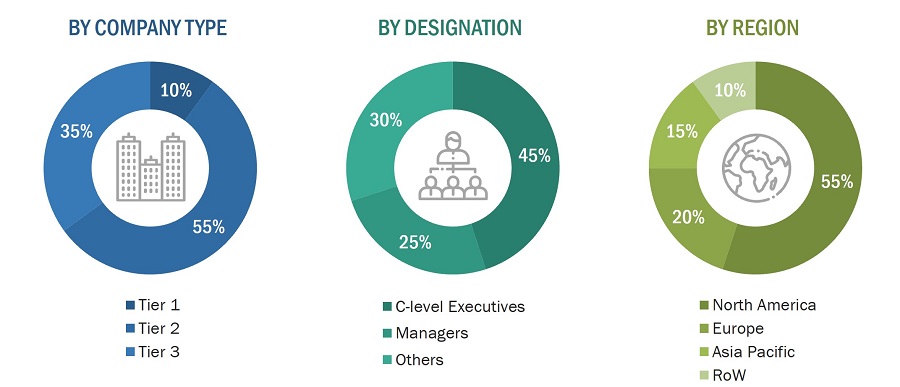
Contactless Connector Market
 Size, and Share

To know about the assumptions considered for the study, download the pdf brochure

Market Size Estimation

Both top-down and bottom-up approaches were used to estimate and validate the size of the contactless connector market and its various dependent submarkets. The key players in the market were identified through secondary research, and their market share in the respective regions was determined through primary and secondary research. This entire procedure involved the study of annual and financial reports of top players and extensive interviews with industry leaders such as chief executive officers (CEOs), vice presidents (VPs), directors, and marketing executives. All percentage shares and breakdowns were determined using secondary sources and verified through primary sources. All the possible parameters that affect the markets covered in this research study were accounted for, viewed in extensive detail, verified through primary research, and analyzed to obtain the final quantitative and qualitative data. This data was consolidated and supplemented with detailed inputs and analysis from MarketsandMarkets and presented in this report.

Bottom-Up Approach

The bottom-up approach was used to arrive at the overall size of the contactless connector market from the revenues of the key players and their shares in the market. The overall market size was calculated based on the revenues of the key players identified in the market.

  • Identifying various verticals using or expected to implement Contactless connector
  • Analyzing each verticals, along with the major related companies and Contactless connector providers
  • Estimating the Contactless connector market for verticals
  • Understanding the demand generated by companies operating across different verticals
  • Tracking the ongoing and upcoming implementation of projects based on Contactless connector technology by vertical and forecasting the market based on these developments and other critical parameters
  • Carrying out multiple discussions with the key opinion leaders to understand the type of Contactless connector products designed and developed vertically. This information would help analyze the breakdown of the scope of work carried out by each major company in the Contactless connector market
  • Arriving at the market estimates by analyzing Contactless connector companies as per their countries, and subsequently combining this information to arrive at the market estimates by region
  • Verifying and cross-checking the estimates at every level through discussions with the key opinion leaders, including CXOs, directors, and operations managers, and finally with domain experts at MarketsandMarkets
  • Studying various paid and unpaid sources of information, such as annual reports, press releases, white papers, and databases

Contactless Connector Market
 Size, and Bottom-Up Approach

Top-Down Approach

In the top-down approach, the overall market size has been used to estimate the size of the individual markets (mentioned in the market segmentation) through percentage splits from secondary and primary research.

To calculate the market size of specific segments, the most appropriate immediate parent market size has been used to implement the top-down approach. The top-down approach was implemented for the data extracted from the secondary research to validate the market size obtained.

The market share of each company was estimated to verify the revenue shares used earlier in the top-down approach. The overall parent market size and individual market sizes were determined and confirmed in this study by the data triangulation method and the validation of data through primaries. The data triangulation method used in this study is explained in the next section.

  • Focusing on top-line investments and expenditures being made in the ecosystems of various verticals.
  • Building and developing the information related to the market revenue generated by key Contactless connector manufacturers
  • Conducting multiple on-field discussions with the key opinion leaders involved in the development of Contactless connector products in various verticals
  • Estimating geographic splits using secondary sources based on various factors, such as the number of players in a specific country and region, the offering of Contactless connector, and the level of solutions offered in verticals
  • Impact of the recession on the steps mentioned above has also been considered.

Contactless Connector Market
 Size, and Top-Down Approach

Data Triangulation

After arriving at the overall market size from the estimation process explained above, the overall market has been split into several segments and subsegments. To complete the overall market engineering process and arrive at the exact statistics for all segments and subsegments, the data triangulation procedure has been employed wherever applicable. The data has been triangulated by studying various factors and trends from both demand and supply sides. Along with this, the market size has been validated using top-down and bottom-up approaches.

Market Definition

Contactless connector encompass a comprehensive set of measures, technologies, and practices designed to protect physical assets, facilities, and individuals from unauthorized access, theft, vandalism, and other potential threats. These solutions often include a combination of hardware and software components such as access control systems, surveillance cameras, perimeter barriers (e.g., fences, gates), alarm systems, biometric identification systems, and visitor management systems. The primary goal is to create a secure environment that deters intrusions, monitors activities and responds promptly to security incidents. By deploying tailored physical contactless connector, organizations can safeguard their premises, assets, and personnel, thereby mitigating risks, ensuring safety compliance, and maintaining operational continuity.

Key Stakeholders

  • Component Manufacturers
  • End-User Organizations
  • System Integrators
  • Consumers
  • Regulatory Bodies and Compliance Agencies
  • Research Institutions
  • Distributors and Resellers
  • Industry Associations and Organizations
  • Investors and Financial Institutions

Report Objectives

  • To define, describe, and forecast the contactless connector market based on product type, technology, data rate, mode of operation, vertical, and region.
  • To forecast the shipment data of contactless connector market.
  • To forecast the size of the market segments for four major regions—North America, Europe, Asia Pacific (APAC), and the Rest of the World (RoW)
  • To provide detailed information regarding the major factors influencing the growth of the market (drivers, restraints, opportunities, and challenges)
  • To strategically analyze micro-markets with respect to individual growth trends, prospects, and contributions to the total market
  • To study the complete value chain and allied industry segments and perform a value chain analysis of the market
  • To strategically profile the key players and comprehensively analyze their market shares and core competencies
  • To analyze the opportunities in the market for stakeholders and describe the competitive landscape of the market
  • To analyze competitive developments such as collaborations, partnerships, product developments, and research & development (R&D) in the market
  • To analyze the impact of the recession on the contactless connector market

Available Customizations

With the given market data, MarketsandMarkets offers customizations according to the specific requirements of companies. The following customization options are available for the report:

  • Detailed analysis and profiling of additional market players (up to 5)
  • Additional country-level analysis of the contactless connector market

Product Analysis

  • Product matrix, which provides a detailed comparison of the product portfolio of each company in the contactless connector market.
Custom Market Research Services

We will customize the research for you, in case the report listed above does not meet with your exact requirements. Our custom research will comprehensively cover the business information you require to help you arrive at strategic and profitable business decisions.

Request Customization
Report Code
SE 8957
Published ON
Feb, 2024
Choose License Type
BUY NOW
  • SHARE
X
Request Customization
Speak to Analyst
Speak to Analyst
OR FACE-TO-FACE MEETING
PERSONALIZE THIS RESEARCH
  • Triangulate with your Own Data
  • Get Data as per your Format and Definition
  • Gain a Deeper Dive on a Specific Application, Geography, Customer or Competitor
  • Any level of Personalization
REQUEST A FREE CUSTOMIZATION
LET US HELP YOU!
  • What are the Known and Unknown Adjacencies Impacting the Contactless Connector Market
  • What will your New Revenue Sources be?
  • Who will be your Top Customer; what will make them switch?
  • Defend your Market Share or Win Competitors
  • Get a Scorecard for Target Partners
CUSTOMIZED WORKSHOP REQUEST
knowledgestore logo

Hold On!

Want to explore hidden markets that can drive new revenue in Contactless Connector Market?

Find Hidden Markets
  • Call Us
  • +1-888-600-6441 (Corporate office hours)
  • +1-888-600-6441 (US/Can toll free)
  • +44-800-368-9399 (UK office hours)
CONNECT WITH US
ABOUT TRUST ONLINE
©2024 MarketsandMarkets Research Private Ltd. All rights reserved
DMCA.com Protection Status
Website Feedback