3D and 4D Technology Market Size, Share & Growth

3D and 4D Technology Market by Solution Type (3D & 4D Input Devices, 3D and 4D Imaging Solutions, 3D Output Devices), End Use Application (3D and 4D Gaming, 3D & 4D Cinema), Vertical (Entertainment, Military and Defense), Region - Global Forecast to 2029

Report Code: SE 2497 Feb, 2024, by marketsandmarkets.com

Updated on : October 23, 2024

3D and 4D Technology Market Size

[325 Pages Report] The 3D and 4D technology market size was valued at USD 399.7 billion in 2024 and is estimated to reach USD 866.5 billion by 2029, growing at a CAGR of 16.7% during the forecast period.from 2024 to 2029

The growth of the 3D and 4D technology market is driven by surge in the trend of 3D and 4D gaming, rising demand for 3D-enabled devices across verticals, and rising demand for 3D and 4D technology in entertainment industry.

3D and 4D Technology Market

3D and 4D Technology Market Forecast to 2029

To know about the assumptions considered for the study, Request for Free Sample Report

3D and 4D Technology Market Trends & Growth :

Drivers: Increasing urbanization, push for productivity, and environment concerns in architecture and construction verticals

The construction industry is currently emerging toward the adoption of 3D technologies to enhance and accelerate the construction process. The Las Vegas municipal government and utilities constantly faced the issue of hitting underground infrastructure during excavations. To address this issue, the Las Vegas city government initiated a 3D project to model one-and-half miles of Main Street in the older part of Las Vegas. The project intended to scan below- and above-ground facilities, including roadways, utilities, telecommunications, and buildings. The project was intended to build a 3D model of the city’s infrastructure so the engineers could rely on the 3D model for accurate and up-to-date information for planning, designing, and maintenance of buildings. The engineering design and other data were combined with the city’s geoimagery, digital terrain models, and other GIS data. In addition, a mobile AR application was developed for the iPad, allowing the staff in the field to view underground facilities virtually under the actual roadway. With the development of the 3D imaging model, Las Vegas experienced increased safety due to the reduced risk of unexpectedly hitting underground utilities, especially hazardous facilities, such as gas mains. With the result of the adoption of 3D technologies, the city is now expanding the 3D modeling to an area six times larger than the original project.

Restraint: Interoperability issues with 3D imaging solutions and hardware

A 3D imaging hardware, such as a 3D sensor or 3D camera, is designed and manufactured with specific interfaces that make it difficult to integrate with other devices. While some machines may accept the interface, not every device supports the same one. Even newly developed technologies like Microsoft Kinect lack flexibility in integration. The continuous technological advancements and upgrades lead to further limitations in the healthcare, construction, media, and entertainment industries, which face significant challenges concerning connectivity and interoperability of any devices or software systems. To make advanced 3D imaging technology more accessible across various platforms, the industry needs to develop hardware and solutions that can work together more seamlessly based on clearer interoperability standards.

Opportunity: Rising adoption of 3D printing in healthcare

 The rising adoption of 3D printing in healthcare has brought a significant change by creating customized medical devices, implants, anatomical models, and prosthetics that perfectly fit a patient’s unique anatomy. One of the main benefits of 3D printing is the ability to produce complex and intricate structures that are tailored to a patient’s specific needs. This is particularly important in surgeries where precision and customization are crucial. Surgeons can now use 3D-printed anatomical models to plan procedures more efficiently, replicating a patient’s specific anatomy. With 3D printing, it’s now possible to create personalized healthcare solutions such as orthopedic implants, dental prosthetics, patient-specific surgical models, and dental devices and even organ replicas, which were previously impossible to attain.

The healthcare industry has embraced 3D printing for applications such as custom implants, prosthetics, patient-specific surgical models, and dental devices. The ability to create intricate and patient-specific medical components has been a significant driver.

Challenge: Demand for data processing and storage

The challenge of processing and storing data in 3D imaging arises from the complexity and volume of generated data. High-resolution 3D scans from medical imaging devices or industrial scanners produce large datasets that can strain computational resources. Real-time processing of this data for applications like medical diagnostics or rendering virtual environments requires robust computing systems and optimized algorithms to handle the intricacies of 3D data efficiently.

Storing these vast datasets while ensuring accessibility and maintaining data integrity presents a considerable challenge. Balancing the need for high-capacity storage with cost-effectiveness and data retrieval speeds becomes crucial, especially as the amount of 3D imaging data grows with technological advancements and the expansion of application areas.

3D and 4D Technology Market Ecosystem
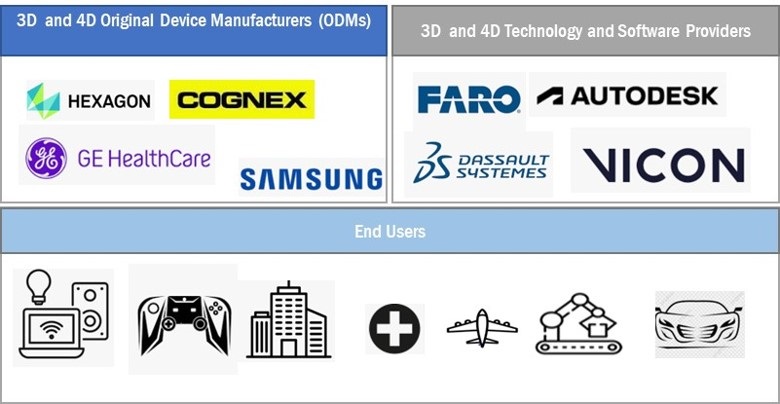
3D and 4D Technology Market by Ecosystem

3D and 4D Technology Market Segmentation
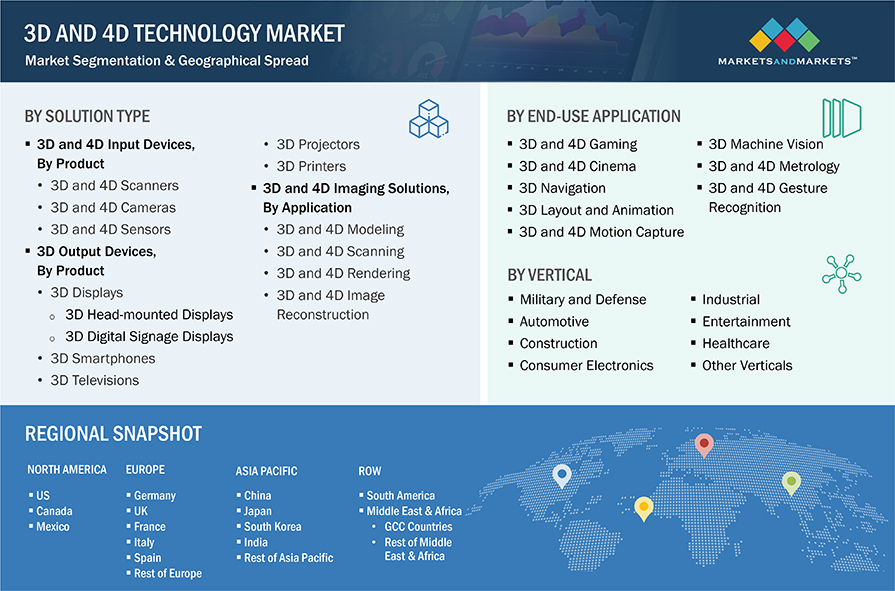
3D and 4D Technology Market by Segmentation

3D and 4D Technology Market Share

3D and 4D scanners sub-segment to account for second largest share of the 3D and 4D input devices market during forecast period

3D Laser scanners play a pivotal role in 3D/4D imaging, offering precise and rapid data acquisition for diverse applications. These scanners utilize laser beams to measure the shape and contours of objects, enabling the creation of highly detailed 3D/4D models. The market for 3D/4D imaging is witnessing significant growth, driven by the escalating demand for efficient and accurate spatial data across industries such as manufacturing, healthcare, and architecture.

The market for 3D and 4D rendering sub-segment is expected to hold the largest share of the 3D and 4D imaging solutions market during the forecast period

3D and 4D rendering are used to convert a model into a 3D photorealistic image and 4D video. Its features include quick preview animations, high-performance interactive workflows, and photorealistic detail for a pixel-perfect final image (for offering enhanced images). One of the key factors contributing to the growth of this market segment is the increasing demand from the global entertainment industry to incorporate special effects in a cost-efficient manner. The increased emphasis on virtualization software is another key factor supporting the growth of this market segment.

3D and 4D Gesture Recognition end use application segment to hold the second  largest share of market during the forecast period

The rising prominence of 3D and 4D gesture recognition is driven by the desire for more natural and immersive ways of interacting with technology. As these technologies continue to advance, their applications across various industries and everyday life are expected to expand, further enriching user experiences and opening new possibilities for human-computer interaction.

3D and 4D technology market in Asia Pacific estimated to grow at the fastest rate during the forecast period

The 3D and 4D technology industry , in Asia Pacific is expected to grow at the highest CAGR during the forecast period. Asia Pacific is expected to witness highest growth during the forecast period. The growth of this market can be attributed to the tremendous market potential for 3D and 4D applications. Countries in the Asia Pacific, such as China and Japan, are known for consumer electronics, automotive, and manufacturing. 3D and 4D input and 3D output devices such as cameras, sensors, scanners, smartphones, TVs, printers, and projectors are produced, consumed, and exported on a large scale by these countries.
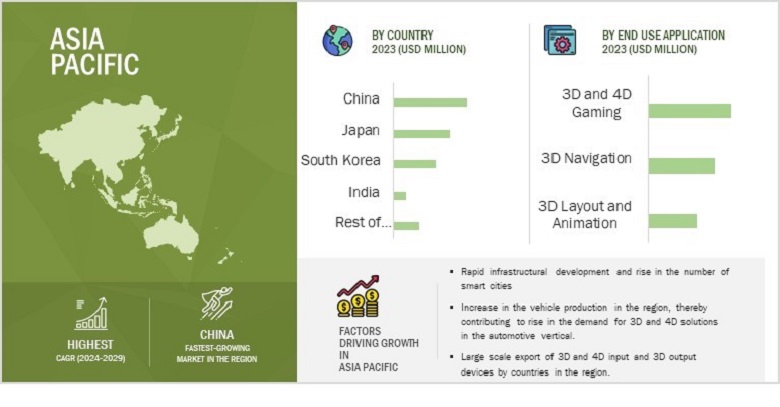
3D and 4D Technology Market
 by Region

3D and 4D Technology Market by Region

To know about the assumptions considered for the study, download the pdf brochure

Top 3D and 4D Technology Companies - Key Market Players:

Major vendors in the 3D and 4D technology companies include

  • Samsung (South Korea),
  • GE Healthcare (US),
  • Hexagon AB (Sweden),
  • Autodesk, Inc. (US),
  • Sony (Japan),
  • Dassault Systèmes (France),
  • Stratasys (Israel),
  • FARO (US),
  • 3D Systems (US),
  • Vicon (UK),
  • Panasonic (Japan),
  • Philip (Netherlands),
  • Qualisys (Sweden),
  • Barco (Belgium),
  • Google (US),
  • Cognex (US),
  • LG Electronics (South Korea),
  • Basler AG (Germany),
  • DreamWorks Animation (US),
  • Dolby Laboratories, Inc. (US),
  • NANSENSE (US),
  • Quidient (US),
  • Rokoko (Denmark),
  • 4D Sensor Inc. (Japan),
  • Vayyar Imaging (Israel),
  • Matterport (US),
  • Creality (China),
  • INTAMSYS (China), Eplus3D (China).

3D and 4D Technology Market Report Scope :

Report Metric

Details

Estimated Market Size  USD 399.7 billion in 2024
Projected Market Size  USD 866.5 billion by 2029
Growth Rate  CAGR of  16.7%

Market size available for years

2020—2029

Base year

2023

Forecast period

2024—2029

Segments covered

  • By Solution Type,
  • By End Use Application,
  • By Vertical and
  • By Region

Geographic regions covered

  • North America,
  • Europe,
  • Asia Pacific, and
  • RoW

Companies covered

Samsung (South Korea), GE Healthcare (US), Hexagon AB (Sweden), Autodesk, Inc. (US), Sony (Japan), Dassault Systèmes (France), Stratasys (Israel), FARO (US), 3D Systems (US), Vicon (UK), Panasonic (Japan), Philip (Netherlands), Qualisys (Sweden), Barco (Belgium), Google (US), Cognex (US), LG Electronics (South Korea), Basler AG (Germany), DreamWorks Animation (US), Dolby Laboratories, Inc. (US), NANSENSE (US), Quidient (US), Rokoko (Denmark), 4D Sensor Inc. (Japan), Vayyar Imaging (Israel), Matterport (US), Creality (China), INTAMSYS (China), Eplus3D (China)

3D and 4D Technology Market Highlights

This research report categorizes the 3D and 4D technology market based on  solution type, installation, , end-use application, vertical, and region

Segment

Subsegment

By Solution Type:

  • 3D and 4D Input Devices, By Product
    • 3D and 4D Scanners
    • 3D and 4D Cameras
    • 3D and 4D Sensors
  •  3D and 4D Imaging Solutions, By Application
    • 3D and 4D Modelling
    • 3D and 4D Scanning
    • 3D and 4D Rendering
    • 3D and 4D Image Reconstruction
  • 3D Output Devices, By Product
    • 3D Displays
    • 3D Smartphones
    • 3D Televisions
    • 3D Projectors
    • 3D Printers

By End Use Application

  • 3D and 4D Gaming
  • 3D and 4D Cinema
  • 3D Navigation
  • 3D Layout and Animation
  • 3D and 4D Motion Capture
  • 3D Machine Vision
  • 3D and 4D Metrology
  • 3D and 4D Gesture Recognition

By Vertical:

  • Military and Defense
  • Automotive
  • Construction
  • Consumer Electronics
  • Industrial
  • Entertainment
  • Healthcare
  • Others

By Region:

  • North America
    • US
    • Canada
    • Mexico
  • Europe
    • Germany
    • UK
    • France
    • Italy
    • Spain
    • Rest of Europe
  • Asia Pacific
    • China
    • Japan
    • India
    • South Korea
    • Rest of Asia Pacific
  • RoW
    • Middle East and Africa
    • GCC
    • Rest of MEA
    • South America

Recent Developments in 3D and 4D technology Industry : 

  • In October 2023, FARO announced the release of the FARO Orbis Mobile Scanner, a groundbreaking advancement to redefine 3D reality capture. Orbis is the first to market a hybrid SLAM scanner that can be used for mobile and stationary data capture in one device. It offers local or cloud-based data processing and collaboration. The product is the latest evolution in FARO’s industry-leading Simultaneous Localization and Mapping (SLAM)-enabled LiDAR technology.
  • In April 2023, Teledyne Optech introduced the marine lidar sensor, CL-360 for marine applications. This lidar sensor can be seamlessly integrated with high-resolution multibeam systems and the CARIS Ping-To-Chart workflow, allowing full above and below-water image capture with survey-grade accuracy in a single workflow.

Key Questions Addressed in the Report:

To speak to our analyst for a discussion on the above findings, click Speak to Analyst

Exclusive indicates content/data unique to MarketsandMarkets and not available with any competitors.

TABLE OF CONTENTS
 
1 INTRODUCTION (Page No. - 37)
    1.1 STUDY OBJECTIVES 
    1.2 MARKET DEFINITION 
    1.3 INCLUSIONS AND EXCLUSIONS 
    1.4 STUDY SCOPE 
           1.4.1 MARKETS COVERED
                    FIGURE 1 3D AND 4D TECHNOLOGY MARKET SEGMENTATION
           1.4.2 REGIONAL SCOPE
           1.4.3 YEARS CONSIDERED
    1.5 CURRENCY CONSIDERED 
    1.6 UNITS CONSIDERED 
    1.7 LIMITATIONS 
    1.8 STAKEHOLDERS 
    1.9 SUMMARY OF CHANGES 
    1.1 IMPACT OF RECESSION ON 3D AND 4D TECHNOLOGY MARKET 
           FIGURE 2 GDP GROWTH PROJECTION FOR MAJOR ECONOMIES TILL 2023
 
2 RESEARCH METHODOLOGY (Page No. - 44)
    2.1 RESEARCH DATA 
           FIGURE 3 3D AND 4D TECHNOLOGY MARKET: RESEARCH DESIGN
           2.1.1 SECONDARY DATA
                    2.1.1.1 List of major secondary sources
                    2.1.1.2 Key data from secondary sources
           2.1.2 PRIMARY DATA
                    2.1.2.1 Primary data
                    2.1.2.2 Key data from primary sources
                    2.1.2.3 Breakdown of primaries
           2.1.3 SECONDARY AND PRIMARY RESEARCH
                    2.1.3.1 Key industry insights
    2.2 MARKET SIZE ESTIMATION 
           FIGURE 4 MARKET SIZE ESTIMATION METHODOLOGY: REVENUE OF MARKET PLAYERS
           2.2.1 BOTTOM-UP APPROACH
                    2.2.1.1 Approach to estimate market size using bottom-up analysis (demand side)
                               FIGURE 5 MARKET SIZE ESTIMATION METHODOLOGY: BOTTOM-UP APPROACH
           2.2.2 TOP-DOWN APPROACH
                    2.2.2.1 Approach to estimate market size using top-down analysis (supply side)
                               FIGURE 6 MARKET SIZE ESTIMATION METHODOLOGY: TOP-DOWN APPROACH
    2.3 MARKET BREAKDOWN AND DATA TRIANGULATION 
           FIGURE 7 DATA TRIANGULATION
    2.4 RESEARCH ASSUMPTIONS 
    2.5 RISK ASSESSMENT 
           2.5.1 PARAMETERS CONSIDERED TO ANALYZE IMPACT OF RECESSION
           TABLE 1 PARAMETERS CONSIDERED TO ANALYZE IMPACT OF RECESSION
    2.6 LIMITATIONS 
           FIGURE 8 LIMITATIONS
 
3 EXECUTIVE SUMMARY (Page No. - 55)
    3.1 GROWTH RATE ASSUMPTIONS/FORECAST 
           FIGURE 9 3D AND 4D END-USE APPLICATIONS SEGMENT TO HOLD LARGEST MARKET SHARE BY 2029
           FIGURE 10 3D NAVIGATION SEGMENT TO RECORD HIGHEST GROWTH FROM 2024 TO 2029
           FIGURE 11 MILITARY AND DEFENSE SEGMENT TO EXHIBIT HIGHEST CAGR FROM 2024 TO 2029
           FIGURE 12 NORTH AMERICA LIKELY TO ACCOUNT FOR LARGEST MARKET SHARE DURING 2024–2029
 
4 PREMIUM INSIGHTS (Page No. - 60)
    4.1 ATTRACTIVE GROWTH OPPORTUNITIES FOR PLAYERS IN 3D AND 4D TECHNOLOGY MARKET 
           FIGURE 13 GROWING DEMAND FOR 3D AND 4D DEVICES IN CONSUMER ELECTRONICS AND ENTERTAINMENT VERTICALS TO DRIVE MARKET
    4.2 3D AND 4D INPUT DEVICES: 3D AND 4D TECHNOLOGY MARKET, BY PRODUCT 
           FIGURE 14 3D AND 4D CAMERAS TO CAPTURE LARGEST SHARE OF 3D AND 4D INPUT DEVICES MARKET BY 2029
    4.3 3D OUTPUT DEVICES: 3D AND 4D TECHNOLOGY MARKET, BY PRODUCT 
           FIGURE 15 3D TELEVISIONS TO CAPTURE LARGEST SHARE OF 3D OUTPUT DEVICES MARKET BY 2029
    4.4 3D AND 4D IMAGING SOLUTIONS: 3D AND 4D TECHNOLOGY MARKET, BY END-USE APPLICATION 
           FIGURE 16 3D AND 4D RENDERING SEGMENT TO CAPTURE LARGEST SHARE OF 3D AND 4D IMAGING SOLUTIONS MARKET BY 2029
    4.5 3D AND 4D TECHNOLOGY MARKET, BY REGION 
           FIGURE 17 NORTH AMERICA TO DOMINATE MARKET DURING FORECAST PERIOD
    4.6 3D AND 4D TECHNOLOGY MARKET, BY VERTICAL 
           FIGURE 18 ENTERTAINMENT SEGMENT TO HOLD LARGEST MARKET SHARE DURING FORECAST PERIOD
    4.7 ASIA PACIFIC: 3D AND 4D TECHNOLOGY MARKET, BY END-USE APPLICATION AND COUNTRY 
           FIGURE 19 3D AND 4D GAMING SEGMENT AND CHINA HELD LARGEST SHARES OF ASIA PACIFIC 3D AND 4D TECHNOLOGY MARKET IN 2023
    4.8 3D AND 4D TECHNOLOGY MARKET, BY GEOGRAPHY 
           FIGURE 20 CHINA TO REGISTER HIGHEST CAGR IN GLOBAL 3D AND 4D TECHNOLOGY MARKET DURING FORECAST PERIOD
 
5 MARKET OVERVIEW (Page No. - 64)
    5.1 INTRODUCTION 
    5.2 MARKET DYNAMICS 
           FIGURE 21 3D AND 4D TECHNOLOGY MARKET: DRIVERS, RESTRAINTS, OPPORTUNITIES, AND CHALLENGES
           5.2.1 DRIVERS
                    5.2.1.1 Rising demand for 3D and 4D solutions in entertainment industry
                    5.2.1.2 Growing adoption of 3D-enabled devices across verticals
                    5.2.1.3 Increasing adoption of 3D technology in construction industry
                    5.2.1.4 Consolidating trend of 3D and 4D gaming
                               FIGURE 22 3D AND 4D TECHNOLOGY MARKET: DRIVERS AND THEIR IMPACT
           5.2.2 RESTRAINTS
                    5.2.2.1 High maintenance costs of 3D and 4D imaging devices
                    5.2.2.2 Interoperability issues associated with 3D imaging solutions and hardware
                               FIGURE 23 3D AND 4D TECHNOLOGY MARKET: RESTRAINTS AND THEIR IMPACT
           5.2.3 OPPORTUNITIES
                    5.2.3.1 Rising adoption of 3D printing and AI-based 3D and 4D solutions in healthcare
                    5.2.3.2 Expanding application scope of 3D and 4D technology-based solutions in military and defense sector
                    5.2.3.3 Ongoing advancements and increasing research initiatives to commercialize 4D printing
                    5.2.3.4 Rising utilization of 3D imaging in retail and e-commerce verticals to increase engagement
                               FIGURE 24 3D AND 4D TECHNOLOGY MARKET: OPPORTUNITIES AND THEIR IMPACT
           5.2.4 CHALLENGES
                    5.2.4.1 Lack of standard 3D file formats
                    5.2.4.2 Issues associated with processing and storage of large datasets generated by 3D imaging
                               FIGURE 25 3D AND 4D TECHNOLOGY MARKET: CHALLENGES AND THEIR IMPACT
    5.3 VALUE CHAIN ANALYSIS 
           FIGURE 26 3D AND 4D TECHNOLOGY VALUE CHAIN
           5.3.1 RESEARCH, DESIGN, AND DEVELOPMENT CENTERS
           5.3.2 RAW MATERIAL SUPPLIERS
           5.3.3 3D AND 4D TECHNOLOGY AND SOFTWARE PROVIDERS
           5.3.4 ORIGINAL DEVICE MANUFACTURERS (ODMS)
           5.3.5 SUPPLIERS AND DISTRIBUTORS
           5.3.6 END USERS
    5.4 ECOSYSTEM/MARKET MAP 
           FIGURE 27 3D AND 4D TECHNOLOGY ECOSYSTEM
           TABLE 2 3D AND 4D TECHNOLOGY MARKET: ROLE OF PLAYERS IN ECOSYSTEM
    5.5 TRENDS/DISRUPTIONS IMPACTING CUSTOMERS’ BUSINESSES 
           FIGURE 28 TRENDS/DISRUPTIONS IMPACTING CUSTOMERS’ BUSINESSES
    5.6 TECHNOLOGY ANALYSIS 
           5.6.1 KEY TECHNOLOGIES
                    5.6.1.1 Structured light 3D scanning technology
                    5.6.1.2 Complementary metal-oxide-semiconductor (CMOS) technology
                    5.6.1.3 Stereoscopy or stereo imaging technology
           5.6.2 COMPLEMENTARY TECHNOLOGY
                    5.6.2.1 Laser triangulation technology
           5.6.3 ADJACENT TECHNOLOGIES
                    5.6.3.1 Artificial intelligence (AI)
                    5.6.3.2 Internet of Things (IoT)
                    5.6.3.3 Blockchain
    5.7 PORTER’S FIVE FORCES ANALYSIS 
           FIGURE 29 3D AND 4D TECHNOLOGY MARKET: PORTER’S FIVE FORCES ANALYSIS
           TABLE 3 3D AND 4D TECHNOLOGY MARKET: IMPACT ANALYSIS OF PORTER’S FIVE FORCES
           5.7.1 THREAT OF NEW ENTRANTS
           5.7.2 THREAT OF SUBSTITUTES
           5.7.3 BARGAINING POWER OF SUPPLIERS
           5.7.4 BARGAINING POWER OF BUYERS
           5.7.5 INTENSITY OF COMPETITIVE RIVALRY
    5.8 CASE STUDY ANALYSIS 
           5.8.1 3D SYSTEMS’ TITAN PELLET 3D PRINTER HELPED PRINT CRITICAL RACE CAR COMPONENT IN 36 HOURS
           5.8.2 CHRISTOPHER TOOL ACHIEVES FASTER INSPECTIONS WITH 3D-PRINTED CMM FIXTURES
           5.8.3 IMPLANT CONCIERGE UTILIZED STRATASYS TECHNOLOGY TO ENHANCE BUSINESS MODEL
           5.8.4 BWT ALPINE F1 TEAM BOLSTERS ADDITIVE MANUFACTURING WORKFLOW WITH 3D PRINTING SYSTEMS
           5.8.5 AUSTRALIA-BASED LITTLE HINGES SHOWS PROPERTIES EFFICIENTLY AND REMOTELY USING MATTERPORT’S PRO2 3D CAMERA
    5.9 TARIFF ANALYSIS 
           TABLE 4 MFN TARIFFS FOR HS CODE 852990-COMPLIANT PRODUCTS EXPORTED BY US
           TABLE 5 MFN TARIFFS FOR HS CODE 852990-COMPLIANT PRODUCTS EXPORTED BY CHINA
    5.10 REGULATORY LANDSCAPE 
           5.10.1 REGULATIONS
                    5.10.1.1 General Data Protection Regulation
                    5.10.1.2 Health Insurance Portability and Accountability Act (HIPAA), 1996
                    5.10.1.3 Federal Communications Commission (FCC) Certification
           5.10.2 STANDARDS
           5.10.3 REGULATORY BODIES, GOVERNMENT AGENCIES, AND OTHER ORGANIZATIONS
                     TABLE 6 NORTH AMERICA: LIST OF REGULATORY BODIES, GOVERNMENT AGENCIES, AND OTHER ORGANIZATIONS
                     TABLE 7 EUROPE: LIST OF REGULATORY BODIES, GOVERNMENT AGENCIES, AND OTHER ORGANIZATIONS
                     TABLE 8 ASIA PACIFIC: LIST OF REGULATORY BODIES, GOVERNMENT AGENCIES, AND OTHER ORGANIZATIONS
                     TABLE 9 ROW: LIST OF REGULATORY BODIES, GOVERNMENT AGENCIES, AND OTHER ORGANIZATIONS
    5.11 AVERAGE SELLING PRICE ANALYSIS 
           TABLE 10 AVERAGE SELLING PRICE OF 3D INPUT DEVICES
           FIGURE 30 AVERAGE SELLING PRICE OF 3D INPUT DEVICES
           5.11.1 AVERAGE SELLING PRICE OF 3D INPUT DEVICES OFFERED BY KEY PLAYERS, BY PRODUCT
                     FIGURE 31 AVERAGE SELLING PRICE OF 3D INPUT DEVICES OFFERED BY KEY PLAYERS, BY PRODUCT
                     TABLE 11 AVERAGE SELLING PRICE OF 3D INPUT DEVICES OFFERED BY KEY PLAYERS, BY PRODUCT
    5.12 TRADE ANALYSIS 
           TABLE 12 IMPORT DATA FOR HS CODE 852990-COMPLIANT PRODUCTS, BY COUNTRY, 2018–2022 (USD MILLION)
           TABLE 13 EXPORT DATA FOR HS CODE 852990-COMPLIANT PRODUCTS, BY COUNTRY, 2018–2022 (USD MILLION)
    5.13 PATENT ANALYSIS 
           TABLE 14 LIST OF FEW PATENTS RELATED TO 3D AND 4D TECHNOLOGY
           TABLE 15 TOP 20 PATENT OWNERS IN 3D AND 4D TECHNOLOGY MARKET IN LAST 10 YEARS
           FIGURE 32 TOP 10 COMPANIES WITH HIGHEST NUMBER OF PATENT APPLICATIONS IN LAST 10 YEARS
           FIGURE 33 NUMBER OF PATENTS GRANTED PER YEAR, 2013–2023
    5.14 KEY CONFERENCES AND EVENTS, 2024–2025 
           TABLE 16 3D AND 4D TECHNOLOGY MARKET: DETAILED LIST OF CONFERENCES AND EVENTS, 2024–2025
    5.15 INVESTMENT AND FUNDING SCENARIO 
           FIGURE 34 GLOBAL VENTURE-CAPITAL INVESTMENTS IN 3D PRINTING STARTUPS
    5.16 KEY STAKEHOLDERS AND BUYING PROCESS 
           5.16.1 KEY STAKEHOLDERS IN BUYING PROCESS
                     FIGURE 35 INFLUENCE OF STAKEHOLDERS ON BUYING PROCESS FOR TOP THREE VERTICALS
                     TABLE 17 INFLUENCE OF STAKEHOLDERS ON BUYING PROCESS FOR TOP THREE VERTICALS (%)
           5.16.2 BUYING CRITERIA
                     FIGURE 36 KEY BUYING CRITERIA FOR TOP THREE VERTICALS
                     TABLE 18 KEY BUYING CRITERIA FOR TOP THREE VERTICALS
 
6 3D AND 4D TECHNOLOGY MARKET, BY END-USE APPLICATION (Page No. - 97)
    6.1 INTRODUCTION 
           FIGURE 37 3D AND 4D TECHNOLOGY MARKET, BY END-USE APPLICATION
           FIGURE 38 3D NAVIGATION SEGMENT TO EXHIBIT HIGHEST CAGR DURING FORECAST PERIOD
           TABLE 19 3D AND 4D TECHNOLOGY MARKET, BY END-USE APPLICATION, 2020–2023 (USD MILLION)
           TABLE 20 3D AND 4D TECHNOLOGY MARKET, BY END-USE APPLICATION, 2024–2029 (USD MILLION)
           TABLE 21 3D AND 4D TECHNOLOGY MARKET, BY VERTICAL, 2020–2023 (USD MILLION)
           TABLE 22 3D AND 4D TECHNOLOGY MARKET, BY VERTICAL, 2024–2029 (USD MILLION)
           TABLE 23 3D AND 4D TECHNOLOGY MARKET, BY REGION, 2020–2023 (USD MILLION)
           TABLE 24 3D AND 4D TECHNOLOGY MARKET, BY REGION, 2024–2029 (USD MILLION)
    6.2 3D AND 4D GAMING 
           6.2.1 INCREASED EMPHASIS ON ENHANCING GAMING EXPERIENCE TO SUPPORT MARKET GROWTH
                    TABLE 25 3D AND 4D GAMING: 3D AND 4D TECHNOLOGY MARKET, BY VERTICAL, 2020–2023 (USD MILLION)
                    TABLE 26 3D AND 4D GAMING: 3D AND 4D TECHNOLOGY MARKET, BY VERTICAL, 2024–2029 (USD MILLION)
                    TABLE 27 3D AND 4D GAMING: 3D AND 4D TECHNOLOGY MARKET, BY REGION 2020–2023 (USD MILLION)
                    TABLE 28 3D AND 4D GAMING: 3D AND 4D TECHNOLOGY MARKET, BY REGION 2024–2029 (USD MILLION)
    6.3 3D AND 4D CINEMA 
           6.3.1 IMMERSIVE VIEWING EXPERIENCE OFFERED THROUGH SPECIAL EFFECTS AND GRAPHICS TO BOOST SEGMENTAL GROWTH
                    TABLE 29 3D AND 4D CINEMA: 3D AND 4D TECHNOLOGY MARKET, BY VERTICAL, 2020–2023 (USD MILLION)
                    TABLE 30 3D AND 4D CINEMA: 3D AND 4D TECHNOLOGY MARKET, BY VERTICAL, 2024–2029 (USD MILLION)
                    TABLE 31 3D AND 4D CINEMA: 3D AND 4D TECHNOLOGY MARKET, BY REGION 2020–2023 (USD MILLION)
                    TABLE 32 3D AND 4D CINEMA: 3D AND 4D TECHNOLOGY MARKET, BY REGION 2024–2029 (USD MILLION)
    6.4 3D NAVIGATION 
           6.4.1 RISING DEMAND FOR 3D NAVIGATION SYSTEMS FROM AUTOMOTIVE SECTOR TO DRIVE MARKET
                    TABLE 33 3D NAVIGATION: 3D AND 4D TECHNOLOGY MARKET, BY VERTICAL, 2020–2023 (USD MILLION)
                    TABLE 34 3D NAVIGATION: 3D AND 4D TECHNOLOGY MARKET, BY VERTICAL, 2024–2029 (USD MILLION)
                    TABLE 35 3D NAVIGATION: 3D AND 4D TECHNOLOGY MARKET, BY REGION 2020–2023 (USD MILLION)
                    TABLE 36 3D NAVIGATION: 3D AND 4D TECHNOLOGY MARKET, BY REGION 2024–2029 (USD MILLION)
    6.5 3D LAYOUT AND ANIMATION 
           6.5.1 WIDESPREAD ADOPTION OF 3D LAYOUT AND ANIMATION IN ENTERTAINMENT SECTOR TO DRIVE MARKET
                    TABLE 37 3D LAYOUT AND ANIMATION: 3D AND 4D TECHNOLOGY MARKET, BY VERTICAL, 2020–2023 (USD MILLION)
                    TABLE 38 3D LAYOUT AND ANIMATION: 3D AND 4D TECHNOLOGY MARKET, BY VERTICAL, 2024–2029 (USD MILLION)
                    TABLE 39 3D LAYOUT AND ANIMATION: 3D AND 4D TECHNOLOGY MARKET, BY REGION 2020–2023 (USD MILLION)
                    TABLE 40 3D LAYOUT AND ANIMATION: 3D AND 4D TECHNOLOGY MARKET, BY REGION 2024–2029 (USD MILLION)
    6.6 3D AND 4D MOTION CAPTURE 
           6.6.1 RISING DEMAND FOR HIGH-QUALITY ANIMATION AND SPECIAL EFFECTS IN ENTERTAINMENT INDUSTRY TO DRIVE MARKET
                    TABLE 41 3D AND 4D MOTION CAPTURE: 3D AND 4D TECHNOLOGY MARKET, BY VERTICAL, 2020–2023 (USD MILLION)
                    TABLE 42 3D AND 4D MOTION CAPTURE: 3D AND 4D TECHNOLOGY MARKET, BY VERTICAL, 2024–2029 (USD MILLION)
                    TABLE 43 3D AND 4D MOTION CAPTURE: 3D AND 4D TECHNOLOGY MARKET, BY REGION 2020–2023 (USD MILLION)
                    TABLE 44 3D AND 4D MOTION CAPTURE: 3D AND 4D TECHNOLOGY MARKET, BY REGION 2024–2029 (USD MILLION)
    6.7 3D MACHINE VISION 
           6.7.1 GROWING APPLICATIONS OF 3D MACHINE VISION SYSTEMS IN MANUFACTURING TO DRIVE MARKET
                    TABLE 45 3D MACHINE VISION: 3D AND 4D TECHNOLOGY MARKET, BY VERTICAL, 2020–2023 (USD MILLION)
                    TABLE 46 3D MACHINE VISION: 3D AND 4D TECHNOLOGY MARKET, BY VERTICAL, 2024–2029 (USD MILLION)
                    TABLE 47 3D MACHINE VISION: 3D AND 4D TECHNOLOGY MARKET, BY REGION 2020–2023 (USD MILLION)
                    TABLE 48 3D MACHINE VISION: 3D AND 4D TECHNOLOGY MARKET, BY REGION 2024–2029 (USD MILLION)
    6.8 3D AND 4D METROLOGY 
           6.8.1 RISING USE OF 3D METROLOGY SOLUTIONS TO INSPECT AUTOMOBILE COMPONENTS TO ACCELERATE MARKET GROWTH
                    TABLE 49 3D AND 4D METROLOGY: 3D AND 4D TECHNOLOGY MARKET, BY VERTICAL, 2020–2023 (USD MILLION)
                    TABLE 50 3D AND 4D METROLOGY: 3D AND 4D TECHNOLOGY MARKET, BY VERTICAL, 2024–2029 (USD MILLION)
                    TABLE 51 3D AND 4D METROLOGY: 3D AND 4D TECHNOLOGY MARKET, BY REGION 2020–2023 (USD MILLION)
                    TABLE 52 3D AND 4D METROLOGY: 3D AND 4D TECHNOLOGY MARKET, BY REGION 2024–2029 (USD MILLION)
    6.9 3D AND 4D GESTURE RECOGNITION 
           6.9.1 GROWING ADOPTION OF GESTURE RECOGNITION SYSTEMS IN VEHICLES TO INTERACT WITH IN-CAR DISPLAYS TO DRIVE MARKET
                    TABLE 53 3D AND 4D GESTURE RECOGNITION: 3D AND 4D TECHNOLOGY MARKET, BY VERTICAL, 2020–2023 (USD MILLION)
                    TABLE 54 3D AND 4D GESTURE RECOGNITION: 3D AND 4D TECHNOLOGY MARKET, BY VERTICAL, 2024–2029 (USD MILLION)
                    TABLE 55 3D AND 4D GESTURE RECOGNITION: 3D AND 4D TECHNOLOGY MARKET, BY REGION 2020–2023 (USD MILLION)
                    TABLE 56 3D AND 4D GESTURE RECOGNITION: 3D AND 4D TECHNOLOGY MARKET, BY REGION 2024–2029 (USD MILLION)
 
7 3D AND 4D TECHNOLOGY MARKET, BY SOLUTION TYPE (Page No. - 116)
    7.1 INTRODUCTION 
           FIGURE 39 3D AND 4D IMAGING SOLUTIONS SEGMENT TO REGISTER HIGHEST CAGR DURING FORECAST PERIOD
           TABLE 57 3D AND 4D TECHNOLOGY MARKET, BY SOLUTION TYPE, 2020–2023 (USD MILLION)
           TABLE 58 3D AND 4D TECHNOLOGY MARKET, BY SOLUTION TYPE, 2024–2029 (USD MILLION)
    7.2 3D AND 4D INPUT DEVICES, BY PRODUCT 
           TABLE 59 3D AND 4D INPUT DEVICES: 3D AND 4D TECHNOLOGY MARKET, BY PRODUCT, 2020–2023 (USD MILLION)
           TABLE 60 3D AND 4D INPUT DEVICES: 3D AND 4D TECHNOLOGY MARKET, BY PRODUCT, 2024–2029 (USD MILLION)
           TABLE 61 3D AND 4D INPUT DEVICES: 3D AND 4D TECHNOLOGY MARKET, BY PRODUCT, 2020–2023 (MILLION UNITS)
           TABLE 62 3D AND 4D INPUT DEVICES: 3D AND 4D TECHNOLOGY MARKET, BY PRODUCT, 2024–2029 (MILLION UNITS)
           TABLE 63 3D AND 4D INPUT DEVICES: 3D AND 4D TECHNOLOGY MARKET, BY VERTICAL, 2020–2023 (USD MILLION)
           TABLE 64 3D AND 4D INPUT DEVICES: 3D AND 4D TECHNOLOGY MARKET, BY VERTICAL, 2024–2029 (USD MILLION)
           TABLE 65 3D AND 4D INPUT DEVICES: 3D AND 4D TECHNOLOGY MARKET, BY REGION, 2020–2023 (USD MILLION)
           TABLE 66 3D AND 4D INPUT DEVICES: 3D AND 4D TECHNOLOGY MARKET, BY REGION, 2024–2029 (USD MILLION)
           7.2.1 3D AND 4D SCANNERS
                    7.2.1.1 Rising deployment of 3D and 4D scanners in healthcare vertical to drive market
                               TABLE 67 3D AND 4D SCANNERS: 3D AND 4D TECHNOLOGY MARKET, BY VERTICAL, 2020–2023 (USD MILLION)
                               TABLE 68 3D AND 4D SCANNERS: 3D AND 4D TECHNOLOGY MARKET, BY VERTICAL, 2024–2029 (USD MILLION)
                               TABLE 69 3D AND 4D SCANNERS: 3D AND 4D TECHNOLOGY MARKET, BY REGION, 2020–2023 (USD MILLION)
                               TABLE 70 3D AND 4D SCANNERS: 3D AND 4D TECHNOLOGY MARKET, BY REGION, 2024–2029 (USD MILLION)
           7.2.2 3D AND 4D CAMERAS
                    7.2.2.1 Increasing demand for 3D and 4D cameras across different verticals to drive market
                               TABLE 71 3D AND 4D CAMERAS: 3D AND 4D TECHNOLOGY MARKET, BY VERTICAL, 2020–2023 (USD MILLION)
                               TABLE 72 3D AND 4D CAMERAS: 3D AND 4D TECHNOLOGY MARKET, BY VERTICAL, 2024–2029 (USD MILLION)
                               TABLE 73 3D AND 4D CAMERAS: 3D AND 4D TECHNOLOGY MARKET, BY REGION, 2020–2023 (USD MILLION)
                               TABLE 74 3D AND 4D CAMERAS: 3D AND 4D TECHNOLOGY MARKET, BY REGION, 2024–2029 (USD MILLION)
           7.2.3 3D AND 4D SENSORS
                    7.2.3.1 Incorporation of AI and IoT in sensors to drive segmental landscape
                               TABLE 75 3D AND 4D SENSORS: 3D AND 4D TECHNOLOGY MARKET, BY VERTICAL, 2020–2023 (USD MILLION)
                               TABLE 76 3D AND 4D SENSORS: 3D AND 4D TECHNOLOGY MARKET, BY VERTICAL, 2024–2029 (USD MILLION)
                               TABLE 77 3D AND 4D SENSORS: 3D AND 4D TECHNOLOGY MARKET, BY REGION, 2020–2023 (USD MILLION)
                               TABLE 78 3D AND 4D SENSORS: 3D AND 4D TECHNOLOGY MARKET, BY REGION, 2024–2029 (USD MILLION)
    7.3 3D AND 4D IMAGING SOLUTIONS 
           TABLE 79 3D AND 4D IMAGING SOLUTIONS: 3D AND 4D TECHNOLOGY MARKET, BY APPLICATION, 2020–2023 (USD MILLION)
           TABLE 80 3D AND 4D IMAGING SOLUTIONS: 3D AND 4D TECHNOLOGY MARKET, BY APPLICATION, 2024–2029 (USD MILLION)
           TABLE 81 3D AND 4D IMAGING SOLUTIONS: 3D AND 4D TECHNOLOGY MARKET, BY VERTICAL, 2020–2023 (USD MILLION)
           TABLE 82 3D AND 4D IMAGING SOLUTIONS: 3D AND 4D TECHNOLOGY MARKET, BY VERTICAL, 2024–2029 (USD MILLION)
           TABLE 83 3D AND 4D IMAGING SOLUTIONS: 3D AND 4D TECHNOLOGY MARKET, BY REGION, 2020–2023 (USD MILLION)
           TABLE 84 3D AND 4D IMAGING SOLUTIONS: 3D AND 4D TECHNOLOGY MARKET, BY REGION, 2024–2029 (USD MILLION)
           7.3.1 3D AND 4D MODELING
                    7.3.1.1 Surging demand for 3D and 4D content to fuel adoption of 3D and 4D modeling
           7.3.2 3D AND 4D SCANNING
                    7.3.2.1 Increasing adoption of 3D and 4D scanning in manufacturing and healthcare sectors to drive market
           7.3.3 3D AND 4D RENDERING
                    7.3.3.1 Rising emphasis on incorporating special effects in entertainment industry to foster market growth
           7.3.4 3D AND 4D IMAGE RECONSTRUCTION
                    7.3.4.1 Increasing adoption of 3D and 4D image reconstruction in healthcare sector to contribute to market growth
    7.4 3D OUTPUT DEVICES, BY PRODUCT 
           TABLE 85 3D OUTPUT DEVICES: 3D AND 4D TECHNOLOGY MARKET, BY PRODUCT, 2020–2023 (USD MILLION)
           TABLE 86 3D OUTPUT DEVICES: 3D AND 4D TECHNOLOGY MARKET, BY PRODUCT, 2024–2029 (USD MILLION)
           TABLE 87 3D OUTPUT DEVICES: 3D AND 4D TECHNOLOGY MARKET, BY VERTICAL, 2020–2023 (USD MILLION)
           TABLE 88 3D OUTPUT DEVICES: 3D AND 4D TECHNOLOGY MARKET, BY VERTICAL, 2024–2029 (USD MILLION)
           TABLE 89 3D OUTPUT DEVICES: 3D AND 4D TECHNOLOGY MARKET, BY REGION, 2020–2023 (USD MILLION)
           TABLE 90 3D OUTPUT DEVICES: 3D AND 4D TECHNOLOGY MARKET, BY REGION, 2024–2029 (USD MILLION)
           7.4.1 3D DISPLAYS
                    TABLE 91 3D DISPLAYS: 3D AND 4D TECHNOLOGY MARKET, BY VERTICAL, 2020–2023 (USD MILLION)
                    TABLE 92 3D DISPLAYS: 3D AND 4D TECHNOLOGY MARKET, BY VERTICAL, 2024–2029 (USD MILLION)
                    TABLE 93 3D DISPLAYS: 3D AND 4D TECHNOLOGY MARKET, BY TYPE, 2020–2023 (USD MILLION)
                    TABLE 94 3D DISPLAYS: 3D AND 4D TECHNOLOGY MARKET, BY TYPE, 2024–2029 (USD MILLION)
                    TABLE 95 3D DISPLAYS: 3D AND 4D TECHNOLOGY MARKET, BY REGION, 2020–2023 (USD MILLION)
                    TABLE 96 3D DISPLAYS: 3D AND 4D TECHNOLOGY MARKET, BY REGION, 2024–2029 (USD MILLION)
                    7.4.1.1 3D head-mounted displays
                               7.4.1.1.1 Ability to enhance virtual environments and replicate real-world objects into virtual environments to drive segment
                    7.4.1.2 3D digital signage displays
                               7.4.1.2.1 Adoption of 3D digital signage displays for advertising applications to drive market
           7.4.2 3D SMARTPHONES
                    7.4.2.1 High adoption of 3D smartphones for AR applications to drive market
                               TABLE 97 3D SMARTPHONES: 3D AND 4D TECHNOLOGY MARKET, BY VERTICAL, 2020–2023 (USD MILLION)
                               TABLE 98 3D SMARTPHONES: 3D AND 4D TECHNOLOGY MARKET, BY VERTICAL, 2024–2029 (USD MILLION)
                               TABLE 99 3D SMARTPHONES: 3D AND 4D TECHNOLOGY MARKET, BY REGION, 2020–2023 (USD MILLION)
                               TABLE 100 3D SMARTPHONES: 3D AND 4D TECHNOLOGY MARKET, BY REGION, 2024–2029 (USD MILLION)
           7.4.3 3D TELEVISIONS
                    7.4.3.1 Growing popularity of 3D movies and games to boost demand for 3D televisions
                               TABLE 101 3D TELEVISIONS: 3D AND 4D TECHNOLOGY MARKET, BY VERTICAL, 2020–2023 (USD MILLION)
                               TABLE 102 3D TELEVISIONS: 3D AND 4D TECHNOLOGY MARKET, BY VERTICAL, 2024–2029 (USD MILLION)
                               TABLE 103 3D TELEVISIONS: 3D AND 4D TECHNOLOGY MARKET, BY REGION, 2020–2023 (USD MILLION)
                               TABLE 104 3D TELEVISIONS: 3D AND 4D TECHNOLOGY MARKET, BY REGION, 2024–2029 (USD MILLION)
           7.4.4 3D PROJECTORS
                    7.4.4.1 Rising demand for 3D projectors in entertainment sector to propel market
                               TABLE 105 3D PROJECTORS: 3D AND 4D TECHNOLOGY MARKET, BY VERTICAL, 2020–2023 (USD MILLION)
                               TABLE 106 3D PROJECTORS: 3D AND 4D TECHNOLOGY MARKET, BY VERTICAL, 2024–2029 (USD MILLION)
                               TABLE 107 3D PROJECTORS: 3D AND 4D TECHNOLOGY MARKET, BY REGION, 2020–2023 (USD MILLION)
                               TABLE 108 3D PROJECTORS: 3D AND 4D TECHNOLOGY MARKET, BY REGION, 2024–2029 (USD MILLION)
           7.4.5 3D PRINTERS
                    7.4.5.1 Rising adoption of 3D printers in military and defense vertical to augment market growth
                               TABLE 109 3D PRINTERS: 3D AND 4D TECHNOLOGY MARKET, BY VERTICAL, 2020–2023 (USD MILLION)
                               TABLE 110 3D PRINTERS: 3D AND 4D TECHNOLOGY MARKET, BY VERTICAL, 2024–2029 (USD MILLION)
                               TABLE 111 3D PRINTERS: 3D AND 4D TECHNOLOGY MARKET, BY REGION, 2020–2023 (USD MILLION)
                               TABLE 112 3D PRINTERS: 3D AND 4D TECHNOLOGY MARKET, BY REGION, 2024–2029 (USD MILLION)
 
8 3D AND 4D TECHNOLOGY MARKET, BY VERTICAL (Page No. - 147)
    8.1 INTRODUCTION 
           FIGURE 40 3D AND 4D TECHNOLOGY MARKET, BY VERTICAL
           FIGURE 41 ENTERTAINMENT SEGMENT TO HOLD LARGEST MARKET SHARE BETWEEN 2024 AND 2029
           TABLE 113 3D AND 4D TECHNOLOGY MARKET, BY VERTICAL, 2020–2023 (USD MILLION)
           TABLE 114 3D AND 4D TECHNOLOGY MARKET, BY VERTICAL, 2024–2029 (USD MILLION)
    8.2 MILITARY AND DEFENSE 
           8.2.1 MILITARY AND DEFENSE SEGMENT TO REGISTER HIGHEST GROWTH DURING FORECAST PERIOD
                    TABLE 115 MILITARY AND DEFENSE: 3D AND 4D TECHNOLOGY MARKET, BY 3D AND 4D INPUT DEVICE, 2020–2023 (USD MILLION)
                    TABLE 116 MILITARY AND DEFENSE: 3D AND 4D TECHNOLOGY MARKET, BY 3D AND 4D INPUT DEVICE, 2024–2029 (USD MILLION)
                    TABLE 117 MILITARY AND DEFENSE: 3D AND 4D TECHNOLOGY MARKET, BY 3D OUTPUT DEVICE, 2020–2023 (USD MILLION)
                    TABLE 118 MILITARY AND DEFENSE: 3D AND 4D TECHNOLOGY MARKET, BY 3D OUTPUT DEVICE, 2024–2029 (USD MILLION)
    8.3 AUTOMOTIVE 
           8.3.1 INCREASING ADOPTION OF AUTONOMOUS VEHICLES TO FUEL REQUIREMENT FOR 3D AND 4D DEVICES
                    TABLE 119 AUTOMOTIVE: 3D AND 4D TECHNOLOGY MARKET, BY 3D AND 4D INPUT DEVICE, 2020–2023 (USD MILLION)
                    TABLE 120 AUTOMOTIVE: 3D AND 4D TECHNOLOGY MARKET, BY 3D AND 4D INPUT DEVICE, 2024–2029 (USD MILLION)
                    TABLE 121 AUTOMOTIVE: 3D AND 4D TECHNOLOGY MARKET, BY 3D OUTPUT DEVICE, 2020–2023 (USD MILLION)
                    TABLE 122 AUTOMOTIVE: 3D AND 4D TECHNOLOGY MARKET, BY 3D OUTPUT DEVICE, 2024–2029 (USD MILLION)
    8.4 CONSTRUCTION 
           8.4.1 INCREASED ADOPTION OF BIM APPLICATIONS IN CONSTRUCTION TO DRIVE MARKET
                    TABLE 123 CONSTRUCTION: 3D AND 4D TECHNOLOGY MARKET, BY 3D AND 4D INPUT DEVICE, 2020–2023 (USD MILLION)
                    TABLE 124 CONSTRUCTION: 3D AND 4D TECHNOLOGY MARKET, BY 3D AND 4D INPUT DEVICE, 2024–2029 (USD MILLION)
                    TABLE 125 CONSTRUCTION: 3D AND 4D TECHNOLOGY MARKET, BY 3D OUTPUT DEVICE, 2020–2023 (USD MILLION)
                    TABLE 126 CONSTRUCTION: 3D AND 4D TECHNOLOGY MARKET, BY 3D OUTPUT DEVICE, 2024–2029 (USD MILLION)
    8.5 CONSUMER ELECTRONICS 
           8.5.1 RISING DEMAND FOR HIGH RESOLUTION IN CONSUMER ELECTRONICS DEVICES TO DRIVE MARKET
                    TABLE 127 CONSUMER ELECTRONICS: 3D AND 4D TECHNOLOGY MARKET, BY 3D AND 4D INPUT DEVICE, 2020–2023 (USD MILLION)
                    TABLE 128 CONSUMER ELECTRONICS: 3D AND 4D TECHNOLOGY MARKET, BY 3D AND 4D INPUT DEVICE, 2024–2029 (USD MILLION)
                    TABLE 129 CONSUMER ELECTRONICS: 3D AND 4D TECHNOLOGY MARKET, BY 3D OUTPUT DEVICE, 2020–2023 (USD MILLION)
                    TABLE 130 CONSUMER ELECTRONICS: 3D AND 4D TECHNOLOGY MARKET, BY 3D OUTPUT DEVICE, 2024–2029 (USD MILLION)
    8.6 INDUSTRIAL 
           8.6.1 INCREASING DEMAND FOR RAPID PROTOTYPING TO AUGMENT MARKET GROWTH
                    TABLE 131 INDUSTRIAL: 3D AND 4D TECHNOLOGY MARKET, BY 3D AND 4D INPUT DEVICE, 2020–2023 (USD MILLION)
                    TABLE 132 INDUSTRIAL: 3D AND 4D TECHNOLOGY MARKET, BY 3D AND 4D INPUT DEVICE, 2024–2029 (USD MILLION)
                    TABLE 133 INDUSTRIAL: 3D AND 4D TECHNOLOGY MARKET, BY 3D OUTPUT DEVICE, 2020–2023 (USD MILLION)
                    TABLE 134 INDUSTRIAL: 3D AND 4D TECHNOLOGY MARKET, BY 3D OUTPUT DEVICE, 2024–2029 (USD MILLION)
    8.7 ENTERTAINMENT 
           8.7.1 RISING DEMAND FOR TRULY IMMERSIVE AND HIGH-DEFINITION EXPERIENCE TO BOOST ADOPTION OF 3D TECHNOLOGY
                    TABLE 135 ENTERTAINMENT: 3D AND 4D TECHNOLOGY MARKET, BY 3D AND 4D INPUT DEVICE, 2020–2023 (USD MILLION)
                    TABLE 136 ENTERTAINMENT: 3D AND 4D TECHNOLOGY MARKET, BY 3D AND 4D INPUT DEVICE, 2024–2029 (USD MILLION)
                    TABLE 137 ENTERTAINMENT: 3D AND 4D TECHNOLOGY MARKET, BY 3D OUTPUT DEVICE, 2020–2023 (USD MILLION)
                    TABLE 138 ENTERTAINMENT: 3D AND 4D TECHNOLOGY MARKET, BY 3D OUTPUT DEVICE, 2024–2029 (USD MILLION)
    8.8 HEALTHCARE 
           8.8.1 GROWING POPULARITY OF 3D MEDICAL IMAGING TO DRIVE MARKET
                    TABLE 139 HEALTHCARE: 3D AND 4D TECHNOLOGY MARKET, BY 3D AND 4D INPUT DEVICE, 2020–2023 (USD MILLION)
                    TABLE 140 HEALTHCARE: 3D AND 4D TECHNOLOGY MARKET, BY 3D AND 4D INPUT DEVICE, 2024–2029 (USD MILLION)
                    TABLE 141 HEALTHCARE: 3D AND 4D TECHNOLOGY MARKET, BY 3D OUTPUT DEVICE, 2020–2023 (USD MILLION)
                    TABLE 142 HEALTHCARE: 3D AND 4D TECHNOLOGY MARKET, BY 3D OUTPUT DEVICE, 2024–2029 (USD MILLION)
    8.9 OTHER VERTICALS 
           TABLE 143 OTHER VERTICALS: 3D AND 4D TECHNOLOGY MARKET, BY 3D AND 4D INPUT DEVICE, 2020–2023 (USD MILLION)
           TABLE 144 OTHER VERTICALS: 3D AND 4D TECHNOLOGY MARKET, BY 3D AND 4D INPUT DEVICE, 2024–2029 (USD MILLION)
           TABLE 145 OTHER VERTICALS: 3D AND 4D TECHNOLOGY MARKET, BY 3D OUTPUT DEVICE, 2020–2023 (USD MILLION)
           TABLE 146 OTHER VERTICALS: 3D AND 4D TECHNOLOGY MARKET, BY 3D OUTPUT DEVICE, 2024–2029 (USD MILLION)
 
9 TRANSITION FROM 3D TO 4D TECHNOLOGY (Page No. - 170)
    9.1 INTRODUCTION 
    9.2 DIFFERENCE BETWEEN 3D AND 4D 
           TABLE 147 DIFFERENCE BETWEEN 3D AND 4D
    9.3 VARIOUS DEPLOYMENT MODES IN 3D IMAGING 
           9.3.1 ON-PREMISES
           9.3.2 CLOUD
    9.4 3D SENSOR CONNECTIVITY 
           9.4.1 WIRED NETWORK CONNECTIVITY
           9.4.2 TYPES OF WIRED NETWORKS
                    9.4.2.1 KNX
                    9.4.2.2 LONWORKS
           9.4.3 WIRELESS NETWORK CONNECTIVITY
    9.5 SCANNING TECHNIQUES USED IN 3D SCANNERS 
 
10 3D AND 4D TECHNOLOGY MARKET, BY REGION (Page No. - 173)
     10.1 INTRODUCTION 
             FIGURE 42 3D AND 4D TECHNOLOGY MARKET, BY REGION
             FIGURE 43 ASIA PACIFIC TO REGISTER HIGHEST GROWTH RATE DURING FORECAST PERIOD
             TABLE 148 3D AND 4D TECHNOLOGY MARKET, BY REGION, 2020–2023 USD MILLION)
             TABLE 149 3D AND 4D TECHNOLOGY MARKET, BY REGION, 2024–2029 (USD MILLION)
     10.2 NORTH AMERICA 
             10.2.1 NORTH AMERICA: RECESSION IMPACT
                        FIGURE 44 NORTH AMERICA: 3D AND 4D TECHNOLOGY MARKET SNAPSHOT
                        TABLE 150 NORTH AMERICA: 3D AND 4D TECHNOLOGY MARKET, BY 3D AND 4D INPUT DEVICE, 2020–2023 (USD MILLION)
                        TABLE 151 NORTH AMERICA: 3D AND 4D TECHNOLOGY MARKET, BY 3D AND 4D INPUT DEVICE, 2024–2029 (USD MILLION)
                        TABLE 152 NORTH AMERICA: 3D AND 4D TECHNOLOGY MARKET, BY 3D OUTPUT DEVICE, 2020–2023 (USD MILLION)
                        TABLE 153 NORTH AMERICA: 3D AND 4D TECHNOLOGY MARKET, BY 3D OUTPUT DEVICE, 2024–2029 (USD MILLION)
                        TABLE 154 NORTH AMERICA: 3D AND 4D TECHNOLOGY MARKET, BY END-USE APPLICATION, 2020–2023 (USD MILLION)
                        TABLE 155 NORTH AMERICA: 3D AND 4D TECHNOLOGY MARKET, BY END-USE APPLICATION, 2024–2029 (USD MILLION)
                        TABLE 156 NORTH AMERICA: 3D AND 4D TECHNOLOGY MARKET, BY COUNTRY, 2020–2023 (USD MILLION)
                        TABLE 157 NORTH AMERICA: 3D AND 4D TECHNOLOGY MARKET, BY COUNTRY, 2024–2029 (USD MILLION)
             10.2.2 US
                        10.2.2.1 Increasing adoption of 3D and 4D solutions across various industries to drive market
             10.2.3 CANADA
                        10.2.3.1 Increasing adoption of 3D and 4D technology in healthcare sector to contribute to market growth
             10.2.4 MEXICO
                        10.2.4.1 Rising incorporation of 3D and 4D technology in manufacturing processes to drive market
     10.3 EUROPE 
             10.3.1 EUROPE: RECESSION IMPACT
                        FIGURE 45 EUROPE: 3D AND 4D TECHNOLOGY MARKET SNAPSHOT
                        TABLE 158 EUROPE: 3D AND 4D TECHNOLOGY MARKET, BY 3D AND 4D INPUT DEVICE, 2020–2023 (USD MILLION)
                        TABLE 159 EUROPE: 3D AND 4D TECHNOLOGY MARKET, BY 3D AND 4D INPUT DEVICE, 2024–2029 (USD MILLION)
                        TABLE 160 EUROPE: 3D AND 4D TECHNOLOGY MARKET, BY 3D OUTPUT DEVICE, 2020–2023 (USD MILLION)
                        TABLE 161 EUROPE: 3D AND 4D TECHNOLOGY MARKET, BY 3D OUTPUT DEVICE, 2024–2029 (USD MILLION)
                        TABLE 162 EUROPE: 3D AND 4D TECHNOLOGY MARKET, BY END-USE APPLICATION, 2020–2023 (USD MILLION)
                        TABLE 163 EUROPE: 3D AND 4D TECHNOLOGY MARKET, BY END-USE APPLICATION, 2024–2029 (USD MILLION)
                        TABLE 164 EUROPE: 3D AND 4D TECHNOLOGY MARKET, BY COUNTRY, 2020–2023 (USD MILLION)
                        TABLE 165 EUROPE: 3D AND 4D TECHNOLOGY MARKET, BY COUNTRY, 2024–2029 (USD MILLION)
             10.3.2 UK
                        10.3.2.1 Increasing investments in developing VR-based solutions across industries to augment market growth
             10.3.3 GERMANY
                        10.3.3.1 Rising demand from automotive industry to expedite market growth
             10.3.4 FRANCE
                        10.3.4.1 Increasing government initiatives to boost market growth
             10.3.5 ITALY
                        10.3.5.1 Presence of companies and universities actively involved in developing 3D imaging technologies to drive market
             10.3.6 SPAIN
                        10.3.6.1 Strong demand for advanced imaging solutions to drive market
             10.3.7 REST OF EUROPE
     10.4 ASIA PACIFIC 
             10.4.1 ASIA PACIFIC: RECESSION IMPACT
                        FIGURE 46 ASIA PACIFIC: 3D AND 4D TECHNOLOGY MARKET SNAPSHOT
                        TABLE 166 ASIA PACIFIC: 3D AND 4D TECHNOLOGY MARKET, BY 3D AND 4D INPUT DEVICE, 2020–2023 (USD MILLION)
                        TABLE 167 ASIA PACIFIC: 3D AND 4D TECHNOLOGY MARKET, BY 3D AND 4D INPUT DEVICE, 2024–2029 (USD MILLION)
                        TABLE 168 ASIA PACIFIC: 3D AND 4D TECHNOLOGY MARKET, BY 3D OUTPUT DEVICE, 2020–2023 (USD MILLION)
                        TABLE 169 ASIA PACIFIC: 3D AND 4D TECHNOLOGY MARKET, BY 3D OUTPUT DEVICE, 2024–2029 (USD MILLION)
                        TABLE 170 ASIA PACIFIC: 3D AND 4D TECHNOLOGY MARKET, BY END-USE APPLICATION, 2020–2023 (USD MILLION)
                        TABLE 171 ASIA PACIFIC: 3D AND 4D TECHNOLOGY MARKET, BY END-USE APPLICATION, 2024–2029 (USD MILLION)
                        TABLE 172 ASIA PACIFIC: 3D AND 4D TECHNOLOGY MARKET, BY COUNTRY, 2020–2023 (USD MILLION)
                        TABLE 173 ASIA PACIFIC: 3D AND 4D TECHNOLOGY MARKET, BY COUNTRY, 2024–2029 (USD MILLION)
             10.4.2 CHINA
                        10.4.2.1 Growing demand for cutting-edge imaging technologies in entertainment industry to drive market
             10.4.3 JAPAN
                        10.4.3.1 Growth of end-user industries to boost demand for 3D and 4D technology solutions
             10.4.4 SOUTH KOREA
                        10.4.4.1 Increasing investments in industrial automation to boost market growth
             10.4.5 INDIA
                        10.4.5.1 Increasing adoption of 3D and 4D solutions in medical imaging to support market growth
             10.4.6 REST OF ASIA PACIFIC
     10.5 REST OF THE WORLD 
             10.5.1 ROW: RECESSION IMPACT
                        FIGURE 47 ROW: 3D AND 4D TECHNOLOGY MARKET SNAPSHOT
             10.5.2 MIDDLE EAST & AFRICA
                        10.5.2.1 GCC countries
                                     10.5.2.1.1 Growing investments in urban planning and infrastructure development to propel market
                        10.5.2.2 Rest of Middle East & Africa
                                     TABLE 174 ROW: 3D AND 4D TECHNOLOGY MARKET, BY 3D AND 4D INPUT DEVICE, 2020–2023 (USD MILLION)
                                     TABLE 175 ROW: 3D AND 4D TECHNOLOGY MARKET, BY 3D AND 4D INPUT DEVICE, 2024–2029 (USD MILLION)
                                     TABLE 176 ROW: 3D AND 4D TECHNOLOGY MARKET, BY 3D OUTPUT DEVICE, 2020–2023 (USD MILLION)
                                     TABLE 177 ROW: 3D AND 4D TECHNOLOGY MARKET, BY 3D OUTPUT DEVICE, 2024–2029 (USD MILLION)
                                     TABLE 178 ROW: 3D AND 4D TECHNOLOGY MARKET, BY END-USE APPLICATION, 2020–2023 USD MILLION)
                                     TABLE 179 ROW: 3D AND 4D TECHNOLOGY MARKET, BY END-USE APPLICATION, 2024–2029 (USD MILLION)
                                     TABLE 180 ROW: 3D AND 4D TECHNOLOGY MARKET, BY REGION, 2020–2023 (USD MILLION)
                                     TABLE 181 ROW: 3D AND 4D TECHNOLOGY MARKET, BY REGION, 2024–2029 (USD MILLION)
                                     TABLE 182 MIDDLE EAST AND AFRICA: 3D AND 4D TECHNOLOGY MARKET, BY REGION, 2020–2023 (USD MILLION)
                                     TABLE 183 MIDDLE EAST AND AFRICA: 3D AND 4D TECHNOLOGY MARKET, BY REGION, 2024–2029 (USD MILLION)
             10.5.3 SOUTH AMERICA
                        10.5.3.1 Government support for 3D printing to drive market
 
11 COMPETITIVE LANDSCAPE (Page No. - 207)
     11.1 OVERVIEW 
     11.2 STRATEGIES ADOPTED BY KEY PLAYERS, 2019–2023 
             TABLE 184 OVERVIEW OF STRATEGIES ADOPTED BY KEY PLAYERS, 2019–2023
     11.3 REVENUE ANALYSIS OF TOP FIVE PLAYERS, 2018–2022 
             FIGURE 48 REVENUE ANALYSIS OF TOP FIVE PLAYERS, 2018–2022
     11.4 MARKET SHARE ANALYSIS, 2023 
             FIGURE 49 3D AND 4D TECHNOLOGY MARKET SHARE ANALYSIS, 2023
             TABLE 185 3D AND 4D TECHNOLOGY MARKET: DEGREE OF COMPETITION
     11.5 COMPANY VALUATION AND FINANCIAL METRICS 
             FIGURE 50 MARKET CAPITALIZATION, 2022 (USD BILLION)
             FIGURE 51 FINANCIAL METRICS (EV/EBITDA), 2022
     11.6 BRAND/PRODUCT COMPARISON 
             FIGURE 52 BRAND/PRODUCT COMPARISON
     11.7 COMPANY EVALUATION MATRIX: KEY PLAYERS 
             11.7.1 STARS
             11.7.2 EMERGING LEADERS
             11.7.3 PERVASIVE PLAYERS
             11.7.4 PARTICIPANTS
                        FIGURE 53 3D AND 4D TECHNOLOGY MARKET: COMPANY EVALUATION MATRIX (KEY PLAYERS), 2023
             11.7.5 COMPANY FOOTPRINT
                        TABLE 186 OVERALL COMPANY FOOTPRINT
                        TABLE 187 COMPANY APPLICATION FOOTPRINT
                        TABLE 188 COMPANY SOLUTION TYPE FOOTPRINT
                        TABLE 189 COMPANY VERTICAL FOOTPRINT
                        TABLE 190 COMPANY REGION FOOTPRINT
     11.8 COMPANY EVALUATION MATRIX: STARTUPS/SMES 
             11.8.1 PROGRESSIVE COMPANIES
             11.8.2 RESPONSIVE COMPANIES
             11.8.3 DYNAMIC COMPANIES
             11.8.4 STARTING BLOCKS
                        FIGURE 54 3D AND 4D TECHNOLOGY MARKET: COMPANY EVALUATION MATRIX (STARTUPS/SMES), 2023
             11.8.5 COMPETITIVE BENCHMARKING
                        TABLE 191 3D AND 4D TECHNOLOGY MARKET: LIST OF KEY STARTUPS/SMES
                        TABLE 192 3D AND 4D TECHNOLOGY MARKET: COMPETITIVE BENCHMARKING OF KEY STARTUPS/SMES
     11.9 COMPETITIVE SCENARIO 
             11.9.1 PRODUCT LAUNCHES/DEVELOPMENTS
                        TABLE 193 3D AND 4D TECHNOLOGY MARKET: PRODUCT LAUNCHES/DEVELOPMENTS, JANUARY 2020–JANUARY 2024
             11.9.2 DEALS
                        TABLE 194 3D AND 4D TECHNOLOGY MARKET: DEALS, SEPTEMBER 2020–FEBRUARY 2024
 
12 COMPANY PROFILES (Page No. - 244)
     12.1 INTRODUCTION 
     12.2 KEY PLAYERS 
(Business overview, Products offered, Products offered, Recent developments, Product launches/developments, Deals, MnM view, Key Strengths/Right to win, Strategic choices made, and Weaknesses and Competitive threats)*  
             12.2.1 SAMSUNG
                        TABLE 195 SAMSUNG: COMPANY OVERVIEW
                        FIGURE 55 SAMSUNG: COMPANY SNAPSHOT
                        TABLE 196 SAMSUNG: PRODUCTS OFFERED
                        TABLE 197 SAMSUNG: PRODUCT LAUNCHES/DEVELOPMENTS
                        TABLE 198 SAMSUNG: DEALS
             12.2.2 GE HEALTHCARE
                        TABLE 199 GE HEALTHCARE: COMPANY OVERVIEW
                        FIGURE 56 GE HEALTHCARE: COMPANY SNAPSHOT
                        TABLE 200 GE HEALTHCARE: PRODUCTS OFFERED
                        TABLE 201 GE HEALTHCARE: PRODUCT LAUNCHES/DEVELOPMENTS
                        TABLE 202 GE HEALTHCARE: DEALS
             12.2.3 HEXAGON AB
                        TABLE 203 HEXAGON AB: COMPANY OVERVIEW
                        FIGURE 57 HEXAGON AB: COMPANY SNAPSHOT
                        TABLE 204 HEXAGON AB: PRODUCTS OFFERED
                        TABLE 205 HEXAGON AB: PRODUCT LAUNCHES/DEVELOPMENTS
                        TABLE 206 HEXAGON AB: DEALS
             12.2.4 AUTODESK INC.
                        TABLE 207 AUTODESK INC.: COMPANY OVERVIEW
                        FIGURE 58 AUTODESK INC.: COMPANY SNAPSHOT
                        TABLE 208 AUTODESK INC.: PRODUCTS OFFERED
                        TABLE 209 AUTODESK INC.: PRODUCT LAUNCHES/DEVELOPMENTS
                        TABLE 210 AUTODESK INC.: DEALS
             12.2.5 SONY GROUP CORPORATION
                        TABLE 211 SONY GROUP CORPORATION: COMPANY OVERVIEW
                        FIGURE 59 SONY GROUP CORPORATION: COMPANY SNAPSHOT
                        TABLE 212 SONY GROUP CORPORATION: PRODUCTS OFFERED
                        TABLE 213 SONY GROUP CORPORATION: PRODUCT LAUNCHES/DEVELOPMENTS
                        TABLE 214 SONY GROUP CORPORATION: DEALS
             12.2.6 DASSAULT SYSTÈMES
                        TABLE 215 DASSAULT SYSTÈMES: COMPANY OVERVIEW
                        FIGURE 60 DASSAULT SYSTÈMES: COMPANY SNAPSHOT
                        TABLE 216 DASSAULT SYSTÈMES: PRODUCTS OFFERED
                        TABLE 217 DASSAULT SYSTÈMES: PRODUCT LAUNCHES/DEVELOPMENTS
                        TABLE 218 DASSAULT SYSTÈMES: DEALS
             12.2.7 STRATASYS
                        TABLE 219 STRATASYS: COMPANY OVERVIEW
                        FIGURE 61 STRATASYS: COMPANY SNAPSHOT
                        TABLE 220 STRATASYS: PRODUCTS OFFERED
                        TABLE 221 STRATASYS: PRODUCT LAUNCHES/DEVELOPMENTS
                        TABLE 222 STRATASYS: DEALS
             12.2.8 FARO
                        TABLE 223 FARO: COMPANY OVERVIEW
                        FIGURE 62 FARO: COMPANY SNAPSHOT
                        TABLE 224 FARO: PRODUCTS OFFERED
                        TABLE 225 FARO: PRODUCT LAUNCHES/DEVELOPMENTS
                        TABLE 226 FARO: DEALS
             12.2.9 3D SYSTEMS, INC.
                        TABLE 227 3D SYSTEMS, INC.: COMPANY OVERVIEW
                        FIGURE 63 3D SYSTEMS, INC.: COMPANY SNAPSHOT
                        TABLE 228 3D SYSTEMS, INC.: PRODUCTS OFFERED
                        TABLE 229 3D SYSTEMS, INC.: PRODUCT LAUNCHES/DEVELOPMENTS
                        TABLE 230 3D SYSTEMS, INC.: DEALS
             12.2.10 VICON MOTION SYSTEMS LTD
                        TABLE 231 VICON MOTION SYSTEMS LTD: COMPANY OVERVIEW
                        FIGURE 64 VICON MOTION SYSTEMS LTD: COMPANY SNAPSHOT
                        TABLE 232 VICON MOTION SYSTEMS LTD: PRODUCTS OFFERED
                        TABLE 233 VICON MOTION SYSTEMS LTD: PRODUCT LAUNCHES/DEVELOPMENTS
                        TABLE 234 VICON MOTION SYSTEMS LTD: DEALS
*Details on Business overview, Products offered, Recent developments, Product launches/developments, Deals, MnM view, Key Strengths/Right to win, Strategic choices made, and Weaknesses and Competitive threats might not be captured in case of unlisted companies.  
     12.3 OTHER PLAYERS 
             12.3.1 PANASONIC HOLDINGS CORPORATION
                        TABLE 235 PANASONIC HOLDINGS CORPORATION: COMPANY OVERVIEW
             12.3.2 KONINKLIJKE PHILIPS N.V.
                        TABLE 236 KONINKLIJKE PHILIPS N.V.: COMPANY OVERVIEW
             12.3.3 QUALISYS
                        TABLE 237 QUALISYS: COMPANY OVERVIEW
             12.3.4 BARCO
                        TABLE 238 BARCO: COMPANY OVERVIEW
             12.3.5 GOOGLE
                        TABLE 239 GOOGLE: COMPANY OVERVIEW
             12.3.6 COGNEX CORPORATION
                        TABLE 240 COGNEX CORPORATION: COMPANY OVERVIEW
             12.3.7 LG ELECTRONICS
                        TABLE 241 LG ELECTRONICS: COMPANY OVERVIEW
             12.3.8 BASLER AG
                        TABLE 242 BASLER AG: COMPANY OVERVIEW
             12.3.9 DREAMWORKS ANIMATION
                        TABLE 243 DREAMWORKS ANIMATION: COMPANY OVERVIEW
             12.3.10 DOLBY LABORATORIES, INC.
                        TABLE 244 DOLBY LABORATORIES, INC.: COMPANY OVERVIEW
             12.3.11 NANSENSE INC.
                        TABLE 245 NANSENSE INC.: COMPANY OVERVIEW
             12.3.12 QUIDIENT
                        TABLE 246 QUIDIENT: COMPANY OVERVIEW
             12.3.13 ROKOKO
                        TABLE 247 ROKOKO: COMPANY OVERVIEW
             12.3.14 4D SENSOR CO., LTD.
                        TABLE 248 4D SENSOR CO., LTD.: COMPANY OVERVIEW
             12.3.15 VAYYAR IMAGING
                        TABLE 249 VAYYAR IMAGING: COMPANY OVERVIEW
             12.3.16 MATTERPORT, INC.
                        TABLE 250 MATTERPORT, INC.: COMPANY OVERVIEW
             12.3.17 CREALITY
                        TABLE 251 CREALITY: COMPANY OVERVIEW
             12.3.18 INTAMSYS
                        TABLE 252 INTAMSYS: COMPANY OVERVIEW
             12.3.19 EPLUS3D
                        TABLE 253 EPLUS3D: COMPANY OVERVIEW
 
13 APPENDIX (Page No. - 319)
     13.1 DISCUSSION GUIDE 
     13.2 KNOWLEDGESTORE: MARKETSANDMARKETS’ SUBSCRIPTION PORTAL 
     13.3 CUSTOMIZATION OPTIONS 
     13.4 RELATED REPORTS 
     13.5 AUTHOR DETAILS 


The study involved four major activities in estimating the size for 3D and 4D technology market. Exhaustive secondary research was done to collect information on the market, peer market, and parent market. The next step was to validate these findings, assumptions, and sizing with industry experts across value chains through primary research. The bottom-up approach was employed to estimate the overall market size. After that, market breakdown and data triangulation were used to estimate the market size of segments and subsegments.

Secondary Research

In the secondary research process, various sources were used to identify and collect information important for this study. These include annual reports, press releases & investor presentations of companies, white papers, technology journals, and certified publications, articles by recognized authors, directories, and databases.

Secondary research was mainly used to obtain key information about the supply chain of the industry, the total pool of market players, classification of the market according to industry trends to the bottom-most level, regional markets, and key developments from the market and technology-oriented perspectives.

Primary research was also conducted to identify the segmentation types, key players, competitive landscape, and key market dynamics such as drivers, restraints, opportunities, challenges, and industry trends, along with key strategies adopted by players operating in the 3D and 4D technology market size . Extensive qualitative and quantitative analyses were performed on the complete market engineering process to list key information and insights throughout the report.

Primary Research

Extensive primary research has been conducted after acquiring knowledge about the 3D and 4D technology market size scenario through secondary research. Several primary interviews have been conducted with experts from both demand (end users) and supply side (3D and 4D technology solution providers) across 4 major geographic regions: North America, Europe, Asia Pacific, and RoW. Approximately 80% and 20% of the primary interviews have been conducted from the supply and demand side, respectively. These primary data have been collected through questionnaires, emails, and telephonic interviews.
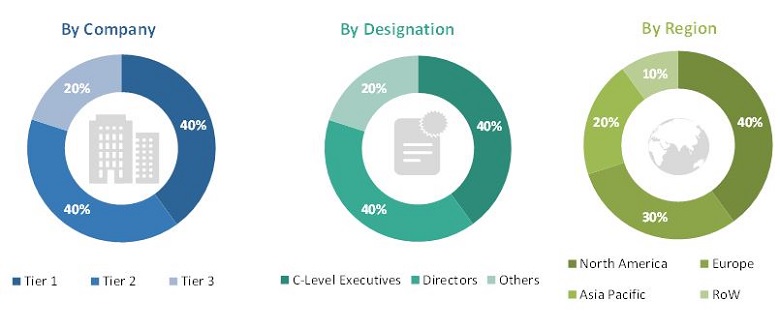
3D and 4D Technology Market
 Size, and Share

To know about the assumptions considered for the study, download the pdf brochure

3D and 4D Technology Market Size Estimation

In the complete market engineering process, both the top-down and bottom-up approaches were implemented, along with several data triangulation methods, to estimate and validate the size of the 3D and 4D technology market and various other dependent submarkets. Key players in the market were identified through secondary research, and their market share in the respective regions was determined through primary and secondary research. This entire research methodology included the study of annual and financial reports of the top players, as well as interviews with experts (such as CEOs, VPs, directors, and marketing executives) for key insights (quantitative and qualitative).

All percentage shares, splits, and breakdowns were determined using secondary sources and verified through primary sources. All the possible parameters that affect the markets covered in this research study were accounted for, viewed in detail, verified through primary research, and analyzed to obtain the final quantitative and qualitative data. This data was consolidated and supplemented with detailed inputs and analysis from MarketsandMarkets and presented in this report.

3D and 4D Technology Market: Bottom-Up Approach

3D and 4D Technology Market
 Size, and Bottom-Up Approach

3D and 4D Technology Market: Top-Down Approach

3D and 4D Technology Market
 Size, and Top-Down Approach

Data Triangulation

After arriving at the overall market size from the market size estimation process as explained above, the total market has been split into several segments and subsegments. To complete the overall market engineering process and arrive at the exact statistics for all segments and subsegments, market breakdown and data triangulation procedures have been employed, wherever applicable. The data has been triangulated by studying various factors and trends from both demand and supply sides. Along with this, the market has been validated using top-down and bottom-up approaches.

Definition

3D and 4D technology stands for three- and four-dimensional technology. 3D technology can be defined as the illusion of depth or a visual representation system that tries to create or reproduce a moving object in the third dimension. 3D technology provides users with a whole new level of experience, immersion, interaction, and realism; the technology has become a mainstream element in cinemas, televisions, the internet, video games, mobile phones, and other products.

4D technology combines the effects of 3D, along with the external physical effects with respect to time. 4D technology finds applications in 4D cinemas, games, and ultrasound systems. 4D printing is another upcoming application. 4D printing allows objects to be 3D-printed and then self-transform in shape and material property when exposed to a predetermined stimulus, such as submersion in water or exposure to heat, pressure, current, ultraviolet light, or some other sources of energy.

Key Stakeholders

  • Senior Management
  • End User
  • Finance/Procurement Department
  • R&D Department

Report Objectives

  • To describe, segment, and forecast the overall size of the 3D and 4D technology market , by solution type, end-use application, vertical, and region, in terms of value
  • To describe and forecast the global 3D and 4D technology market, by 3D and 4D input devices, in terms of volume
  • To describe and forecast the market size for various segments with regard to four main regions, namely, North America, Europe, Asia Pacific, and Rest of the World (RoW), in terms of value
  • To provide detailed information regarding major drivers, restraints, opportunities, and challenges influencing the market growth
  • To analyze the supply chain, trends/disruptions impacting customer business, market/ecosystem map, pricing, and regulatory landscape pertaining to the 3D and 4D technology market size 
  • To analyze opportunities in the market for stakeholders by identifying the high-growth segments of the market
  • To describe the value chain of 3D and 4D technology solutions in brief
  • To strategically analyze micromarkets1 with respect to individual growth trends, prospects, and contributions to the overall market
  • To profile key players and comprehensively analyze their market position in terms of their ranking and core competencies2, along with the detailed competitive landscape of the
  • market
  • To analyze competitive developments, such as product launches and developments, partnerships, agreements, expansions, acquisitions, contracts, alliances, and research & development (R&D), undertaken in the 3D and 4D technology market size 
  • To benchmark market players using the proprietary ‘Company Evaluation Matrix,’ which analyzes market players on various parameters within the broad categories of business strategy excellence and strength of product portfolio
  • To analyze the probable impact of the recession on the market

Available Customizations

With the given market data, MarketsandMarkets offers customizations according to the company’s specific needs. The following customization options are available for the report:

Product Analysis

  • Product matrix that gives a detailed comparison of the product portfolio of each company

Company Information

  • Detailed analysis and profiling of additional market players (up to 7)
Custom Market Research Services

We will customize the research for you, in case the report listed above does not meet with your exact requirements. Our custom research will comprehensively cover the business information you require to help you arrive at strategic and profitable business decisions.

Request Customization
Report Code
SE 2497
Published ON
Feb, 2024
Choose License Type
BUY NOW
  • SHARE
X
Request Customization
Speak to Analyst
Speak to Analyst
OR FACE-TO-FACE MEETING
PERSONALIZE THIS RESEARCH
  • Triangulate with your Own Data
  • Get Data as per your Format and Definition
  • Gain a Deeper Dive on a Specific Application, Geography, Customer or Competitor
  • Any level of Personalization
REQUEST A FREE CUSTOMIZATION
LET US HELP YOU!
  • What are the Known and Unknown Adjacencies Impacting the 3D and 4D Technology Market
  • What will your New Revenue Sources be?
  • Who will be your Top Customer; what will make them switch?
  • Defend your Market Share or Win Competitors
  • Get a Scorecard for Target Partners
CUSTOMIZED WORKSHOP REQUEST
knowledgestore logo

Hold On!

Want to explore hidden markets that can drive new revenue in 3D and 4D Technology Market?

Find Hidden Markets
  • Call Us
  • +1-888-600-6441 (Corporate office hours)
  • +1-888-600-6441 (US/Can toll free)
  • +44-800-368-9399 (UK office hours)
CONNECT WITH US
ABOUT TRUST ONLINE
©2024 MarketsandMarkets Research Private Ltd. All rights reserved
DMCA.com Protection Status
Website Feedback