Electric Vehicles Battery Recycling Market

Electric Vehicles Battery Recycling Market by Source (Passenger Vehicles, Commercial Vehicles, E-Bikes), Chemistry (Li-NMC, LFP, LMO, LTO, NCA), Process (Hydrometallurgical, Pyrometallurgy, Physical/ Mechanical), and Region - Global Forecast to 2031

Report Code: CH 8945 Feb, 2024, by marketsandmarkets.com

Updated on : April 01, 2024

Electric Vehicles Battery Recycling Market

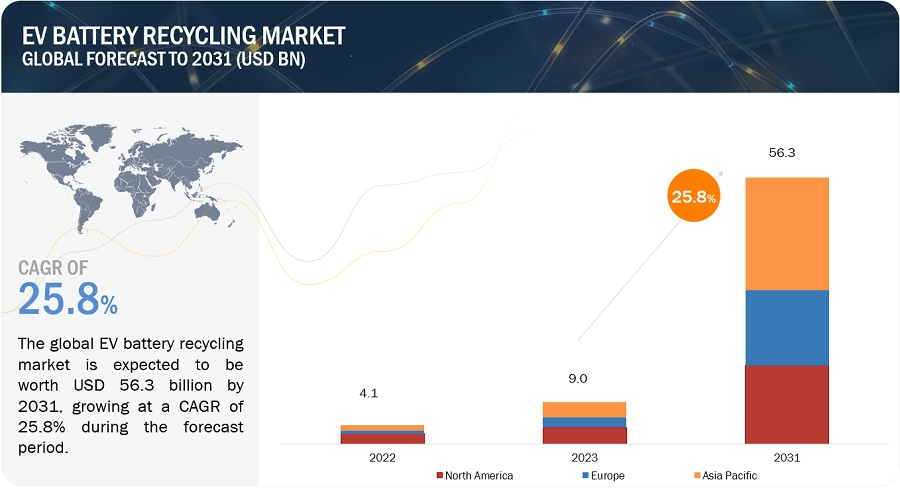
The electric vehicles battery recycling market was valued at USD 9.0 billion in 2023 and is projected to reach USD 56.3 billion by 2031, growing at 25.8% cagr from 2023 to 2031. Use of EV vehicles in Automotive sectors and advancement in lithium-ion battery are driving the growth in EV Battery Recycling market. The recycling of EV batteries is crucial to reduce waste, save valuable resources, and protect the environment. Automotive manufacturers are collaborating with recycling companies to recycle EV Batteries.

Attractive Opportunities in the EV Battery Recycling Market
Electric Vehicles Battery Recycling Market

To know about the assumptions considered for the study, Request for Free Sample Report
Electric Vehicles Battery Recycling Market

EV Battery Recycling Market Dynamics

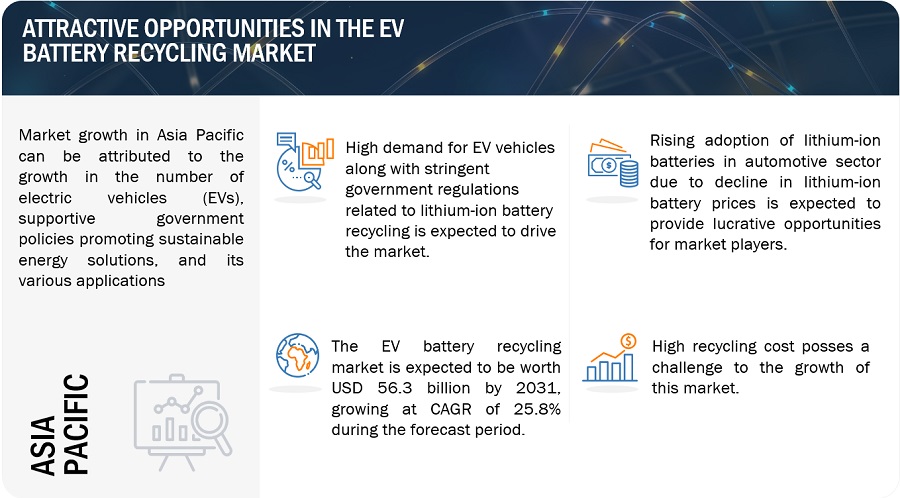
Driver: Increase in demand for recycled products and materials

The increasing interest in utilizing recycled materials and batteries is anticipated to promote research and development in the recycling of both batteries and materials. The upward path in material costs, coupled with a growing demand for eco-friendly or recycled products, is projected to create various sectors  for growth within the battery recycling market. The mounting interest in recycled products and materials serves as a significant change, expected to have a substantial impact on the electric vehicle battery recycling market. This heightened demand is driven by a worldwide movement toward sustainable practices, a heightened environmental consciousness, and a growing awareness of the limited availability of natural resources.

Restraints: Safety issues related to storage and transportation of spent batteries

Spent batteries has hazardous chemicals, including acids and heavy metals such as mercury. In July 2007, a fire sparked by a lithium-based battery led to the ignition of over 132,000 liters of chemicals, resulting in the closure of two major highways in the UK. These batteries retain some charge after use, posing a risk of unexpected discharges that can harm people or property. It's crucial to handle all batteries cautiously, assuming they still have a charge unless properly labeled, and store them carefully, especially small batteries that could be swallowed by children. Larger lithium-based batteries, commonly found in cars, may be incorrectly identified as lead-acid batteries if not labeled accurately by local manufacturers. To prevent hazards, these batteries must be separated from used lead-acid batteries before storage. Concerns about the potential dangers associated with used batteries have led to regulations by state or national governments governing their storage and transportation.

Opportunity: Rising adoption of lithium-ion batteries due to decline in prices

Expensive lithium-ion batteries have held back market growth since the 1990s. These batteries have various parts, and some are subsidized. The main part, called the cell, makes up about half the cost, with the rest going to electronics, assembly, and packaging. Recent promises from battery and car companies suggest a significant price drop. A Bloomberg NEF survey shows the average battery pack cost went down to USD 137 per kWh in 2020, dropping 88% since 2010. Predictions say prices might go as low as USD 58 per kWh by 2030 and USD 44 per kWh by 2035. Tesla's Gigafactory-1 is one effort to increase battery production and lower prices. With advancements like large-scale manufacturing and better technology, lithium-ion battery prices are expected to decrease. This decline is likely to boost the renewable energy and grid storage markets, favoring lithium-ion batteries and increasing their market share. As a result, there could be a growing demand for recycling used automotive lithium-based batteries.

Challenge: High recycling cost and dearth of technologies

The Centre for Energy Economics (CEE) reports that globally, only 1-3% of lithium is recovered from all applications. Companies like Toxco (US) and Umicore (Belgium) are working on technologies to extract lithium from batteries. However, challenges for the industry include the high recycling costs, lack of proper storage for used batteries, and a shortage of recycling technologies. Recycling lithium-ion batteries is costly, and traditional methods can be energy-intensive. This makes recycling economically challenging compared to extracting materials from raw sources. Additionally, the diverse chemistries of lithium-ion batteries, varying among manufacturers, make it difficult to develop universal and cost-effective recycling processes. The need for customized recycling solutions adds complication and cost to the process, negatively impacting the market for electric vehicle battery recycling.

EV Battery Recycling Market Ecosystem

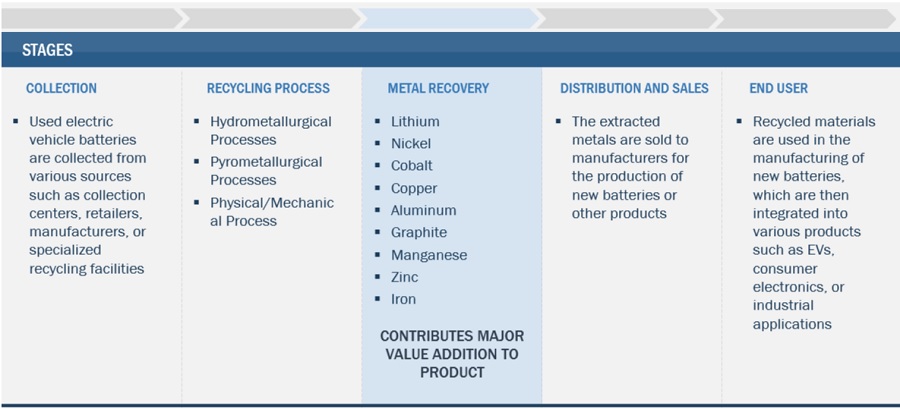
Prominent companies in this market include well-established, and financially stable manufacturers of EV battery recycling market. These companies have been operating in the market for several years and possess a diversified product portfolio and strong global sales and marketing networks. Prominent companies in this market include).
Electric Vehicles Battery Recycling Market Ecosystem

"Lithium Iron Phosphate, by battery chemistry, is estimated to account for the highest CAGR during the forecast period."

The rising popularity of lithium iron phosphate (LFP) electric vehicle (EV) batteries can be attributed to several compelling factors. LFP batteries excel in safety, boasting a reduced risk of overheating and fire as compared to other lithium-ion batteries. LFP batteries are environmentally sustainable, being non-toxic and recyclable, making them an eco-friendly choice. With a wide operating temperature range, they prove versatile for various applications, including those facing extreme temperatures. Cost-effectiveness is another advantage, as iron and phosphorus, the key components, are readily available and affordable globally.

"E-Bikes, by source , is estimated to account for the highest CAGR during the forecast period."

E-Bikes by source contributes to have highest CAGR during the forecast period as electric vehicle (EV) batteries in e-bikes is driven by several key advantages. EV batteries, particularly lithium-ion and lithium-iron-phosphate (LFP) types, offer higher energy density, ensuring longer range and improved e-bike performance. Safety is enhanced, with lithium-ion batteries being less susceptible to thermal runaway and oxygen release in case of fire compared to lead-acid batteries

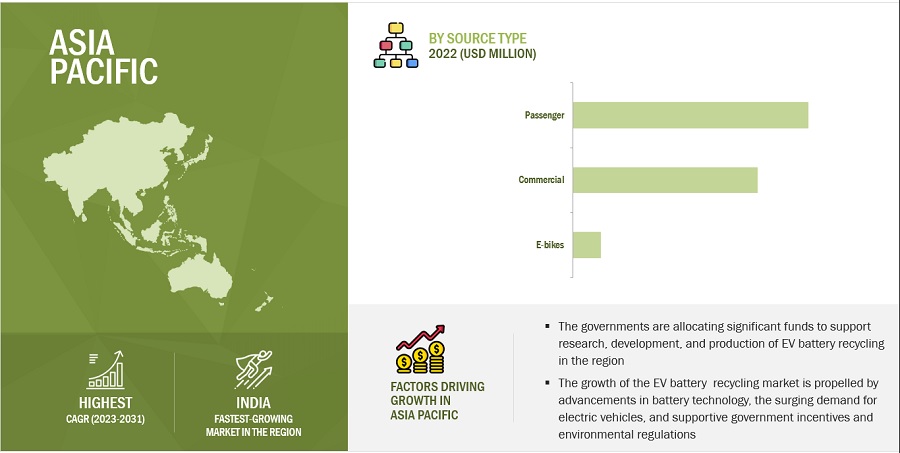
"Asia Pacific is estimated to account for the highest CAGR during the forecast period."

The demand for EV batteries in Asia Pacific is significant, driven by the increasing adoption of EVs in emerging economies. Growing investments by leading automotive OEMs to set up battery manufacturing and recycling facilities in the region, and rising government initiatives to support EV battery manufacturing, and EV battery recycling are some of the factors driving the growth of the EV battery recycling market in the Asia-Pacific region.
Electric Vehicles Battery Recycling Market by Region

Source: Secondary Research, Expert Interviews, and MarketsandMarkets Analysis

To know about the assumptions considered for the study, download the pdf brochure

EV Battery Recycling Market Players

Major companies in the EV Battery Recycling Market include Contemporary Amperex Technology Co., Limited. (China), Glencore (Switzerland), GEM Co., Ltd. (China), ERAMET (France), Li-Cycle Corp (Canada), Umicore (Belgium) among others. A total of 23 major players have been covered. These players have adopted product launches, agreements, joint ventures, investments, acquisitions, mergers, and expansions as the major strategies to consolidate their position in the market.

Read More: Electric Vehicles Battery Recycling Companies

EV Battery Recycling Market Report Scope

Report Metric

Details

Market Size Value in 2022

USD 4.1 Billion

Revenue Forecast in 2031

USD 56.3 Billion

CAGR

25.8%

Market Size Available for Years

2017–2031

Base Year Considered

2022

Forecast Period

2023–2031

Forecast Units

Value (USD Billion/Million) and Volume (Units)

Segments Covered

Battery Chemistry , Sources,Process and Region.

Geographies Covered

Asia Pacific, Europe, and North America

Companies Covered

The major market players include Contemporary Amperex Technology Co., Limited. (China), Glencore (Switzerland), GEM Co., Ltd. (China), ERAMET (France), Li-Cycle Corp (Canada), Umicore (Belgium) ,Accurec-Recycling GMBH (Germany), Fortum (Finland) ,Cirba solutions (US) ,Neometals Ltd.(Australia),Redwood Materials Inc. (US),Ecobat (US),Stena Recycling (Sweden) ,TES (Singapore),Ace Green Recycling, Inc. (USA), ,Shenzhen Highpower Technology Co., Ltd (China)  and others.

This research report categorizes the EV battery recycling market market based on Battery Chemistry , Sources,Process and Region.

Based on battery chemistry Type, the EV battery recycling market market has been segmented as follows:
  • Lithium nickel manganese cobalt
  • Lithium iron phosphate
  • Lithium titanate oxide
  • Lithium manganese oxide
  • Lithium nickel cobalt aluminum oxide
Based on Process, the EV battery recycling market market has been segmented as follows:
  • Hydrometallurgical process
  • Pyrometallurgy process
  • Physical/mechanical process
Based on Sources, the EV battery recycling market market has been segmented as follows:
  • Commercial
  • Passenger
  • E-bikes
Based on region, the EV battery recycling market market has been segmented as follows:
  • Asia Pacific
  • Europe
  • North America

Recent Developments

  • In Sep-2022 Umicore and PowerCo had announced the founding of a joint venture for precursor and cathode material production in Europe. From 2025 onwards, the joint venture will supply PowerCo's European battery cell factories with key materials. It also aims to include elements of refining and battery recycling based on Umicore's technology.
  • In March 2022, Neometals and Mercedes-Benz confirmed their plans for a battery recycling joint venture. Through the JV, the companies intend to build a 2,500-ton-per-year lithium-ion battery recycling plant in Germany.
  • In November 2022, Li-Cycle Corp. has announced a strategic partnership with Vines Energy Solutions, a battery & cell pack manufacturer and a member company of Vingroup. Through this partnership, Li-Cycle provided its recycling solutions to Vines Energy Solutions

Frequently Asked Questions (FAQ):

To speak to our analyst for a discussion on the above findings, click Speak to Analyst

Exclusive indicates content/data unique to MarketsandMarkets and not available with any competitors.

TABLE OF CONTENTS
 
1 INTRODUCTION (Page No. - 22)
    1.1 STUDY OBJECTIVES 
    1.2 MARKET DEFINITION 
           1.2.1 INCLUSIONS AND EXCLUSIONS
                    TABLE 1 ELECTRIC VEHICLE BATTERY RECYCLING MARKET: INCLUSIONS AND EXCLUSIONS
    1.3 MARKET SCOPE 
          FIGURE 1 ELECTRIC VEHICLE BATTERY RECYCLING MARKET SEGMENTATION
           1.3.1 REGIONAL SCOPE
           1.3.2 YEARS CONSIDERED
    1.4 CURRENCY CONSIDERED 
    1.5 UNITS CONSIDERED 
    1.6 LIMITATIONS 
    1.7 STAKEHOLDERS 
 
2 RESEARCH METHODOLOGY (Page No. - 26)
    2.1 RESEARCH DATA 
          FIGURE 2 ELECTRIC VEHICLE BATTERY RECYCLING MARKET: RESEARCH DESIGN
           2.1.1 SECONDARY DATA
                    2.1.1.1 Key data from secondary sources
           2.1.2 PRIMARY DATA
                    2.1.2.1 Key data from primary sources
                    2.1.2.2 Key industry insights
                    2.1.2.3 Participating companies for primary research
                    2.1.2.4 Breakdown of primary interviews
    2.2 MATRIX CONSIDERED FOR DEMAND SIDE 
          FIGURE 3 MAIN MATRIX CONSIDERED FOR ASSESSING DEMAND FOR ELECTRIC VEHICLE BATTERY RECYCLING
    2.3 MARKET SIZE ESTIMATION (1/2) 
           2.3.1 BOTTOM-UP APPROACH
                    FIGURE 4 MARKET SIZE ESTIMATION: BOTTOM-UP APPROACH
           2.3.2 TOP-DOWN APPROACH
                    FIGURE 5 MARKET SIZE ESTIMATION: TOP-DOWN APPROACH
    2.4 MARKET SIZE ESTIMATION (2/2) 
          FIGURE 6 METHODOLOGY FOR SIZING OF ELECTRIC VEHICLE BATTERY RECYCLING MARKET: DEMAND-SIDE APPROACH
           2.4.1 CALCULATION BASED ON DEMAND-SIDE ANALYSIS
    2.5 METHODOLOGY FOR SUPPLY-SIDE SIZING OF ELECTRIC VEHICLE BATTERY RECYCLING MARKET (1/2) 
    2.6 METHODOLOGY FOR SUPPLY-SIDE SIZING OF ELECTRIC VEHICLE BATTERY RECYCLING MARKET (2/2) 
           2.6.1 CALCULATIONS BASED ON SUPPLY-SIDE ANALYSIS
           2.6.2 FORECAST
           2.6.3 GROWTH RATE ASSUMPTIONS/GROWTH FORECAST
    2.7 MARKET BREAKDOWN AND DATA TRIANGULATION 
          FIGURE 7 ELECTRIC VEHICLE BATTERY RECYCLING MARKET: DATA TRIANGULATION
    2.8 IMPACT OF RECESSION 
    2.9 RESEARCH ASSUMPTIONS 
           2.9.1 RESEARCH LIMITATIONS
           2.9.2 RISK ANALYSIS
 
3 EXECUTIVE SUMMARY (Page No. - 36)
    TABLE 2 ELECTRIC VEHICLE BATTERY RECYCLING MARKET SNAPSHOT: 2022 VS. 2031
    FIGURE 8 ASIA PACIFIC TO ACCOUNT FOR LARGEST MARKET SHARE DURING FORECAST PERIOD
    FIGURE 9 PASSENGER SEGMENT TO ACCOUNT FOR LARGEST MARKET SHARE DURING FORECAST PERIOD
    FIGURE 10 NORTH AMERICA TO HOLD LARGEST MARKET SHARE DURING FORECAST PERIOD
 
4 PREMIUM INSIGHTS (Page No. - 39)
    4.1 ATTRACTIVE OPPORTUNITIES IN ELECTRIC VEHICLE BATTERY RECYCLING MARKET 
          FIGURE 11 GROWING ADOPTION OF LITHIUM-ION BATTERIES IN ELECTRIC VEHICLES TO DRIVE MARKET
    4.2 ELECTRIC VEHICLE BATTERY RECYCLING MARKET, BY REGION 
          FIGURE 12 EUROPE TO REGISTER HIGHEST CAGR DURING FORECAST PERIOD
    4.3 ELECTRIC VEHICLE BATTERY RECYCLING MARKET, BY BATTERY CHEMISTRY 
          FIGURE 13 LFP SEGMENT TO REGISTER HIGHEST CAGR DURING FORECAST PERIOD
 
5 MARKET OVERVIEW (Page No. - 41)
    5.1 MARKET DYNAMICS 
          FIGURE 14 DRIVERS, RESTRAINTS, OPPORTUNITIES, AND CHALLENGES IN ELECTRIC VEHICLE BATTERY RECYCLING MARKET
           5.1.1 DRIVERS
                    5.1.1.1 High demand for electric vehicles
                    5.1.1.2 Stringent government regulations related to lithium-ion battery recycling
                    5.1.1.3 Increase in demand for recycled products and materials
                                TABLE 3 COMPANIES INVOLVED IN LITHIUM-ION BATTERY RECYCLING AND VOLUME PROCESSED
                    5.1.1.4 Scarcity related to availability of earth metals
           5.1.2 RESTRAINTS
                    5.1.2.1 Safety issues related to storage and transportation of spent batteries
           5.1.3 OPPORTUNITIES
                    5.1.3.1 Rising adoption of lithium-ion batteries due to decline in prices
                                FIGURE 15 LITHIUM-ION BATTERY PACK PRICE, 2018–2023
           5.1.4 CHALLENGES
                    5.1.4.1 High recycling costs and dearth of technologies
    5.2 PORTER'S FIVE FORCES ANALYSIS 
          FIGURE 16 ELECTRIC VEHICLE BATTERY RECYCLING MARKET: PORTER'S FIVE FORCES ANALYSIS
          TABLE 4 ELECTRIC VEHICLE BATTERY RECYCLING MARKET: PORTER'S FIVE FORCES ANALYSIS
           5.2.1 BARGAINING POWER OF SUPPLIERS
           5.2.2 THREAT OF NEW ENTRANTS
           5.2.3 THREAT OF SUBSTITUTES
           5.2.4 BARGAINING POWER OF BUYERS
           5.2.5 INTENSITY OF COMPETITIVE RIVALRY
    5.3 VALUE CHAIN ANALYSIS 
          FIGURE 17 VALUE CHAIN ANALYSIS OF ELECTRIC VEHICLE BATTERY RECYCLING MARKET
    5.4 ECOSYSTEM/MARKET MAP 
          FIGURE 18 ECOSYSTEM MAP OF ELECTRIC VEHICLE BATTERY RECYCLING MARKET
          TABLE 5 ECOSYSTEM OF ELECTRIC VEHICLE BATTERY RECYCLING MARKET
    5.5 TECHNOLOGY ANALYSIS 
           5.5.1 INTRODUCTION
           5.5.2 TECHNOLOGY
                    5.5.2.1 Pyrometallurgy
                    5.5.2.2 Hydrometallurgy
                    5.5.2.3 Pyrolysis
                    5.5.2.4 Mechanical thermodynamic recycling
                    5.5.2.5 Comparative analysis
    5.6 TARIFF AND REGULATORY LANDSCAPE 
           5.6.1 TARIFF RELATED TO ELECTRIC VEHICLE BATTERY RECYCLING
                    TABLE 6 REGULATIONS AND STANDARDS FOR BATTERIES
           5.6.2 REGULATORY BODIES, GOVERNMENT AGENCIES, AND OTHER ORGANIZATIONS
                    5.6.2.1 North America battery recycling regulations
                    5.6.2.2 Europe battery recycling regulations
                    5.6.2.3 Asia Pacific battery recycling regulations
    5.7 CASE STUDY ANALYSIS 
           5.7.1 ATTERO RECYCLING
                    5.7.1.1 Key highlights:
    5.8 KEY CONFERENCES AND EVENTS (2024) 
          TABLE 7 ELECTRIC VEHICLE BATTERY RECYCLING MARKET: KEY CONFERENCES AND EVENTS (2023-2024)
    5.9 TRADE DATA 
           5.9.1 IMPORT DATA
                    TABLE 8 IMPORT DATA ON LITHIUM-ION BATTERIES
           5.9.2 EXPORT DATA
                    TABLE 9 EXPORT DATA ON LITHIUM-ION BATTERIES
    5.10 TRENDS/DISRUPTIONS IMPACTING CUSTOMER BUSINESS 
          FIGURE 19 TRENDS/DISRUPTIONS IMPACTING LITHIUM-ION BATTERY ECOSYSTEM
    5.11 PRICING ANALYSIS 
           5.11.1 AVERAGE SELLING PRICE, BY REGION
                     FIGURE 20 AVERAGE SELLING PRICE OF LITHIUM-ION BATTERY, BY REGION
           5.11.2 AVERAGE SELLING PRICE OF LITHIUM-ION BATTERY, BY CHEMISTRY
                     FIGURE 21 AVERAGE SELLING PRICE OF LITHIUM-ION BATTERY, BY CHEMISTRY
    5.12 KEY STAKEHOLDERS AND BUYING CRITERIA 
           5.12.1 KEY STAKEHOLDERS IN BUYING PROCESS
                     FIGURE 22 INFLUENCE OF STAKEHOLDERS ON BUYING PROCESS FOR MAJOR PRODUCT TYPES
                     TABLE 10 INFLUENCE OF STAKEHOLDERS ON BUYING PROCESS FOR MAJOR PRODUCT TYPES (%)
           5.12.2 BUYING CRITERIA
                     FIGURE 23 KEY BUYING CRITERIA FOR TOP THREE SOURCES
                     TABLE 11 KEY BUYING CRITERIA FOR TOP THREE SOURCES
 
6 ELECTRIC VEHICLES BATTERY RECYCLING MARKET, BY SOURCE (Page No. - 64)
    6.1 INTRODUCTION 
          FIGURE 24 PASSENGER SEGMENT TO LEAD ELECTRIC VEHICLE BATTERY RECYCLING MARKET
          TABLE 12 ELECTRIC VEHICLES BATTERY RECYCLING MARKET, BY SOURCE, 2017–2020 (USD MILLION)
          TABLE 13 ELECTRIC VEHICLE BATTERY RECYCLING MARKET, BY SOURCE, 2021–2031 (USD MILLION)
    6.2 COMMERCIAL 
           6.2.1 WIDESPREAD USE OF LITHIUM-ION BATTERIES TO DRIVE DEMAND
    6.3 PASSENGER 
           6.3.1 RAPID ADOPTION OF PASSENGER ELECTRIC VEHICLES TO DRIVE DEMAND
    6.4 E-BIKES 
           6.4.1 GOVERNMENT INITIATIVES TO ENCOURAGE RECYCLING OF LITHIUM-ION BATTERIES TO DRIVE DEMAND
 
7 ELECTRIC VEHICLE BATTERY RECYCLING MARKET, BY BATTERY CHEMISTRY (Page No. - 67)
    7.1 INTRODUCTION 
          FIGURE 25 TYPES OF LITHIUM-ION BATTERIES BASED ON MATERIALS USED
          FIGURE 26 LI-NMC SEGMENT TO LEAD ELECTRIC VEHICLE BATTERY RECYCLING MARKET
          TABLE 14 ELECTRIC VEHICLES BATTERY RECYCLING MARKET, BY BATTERY CHEMISTRY, 2017–2020 (UNITS)
          TABLE 15 ELECTRIC VEHICLE BATTERY RECYCLING MARKET, BY BATTERY CHEMISTRY, 2021–2031 (UNITS)
    7.2 LITHIUM-NICKEL MANGANESE COBALT (LI-NMC) 
           7.2.1 LITHIUM-NICKEL MANGANESE COBALT (LI-NMC) SEGMENT TO ACCOUNT FOR LARGEST MARKET SHARE
                     FIGURE 27 LI-NMC BATTERIES OFFER HIGH-ENERGY DENSITY
                     TABLE 16 LI-NMC: ELECTRIC VEHICLE BATTERY RECYCLING MARKET, BY REGION, 2017–2020 (UNITS)
                     TABLE 17 LI-NMC: ELECTRIC VEHICLES BATTERY RECYCLING MARKET, BY REGION, 2021–2031 (UNITS)
    7.3 LITHIUM-IRON PHOSPHATE (LFP) 
           7.3.1 LONG LIFE CYCLE, HIGH CURRENT RATING, AND HIGH THERMAL STABILITY TO DRIVE MARKET
                     FIGURE 28 HIGH POWER DENSITY AND STABILITY TO BOOST ADOPTION OF LFP BATTERIES
                     TABLE 18 LFP: ELECTRIC VEHICLE BATTERY RECYCLING MARKET, BY REGION, 2017–2020 (UNITS)
                     TABLE 19 LFP: ELECTRIC VEHICLES BATTERY RECYCLING MARKET, BY REGION, 2021–2031 (UNITS)
    7.4 LITHIUM-MANGANESE OXIDE (LMO) 
           7.4.1 LOWER INTERNAL RESISTANCE, HIGH THERMAL STABILITY, AND IMPROVED HANDLING OF CURRENT TO DRIVE DEMAND
                     FIGURE 29 DEMAND FOR LMO BATTERIES DRIVEN BY LOW COST
                     TABLE 20 LMO: ELECTRIC VEHICLE BATTERY RECYCLING MARKET, BY REGION, 2017–2020 (UNITS)
                     TABLE 21 LMO: ELECTRIC VEHICLES BATTERY RECYCLING MARKET, BY REGION, 2021–2031 (UNITS)
    7.5 LITHIUM-TITANATE OXIDE (LTO) 
           7.5.1 INCREASED USE OF LTO BATTERIES IN ELECTRIC POWER TRAINS TO DRIVE MARKET
                     FIGURE 30 HIGH STABILITY, ENERGY, AND POWER DENSITY TO CREATE DEMAND FOR LTO BATTERIES
                     TABLE 22 LTO: ELECTRIC VEHICLE BATTERY RECYCLING MARKET, BY REGION, 2017–2020 (UNITS)
                     TABLE 23 LTO: ELECTRIC VEHICLES BATTERY RECYCLING MARKET, BY REGION, 2021–2031 (UNITS)
    7.6 LITHIUM-NICKEL COBALT ALUMINUM OXIDE (NCA) 
           7.6.1 HIGHER CAPACITY AND HIGH ENERGY DENSITY OF NCA BATTERIES TO DRIVE HIGH DEMAND IN AUTOMOTIVE INDUSTRY
                     FIGURE 31 HIGH ENERGY DENSITY OF NCA BATTERIES FUELING DEMAND
                     TABLE 24 NCA: ELECTRIC VEHICLE BATTERY RECYCLING MARKET, BY REGION, 2017–2020 (UNITS)
                     TABLE 25 NCA: ELECTRIC VEHICLES BATTERY RECYCLING MARKET, BY REGION, 2021–2031 (UNITS)
 
8 ELECTRIC VEHICLE BATTERY RECYCLING MARKET, BY RECYCLING PROCESS (Page No. - 78)
    8.1 INTRODUCTION 
          FIGURE 32 RECYCLING PROCESS OF LITHIUM-ION BATTERIES
          TABLE 26 COMPARISON OF PROCESSES INVOLVED IN RECYCLING LI-ION BATTERIES
    8.2 HYDROMETALLURGICAL PROCESS 
          TABLE 27 ADVANTAGES AND DISADVANTAGES OF HYDROMETALLURGICAL PROCESS
    8.3 PYROMETALLURGY PROCESS 
          TABLE 28 ADVANTAGES AND DISADVANTAGES OF PYROMETALLURGICAL PROCESS
    8.4 PHYSICAL/MECHANICAL PROCESS 
          TABLE 29 ADVANTAGES AND DISADVANTAGES OF PHYSICAL/MECHANICAL PROCESS
    8.5 MATERIALS PRESENT IN BATTERIES FOR RECYCLING 
          TABLE 30 AVERAGE COMPOSITION OF VARIOUS COMPONENTS OF LITHIUM-ION BATTERIES, BY MATERIAL
          TABLE 31 METAL CONTENT OF RECYCLED BATTERIES
          TABLE 32 MAJOR RECOVERABLE METALS FROM VARIOUS BATTERY CHEMISTRIES AFTER RECYCLING
 
9 ELECTRIC VEHICLE BATTERY RECYCLING MARKET, BY REGION (Page No. - 83)
    9.1 INTRODUCTION 
          FIGURE 33 ASIA PACIFIC TO ACCOUNT FOR LARGEST MARKET SHARE DURING FORECAST PERIOD
          TABLE 33 ELECTRIC VEHICLE BATTERY RECYCLING MARKET, BY REGION, 2017–2020 (UNITS)
          TABLE 34 ELECTRIC VEHICLES BATTERY RECYCLING MARKET, BY REGION, 2021–2031 (UNITS)
          TABLE 35 ELECTRIC VEHICLE BATTERY RECYCLING MARKET, BY REGION, 2017–2020 (USD MILLION)
          TABLE 36 ELECTRIC VEHICLES BATTERY RECYCLING MARKET, BY REGION, 2021–2031 (USD MILLION)
    9.2 ASIA PACIFIC 
          FIGURE 34 ASIA PACIFIC: ELECTRIC VEHICLE BATTERY RECYCLING MARKET SNAPSHOT
           9.2.1 IMPACT OF RECESSION
                    TABLE 37 ASIA PACIFIC: ELECTRIC VEHICLE BATTERY RECYCLING MARKET, BY COUNTRY, 2017–2020 (USD MILLION)
                    TABLE 38 ASIA PACIFIC: ELECTRIC VEHICLES BATTERY RECYCLING MARKET, BY COUNTRY, 2021–2031 (USD MILLION)
                    TABLE 39 ASIA PACIFIC: EV BATTERY RECYCLING MARKET, BY COUNTRY, 2017–2020 (UNITS)
                    TABLE 40 ASIA PACIFIC: EV BATTERY RECYCLING MARKET, BY COUNTRY, 2021–2031 (UNITS)
                    TABLE 41 ASIA PACIFIC: EV BATTERY RECYCLING MARKET, BY SOURCE, 2017–2020 (USD MILLION)
                    TABLE 42 ASIA PACIFIC: EV BATTERY RECYCLING MARKET, BY SOURCE, 2021–2031 (USD MILLION)
                    TABLE 43 ASIA PACIFIC: EV BATTERY RECYCLING MARKET, BY BATTERY CHEMISTRY, 2017–2020 (UNITS)
                    TABLE 44 ASIA PACIFIC: EV BATTERY RECYCLING MARKET, BY BATTERY CHEMISTRY, 2021–2031 (UNITS)
           9.2.2 CHINA
                    9.2.2.1 Growing sale of electric vehicles to drive market for electric vehicle battery recycling
                                TABLE 45 CHINA: ELECTRIC VEHICLE BATTERY RECYCLING MARKET, BY SOURCE, 2017–2020 (USD MILLION)
                                TABLE 46 CHINA: EV BATTERY RECYCLING MARKET, BY SOURCE, 2021–2031 (USD MILLION)
           9.2.3 JAPAN
                    9.2.3.1 Government initiatives related to battery recycling to boost market growth
                                TABLE 47 JAPAN: ELECTRIC VEHICLE BATTERY RECYCLING MARKET, BY SOURCE, 2017–2020 (USD MILLION)
                                TABLE 48 JAPAN: ELECTRIC VEHICLES BATTERY RECYCLING MARKET, BY SOURCE, 2021–2031 (USD MILLION)
           9.2.4 SOUTH KOREA
                    9.2.4.1 Substantial growth in automotive sector to positively impact growth
                                TABLE 49 SOUTH KOREA: ELECTRIC VEHICLE BATTERY RECYCLING MARKET, BY SOURCE, 2017–2020 (USD MILLION)
                                TABLE 50 SOUTH KOREA: EV BATTERY RECYCLING MARKET, BY SOURCE, 2021–2031 (USD MILLION)
           9.2.5 INDIA
                    9.2.5.1 Government initiatives toward cleaner energy to drive market
                                TABLE 51 INDIA: ELECTRIC VEHICLE BATTERY RECYCLING MARKET, BY SOURCE, 2017–2020 (USD MILLION)
                                TABLE 52 INDIA: ELECTRIC VEHICLES BATTERY RECYCLING MARKET, BY SOURCE, 2021–2031 (USD MILLION)
           9.2.6 AUSTRALIA
                    9.2.6.1 Supportive government policies to enhance electric battery recycling
                                TABLE 53 AUSTRALIA: ELECTRIC VEHICLE BATTERY RECYCLING MARKET, BY SOURCE, 2017–2020 (USD MILLION)
                                TABLE 54 AUSTRALIA: EV BATTERY RECYCLING MARKET, BY SOURCE, 2021–2031 (USD MILLION)
           9.2.7 NEW ZEALAND
                    9.2.7.1 Government initiatives to incentivize EV adoption to support recycling of lithium batteries
                                TABLE 55 NEW ZEALAND: ELECTRIC VEHICLE BATTERY RECYCLING MARKET, BY SOURCE, 2017–2020 (USD MILLION)
                                TABLE 56 NEW ZEALAND: EV BATTERY RECYCLING MARKET, BY SOURCE, 2021–2031 (USD MILLION)
           9.2.8 THAILAND
                    9.2.8.1 Rapid growth in electrification of vehicles to drive market
                                TABLE 57 THAILAND: ELECTRIC VEHICLE BATTERY RECYCLING MARKET, BY SOURCE, 2017–2020 (USD MILLION)
                                TABLE 58 THAILAND: EV BATTERY RECYCLING MARKET, BY SOURCE, 2021–2031 (USD MILLION)
           9.2.9 SINGAPORE
                    9.2.9.1 Continuous advancements in battery technologies and recycling methods to drive market
                                TABLE 59 SINGAPORE: ELECTRIC VEHICLE BATTERY RECYCLING MARKET, BY SOURCE, 2017–2020 (USD MILLION)
                                TABLE 60 SINGAPORE: EV BATTERY RECYCLING MARKET, BY SOURCE, 2021–2031 (USD MILLION)
           9.2.10 REST OF ASIA PACIFIC
                     TABLE 61 REST OF ASIA PACIFIC: ELECTRIC VEHICLE BATTERY RECYCLING MARKET, BY SOURCE, 2017–2020 (USD MILLION)
                     TABLE 62 REST OF ASIA PACIFIC: EV BATTERY RECYCLING MARKET, BY SOURCE, 2021–2031 (USD MILLION)
    9.3 NORTH AMERICA 
           FIGURE 35 NORTH AMERICA: ELECTRIC VEHICLE BATTERY RECYCLING MARKET SNAPSHOT
           9.3.1 IMPACT OF RECESSION
                     TABLE 63 NORTH AMERICA: ELECTRIC VEHICLE BATTERY RECYCLING MARKET, BY COUNTRY, 2017–2020 (USD MILLION)
                     TABLE 64 NORTH AMERICA: ELECTRIC VEHICLES BATTERY RECYCLING MARKET, BY COUNTRY, 2021–2031 (USD MILLION)
                     TABLE 65 NORTH AMERICA: EV BATTERY RECYCLING MARKET, BY COUNTRY, 2017–2020 (UNITS)
                     TABLE 66 NORTH AMERICA: EV BATTERY RECYCLING MARKET, BY COUNTRY, 2021–2031 (UNITS)
                     TABLE 67 NORTH AMERICA: EV BATTERY RECYCLING MARKET, BY SOURCE, 2017–2020 (USD MILLION)
                     TABLE 68 NORTH AMERICA: EV BATTERY RECYCLING MARKET, BY SOURCE, 2021–2031 (USD MILLION)
                     TABLE 69 NORTH AMERICA: EV BATTERY RECYCLING MARKET, BY BATTERY CHEMISTRY, 2017–2020 (UNITS)
                     TABLE 70 NORTH AMERICA: ELECTRIC VEHICLES BATTERY RECYCLING MARKET, BY BATTERY CHEMISTRY, 2021–2031 (UNITS)
           9.3.2 US
                    9.3.2.1 Dominant electric vehicle battery recycling market in North America
                                TABLE 71 US: ELECTRIC VEHICLE BATTERY RECYCLING MARKET, BY SOURCE, 2017–2020 (USD MILLION)
                                TABLE 72 US: ELECTRIC VEHICLES BATTERY RECYCLING MARKET, BY SOURCE, 2021–2031 (USD MILLION)
           9.3.3 CANADA
                    9.3.3.1 Stringent implementation of Canadian Environmental Protection Act supporting market growth
                                TABLE 73 CANADA: ELECTRIC VEHICLE BATTERY RECYCLING MARKET, BY SOURCE, 2017–2020 (USD MILLION)
                                TABLE 74 CANADA: ELECTRIC VEHICLES BATTERY RECYCLING MARKET, BY SOURCE, 2021–2031 (USD MILLION)
                    9.3.3.2 Mexico
                               9.3.3.2.1 Government initiatives to drive EV battery recycling market
                                               TABLE 75 MEXICO: ELECTRIC VEHICLE BATTERY RECYCLING MARKET, BY SOURCE, 2017–2020 (USD MILLION)
                                               TABLE 76 MEXICO: ELECTRIC VEHICLES BATTERY RECYCLING MARKET, BY SOURCE, 2021–2031 (USD MILLION)
    9.4 EUROPE 
          FIGURE 36 EUROPE: ELECTRIC VEHICLE BATTERY RECYCLING MARKET SNAPSHOT
           9.4.1 IMPACT OF RECESSION
                    TABLE 77 EUROPE: ELECTRIC VEHICLE BATTERY RECYCLING MARKET, BY COUNTRY, 2017–2020 (USD MILLION)
                    TABLE 78 EUROPE: ELECTRIC VEHICLES BATTERY RECYCLING MARKET, BY COUNTRY, 2021–2031 (USD MILLION)
                    TABLE 79 EUROPE: EV BATTERY RECYCLING MARKET, BY COUNTRY, 2017–2020 (UNITS)
                    TABLE 80 EUROPE: EV BATTERY RECYCLING MARKET, BY COUNTRY, 2021–2031 (UNITS)
                    TABLE 81 EUROPE: EV BATTERY RECYCLING MARKET, BY SOURCE, 2017–2020 (USD MILLION)
                    TABLE 82 EUROPE: EV BATTERY RECYCLING MARKET, BY SOURCE, 2021–2031 (USD MILLION)
                    TABLE 83 EUROPE: EV BATTERY RECYCLING MARKET, BY BATTERY CHEMISTRY, 2017–2020 (UNITS)
                    TABLE 84 EUROPE: ELECTRIC VEHICLES BATTERY RECYCLING MARKET, BY BATTERY CHEMISTRY, 2021–2031 (UNITS)
           9.4.2 FRANCE
                    9.4.2.1 Development in battery recycling technologies to fuel market growth
                                TABLE 85 FRANCE: ELECTRIC VEHICLE BATTERY RECYCLING MARKET, BY SOURCE, 2017–2020 (USD MILLION)
                                TABLE 86 FRANCE: ELECTRIC VEHICLES BATTERY RECYCLING MARKET, BY SOURCE, 2021–2031 (USD MILLION)
           9.4.3 GERMANY
                    9.4.3.1 Shift toward renewable energy to drive market
                                TABLE 87 GERMANY: ELECTRIC VEHICLE BATTERY RECYCLING MARKET, BY SOURCE, 2017–2020 (USD MILLION)
                                TABLE 88 GERMANY: ELECTRIC VEHICLES BATTERY RECYCLING MARKET, BY SOURCE, 2021–2031 (USD MILLION)
           9.4.4 NETHERLANDS
                    9.4.4.1 Growth in EV industry to propel battery recycling market
                                TABLE 89 NETHERLANDS: ELECTRIC VEHICLE BATTERY RECYCLING MARKET, BY SOURCE, 2017–2020 (USD MILLION)
                                TABLE 90 NETHERLANDS: ELECTRIC VEHICLES BATTERY RECYCLING MARKET, BY SOURCE, 2021–2031 (USD MILLION)
           9.4.5 UK
                    9.4.5.1 Surge in sales of electric vehicles to fuel EV battery recycling market
                                TABLE 91 UK: ELECTRIC VEHICLE BATTERY RECYCLING MARKET, BY SOURCE, 2017–2020 (USD MILLION)
                                TABLE 92 UK: ELECTRIC VEHICLES BATTERY RECYCLING MARKET, BY SOURCE, 2021–2031 (USD MILLION)
           9.4.6 ITALY
                    9.4.6.1 Increasing capacity to recycle batteries and electric vehicle sales to drive market
                                TABLE 93 ITALY: ELECTRIC VEHICLE BATTERY RECYCLING MARKET, BY SOURCE, 2017–2020 (USD MILLION)
                                TABLE 94 ITALY: ELECTRIC VEHICLES BATTERY RECYCLING MARKET, BY SOURCE, 2021–2031 (USD MILLION)
           9.4.7 SPAIN
                    9.4.7.1 Robust growth in adoption of plug-in hybrid and battery electric vehicles to support market
                                TABLE 95 SPAIN: ELECTRIC VEHICLE BATTERY RECYCLING MARKET, BY SOURCE, 2017–2020 (USD MILLION)
                                TABLE 96 SPAIN: ELECTRIC VEHICLES BATTERY RECYCLING MARKET, BY SOURCE, 2021–2031 (USD MILLION)
           9.4.8 NORWAY
                    9.4.8.1 Replacement of internal combustion engine vehicles with advanced EVs to drive market
                                TABLE 97 NORWAY: ELECTRIC VEHICLE BATTERY RECYCLING MARKET, BY SOURCE, 2017–2020 (USD MILLION)
                                TABLE 98 NORWAY: ELECTRIC VEHICLES BATTERY RECYCLING MARKET, BY SOURCE, 2021–2031 (USD MILLION)
           9.4.9 SWEDEN
                    9.4.9.1 Increasing adoption of EVs and environment consciousness to fuel market growth
                                TABLE 99 SWEDEN: ELECTRIC VEHICLE BATTERY RECYCLING MARKET, BY SOURCE, 2017–2020 (USD MILLION)
                                TABLE 100 SWEDEN: ELECTRIC VEHICLES BATTERY RECYCLING MARKET, BY SOURCE, 2021–2031 (USD MILLION)
           9.4.10 REST OF EUROPE
                     TABLE 101 REST OF EUROPE: ELECTRIC VEHICLE BATTERY RECYCLING MARKET, BY SOURCE, 2017–2020 (USD MILLION)
                     TABLE 102 REST OF EUROPE: ELECTRIC VEHICLES BATTERY RECYCLING MARKET, BY SOURCE, 2021–2031 (USD MILLION)
 
10 COMPETITIVE LANDSCAPE (Page No. - 117)
     10.1 INTRODUCTION 
     10.2 KEY PLAYERS STRATEGIES/RIGHT TO WIN 
             10.2.1 OVERVIEW OF STRATEGIES ADOPTED BY ELECTRIC VEHICLE BATTERY RECYCLING COMPANIES
     10.3 REVENUE ANALYSIS 
             FIGURE 37 REVENUE ANALYSIS OF KEY COMPANIES (2018−2022)
     10.4 MARKET SHARE ANALYSIS 
             10.4.1 RANKING OF KEY MARKET PLAYERS
                        FIGURE 38 RANKING OF KEY PLAYERS IN ELECTRIC VEHICLE BATTERY RECYCLING MARKET, 2022
             10.4.2 MARKET SHARE OF KEY PLAYERS
                        FIGURE 39 ELECTRIC VEHICLE BATTERY RECYCLING MARKET SHARE ANALYSIS
                        TABLE 103 ELECTRIC VEHICLES BATTERY RECYCLING MARKET: DEGREE OF COMPETITION
                        10.4.2.1 Contemporary Amperex Technology Co., Limited
                        10.4.2.2 Glencore
                        10.4.2.3 GEM Co., Ltd.
                        10.4.2.4 ERAMET
                        10.4.2.5 Li-Cycle Corp
                        10.4.2.6 Umicore
                        10.4.2.7 BATX Energies
                        10.4.2.8 Cirba Solutions
                        10.4.2.9 ACCUREC-Recycling GmbH
                        10.4.2.10 Fortum
                        10.4.2.11 RecycLiCo Battery Materials, Inc.
     10.5 COMPANY EVALUATION MATRIX (TIER 1) 
             10.5.1 STARS
             10.5.2 EMERGING LEADERS
             10.5.3 PERVASIVE PLAYERS
             10.5.4 PARTICIPANTS
                        FIGURE 40 COMPANY EVALUATION MATRIX: EV BATTERY RECYCLING MARKET (TIER 1), 2022
     10.6 COMPANY FOOTPRINT 
             FIGURE 41 COMPANY FOOTPRINT
             TABLE 104 BATTERY CHEMISTRY FOOTPRINT
             TABLE 105 RECYCLING PROCESS FOOTPRINT
             TABLE 106 COMPANY REGION FOOTPRINT
     10.7 STARTUP/SME EVALUATION MATRIX 
             10.7.1 PROGRESSIVE COMPANIES
             10.7.2 RESPONSIVE COMPANIES
             10.7.3 DYNAMIC COMPANIES
             10.7.4 STARTING BLOCKS
                        FIGURE 42 STARTUPS/SMES EVALUATION MATRIX: ELECTRIC VEHICLE BATTERY RECYCLING MARKET
     10.8 COMPETITIVE BENCHMARKING 
             TABLE 107 ELECTRIC VEHICLE BATTERY RECYCLING MARKET: DETAILED LIST OF KEY STARTUPS/SMES
             TABLE 108 ELECTRIC VEHICLE BATTERY RECYCLING MARKET: COMPETITIVE BENCHMARKING OF KEY STARTUPS/SMES
     10.9 COMPETITIVE SCENARIO AND TRENDS 
             10.9.1 DEALS
                        TABLE 109 ELECTRIC VEHICLE BATTERY RECYCLING MARKET: DEALS (2019–2024)
             10.9.2 OTHER DEVELOPMENTS
                        TABLE 110 ELECTRIC VEHICLE BATTERY RECYCLING MARKET: OTHER DEVELOPMENTS (2019–2024)
 
11 COMPANY PROFILES (Page No. - 135)
     11.1 KEY PLAYERS 
(Business Overview, Products/Solutions/Services offered, Recent Developments, MnM View)*
             11.1.1 UMICORE
                        TABLE 111 UMICORE: COMPANY OVERVIEW
                        FIGURE 43 UMICORE: COMPANY SNAPSHOT
                        TABLE 112 UMICORE: PRODUCTS/SOLUTIONS/SERVICES OFFERED
                        TABLE 113 UMICORE: DEALS
             11.1.2 NEOMETALS LTD.
                        TABLE 114 NEOMETALS LTD.: COMPANY OVERVIEW
                        TABLE 115 NEOMETALS LTD.: PRODUCTS/SOLUTIONS/SERVICES OFFERED
                        TABLE 116 NEOMETALS LTD.: DEALS
                        TABLE 117 NEOMETALS LTD.: OTHERS
             11.1.3 LI-CYCLE CORP.
                        TABLE 118 LI-CYCLE CORP.: COMPANY OVERVIEW
                        FIGURE 44 LI-CYCLE CORP.: COMPANY SNAPSHOT
                        TABLE 119 LI-CYCLE CORP.: PRODUCTS/SOLUTIONS/SERVICES OFFERED
                        TABLE 120 LI-CYCLE CORP.: DEALS
                        TABLE 121 LI-CYCLE CORP.: OTHERS
             11.1.4 RECYCLICO BATTERY MATERIALS INC.
                        TABLE 122 RECYCLICO BATTERY MATERIALS INC.: COMPANY OVERVIEW
                        TABLE 123 RECYCLICO BATTERY MATERIALS INC.: PRODUCTS/SOLUTIONS/SERVICES OFFERED
                        TABLE 124 RECYCLICO BATTERY MATERIALS INC.: DEALS
                        TABLE 125 RECYCLICO BATTERY MATERIALS INC.: OTHERS
             11.1.5 ACCUREC-RECYCLING GMBH
                        TABLE 126 ACCUREC-RECYCLING GMBH: COMPANY OVERVIEW
                        TABLE 127 ACCUREC-RECYCLING GMBH: PRODUCTS/SOLUTIONS/SERVICES OFFERED
                        TABLE 128 ACCUREC-RECYCLING GMBH: OTHERS
             11.1.6 FORTUM
                        TABLE 129 FORTUM: COMPANY OVERVIEW
                        FIGURE 45 FORTUM: COMPANY SNAPSHOT
                        TABLE 130 FORTUM: PRODUCTS/SOLUTIONS/SERVICES OFFERED
                        TABLE 131 FORTUM: DEALS
                        TABLE 132 FORTUM: OTHERS
             11.1.7 CIRBA SOLUTIONS
                        TABLE 133 CIRBA SOLUTIONS: COMPANY OVERVIEW
                        TABLE 134 CIRBA SOLUTIONS: PRODUCTS/SOLUTIONS/SERVICES OFFERED
                        TABLE 135 CIRBA SOLUTIONS: DEALS
             11.1.8 CONTEMPORARY AMPEREX TECHNOLOGY CO., LIMITED
                        TABLE 136 CONTEMPORARY AMPEREX TECHNOLOGY CO., LIMITED: COMPANY OVERVIEW
                        TABLE 137 CONTEMPORARY AMPEREX TECHNOLOGY CO., LIMITED: PRODUCTS/SOLUTIONS/SERVICES OFFERED
                        TABLE 138 CONTEMPORARY AMPEREX TECHNOLOGY CO., LIMITED: DEALS
                        TABLE 139 CONTEMPORARY AMPEREX TECHNOLOGY CO., LIMITED: OTHERS
             11.1.9 ECOBAT
                        TABLE 140 ECOBAT: COMPANY OVERVIEW
                        TABLE 141 ECOBAT: PRODUCTS/SOLUTIONS/SERVICES OFFERED
                        TABLE 142 ECOBAT: DEALS
                        TABLE 143 ECOBAT: OTHERS
             11.1.10 TES
                        TABLE 144 TES: COMPANY OVERVIEW
                        TABLE 145 TES: PRODUCTS/SOLUTIONS/SERVICES OFFERED
                        TABLE 146 TES: DEALS
                        TABLE 147 TES: OTHERS
             11.1.11 STENA RECYCLING
                        TABLE 148 STENA RECYCLING: COMPANY OVERVIEW
                        TABLE 149 STENA RECYCLING: PRODUCTS/SOLUTIONS/SERVICES OFFERED
                        TABLE 150 STENA RECYCLING: DEALS
                        TABLE 151 STENA RECYCLING: OTHERS
             11.1.12 SHENZHEN HIGHPOWER TECHNOLOGY CO., LTD.
                        TABLE 152 SHENZHEN HIGHPOWER TECHNOLOGY CO., LTD.: COMPANY OVERVIEW
                        TABLE 153 SHENZHEN HIGHPOWER TECHNOLOGY CO., LTD.: PRODUCTS/SOLUTIONS/SERVICES OFFERED
             11.1.13 REDWOOD MATERIALS INC.
                        TABLE 154 REDWOOD MATERIALS INC.: COMPANY OVERVIEW
                        TABLE 155 REDWOOD MATERIALS INC.: PRODUCTS/SOLUTIONS/SERVICES OFFERED
                        TABLE 156 REDWOOD MATERIALS INC.: DEALS
                        TABLE 157 REDWOOD MATERIALS INC.: OTHERS
             11.1.14 GEM CO., LTD.
                        TABLE 158 GEM CO., LTD.: COMPANY OVERVIEW
                        FIGURE 46 GEM CO., LTD.: COMPANY SNAPSHOT
                        TABLE 159 GEM CO., LTD.: PRODUCTS/SOLUTIONS/SERVICES OFFERED
                        TABLE 160 GEM CO., LTD.: DEALS
             11.1.15 ASCEND ELEMENTS, INC.
                        TABLE 161 ASCEND ELEMENTS, INC.: COMPANY OVERVIEW
                        TABLE 162 ASCEND ELEMENTS, INC.: PRODUCTS/SOLUTIONS/SERVICES OFFERED
                        TABLE 163 ASCEND ELEMENTS, INC.: DEALS
                        TABLE 164 ASCEND ELEMENTS, INC.: OTHERS
             11.1.16 BATX ENERGIES
                        TABLE 165 BATX ENERGIES: COMPANY OVERVIEW
                        TABLE 166 BATX ENERGIES: PRODUCTS/SOLUTIONS/SERVICES OFFERED
             11.1.17 GLENCORE
                        TABLE 167 GLENCORE: COMPANY OVERVIEW
                        FIGURE 47 GLENCORE: COMPANY SNAPSHOT
                        TABLE 168 GLENCORE: PRODUCTS/SOLUTIONS/SERVICES OFFERED
                        TABLE 169 GLENCORE: DEALS
             11.1.18 AUSTRALIAN BATTERY RECYCLING INITIATIVE
                        TABLE 170 AUSTRALIAN BATTERY RECYCLING INITIATIVE: COMPANY OVERVIEW
                        TABLE 171 AUSTRALIAN BATTERY RECYCLING INITIATIVE: PRODUCTS/SOLUTIONS/SERVICES OFFERED
             11.1.19 ACE GREEN RECYCLING
                        TABLE 172 ACE GREEN RECYCLING: COMPANY OVERVIEW
                        TABLE 173 ACE GREEN RECYCLING: PRODUCTS/SOLUTIONS/SERVICES OFFERED
                        TABLE 174 ACE GREEN RECYCLING: DEALS
                        TABLE 175 ACE GREEN RECYCLING: OTHERS
             11.1.20 PRIMOBIUS GMBH
                        TABLE 176 PRIMOBIUS GMBH: COMPANY OVERVIEW
                        TABLE 177 PRIMOBIUS GMBH: PRODUCTS/SOLUTIONS/SERVICES OFFERED
                        TABLE 178 PRIMOBIUS GMBH: DEALS
                        TABLE 179 PRIMOBIUS GMBH: OTHERS
             11.1.21 ATTERO RECYCLING PVT. LTD
                        TABLE 180 ATTERO RECYCLING PVT. LTD: COMPANY OVERVIEW
                        TABLE 181 ATTERO RECYCLING PVT. LTD: PRODUCTS/SOLUTIONS/SERVICES OFFERED
                        TABLE 182 ATTERO RECYCLING PVT. LTD: DEALS
             11.1.22 TRISHULAVEL ESHAN PVT. LTD. (LI-CIRCLE)
                        TABLE 183 TRISHULAVEL ESHAN PVT. LTD. (LI-CIRCLE): COMPANY OVERVIEW
                        TABLE 184 TRISHULAVEL ESHAN PVT. LTD. (LI-CIRCLE): PRODUCTS/SOLUTIONS/SERVICES OFFERED
             11.1.23 ERAMET
                        TABLE 185 ERAMET: COMPANY OVERVIEW
                        FIGURE 48 ERAMET: COMPANY SNAPSHOT
                        TABLE 186 ERAMET: PRODUCTS/SOLUTIONS/SERVICES OFFERED
                        TABLE 187 ERAMET: DEALS
     11.2 OTHER PLAYERS 
             11.2.1 ENVIROSTREAM AUSTRALIA PTY LTD.
                        TABLE 188 ENVIROSTREAM AUSTRALIA PTY LTD.: COMPANY OVERVIEW
                        TABLE 189 ENVIROSTREAM AUSTRALIA PTY LTD.: PRODUCTS/SOLUTIONS/SERVICES OFFERED
                        TABLE 190 ENVIROSTREAM AUSTRALIA PTY LTD.: OTHERS
             11.2.2 DUESENFELD GMBH
                        TABLE 191 DUESENFELD GMBH: COMPANY OVERVIEW
                        TABLE 192 DUESENFELD GMBH: PRODUCTS/SOLUTIONS/SERVICES OFFERED
             11.2.3 LITHION TECHNOLOGIES
                        TABLE 193 LITHION TECHNOLOGIES: COMPANY OVERVIEW
                        TABLE 194 LITHION TECHNOLOGIES: PRODUCTS/SOLUTIONS/SERVICES OFFERED
             11.2.4 BATREC INDUSTRIE
                        TABLE 195 BATREC INDUSTRIE: COMPANY OVERVIEW
                        TABLE 196 BATREC INDUSTRIE: PRODUCTS/SOLUTIONS/SERVICES OFFERED
             11.2.5 SITRASA
                        TABLE 197 SITRASA: COMPANY OVERVIEW
                        TABLE 198 SITRASA: PRODUCTS/SOLUTIONS/SERVICES OFFERED
             11.2.6 TATA CHEMICALS LIMITED.
                        TABLE 199 TATA CHEMICALS LIMITED: COMPANY OVERVIEW
                        TABLE 200 TATA CHEMICALS LIMITED: PRODUCTS/SOLUTIONS/SERVICES OFFERED
                        TABLE 201 TATA CHEMICALS LIMITED: DEALS
             11.2.7 EXIGO RECYCLING PVT. LTD.
                        TABLE 202 EXIGO RECYCLING PVT. LTD: COMPANY OVERVIEW
                        TABLE 203 EXIGO RECYCLING PVT. LTD: PRODUCTS/SOLUTIONS/SERVICES OFFERED
             11.2.8 ZIPTRAX
                        TABLE 204 ZIPTRAX: COMPANY OVERVIEW
                        TABLE 205 ZIPTRAX: PRODUCTS/SOLUTIONS/SERVICES OFFERED
             11.2.9 JX NIPPON
                        TABLE 206 JX NIPPON: COMPANY OVERVIEW
                        TABLE 207 JX NIPPON: PRODUCTS/SOLUTIONS/SERVICES OFFERED
 
*Details on Business Overview, Products/Solutions/Services offered, Recent Developments, MnM View might not be captured in case of unlisted companies.
 
12 ADJACENT AND RELATED MARKETS (Page No. - 201)
     12.1 INTRODUCTION 
     12.2 LIMITATIONS 
     12.3 ELECTRIC VEHICLE BATTERY RECYCLING INTERCONNECTED MARKETS 
     12.4 BATTERY RECYCLING MARKET 
             12.4.1 MARKET DEFINITION
             12.4.2 MARKET OVERVIEW
             12.4.3 LUBRICANTS MARKET, BY CHEMISTRY
                        TABLE 208 BATTERY RECYCLING MARKET, BY CHEMISTRY, 2018–2020 (USD MILLION)
                        TABLE 209 BATTERY RECYCLING MARKET, BY CHEMISTRY, 2021–2030 (USD MILLION)
                        TABLE 210 LEAD ACID BATTERIES: BATTERY RECYCLING MARKET, BY REGION, 2018–2020 (USD MILLION)
                        TABLE 211 LEAD ACID BATTERIES: BATTERY RECYCLING MARKET, BY REGION, 2021–2030 (USD MILLION)
                        TABLE 212 NICKEL-BASED BATTERIES: BATTERY RECYCLING MARKET, BY REGION, 2018–2020 (USD MILLION)
                        TABLE 213 NICKEL-BASED BATTERIES: BATTERY RECYCLING MARKET, BY REGION, 2021–2030 (USD MILLION)
                        TABLE 214 LITHIUM-BASED BATTERIES: BATTERY RECYCLING MARKET, BY REGION, 2018–2020 (USD MILLION)
                        TABLE 215 LITHIUM-BASED BATTERIES: BATTERY RECYCLING MARKET, BY REGION, 2021–2030 (USD MILLION)
                        TABLE 216 OTHERS: BATTERY RECYCLING MARKET, BY REGION, 2018–2020 (USD MILLION)
                        TABLE 217 OTHERS: BATTERY RECYCLING MARKET, BY REGION, 2021–2030 (USD MILLION)
 
13 APPENDIX (Page No. - 206)
     13.1 DISCUSSION GUIDE 
     13.2 KNOWLEDGESTORE: MARKETSANDMARKETS’ SUBSCRIPTION PORTAL 
     13.3 CUSTOMIZATION OPTIONS 
     13.4 RELATED REPORTS 
     13.5 AUTHOR DETAILS 

The study involved four major activities in estimating the current size of the EV battery recycling market market. Exhaustive secondary research was done to collect information on the market, peer markets, and parent market. The next step was to validate these findings, assumptions, and sizing with the industry experts across the EV  battery recycling market value chain through primary research. Both top-down and bottom-up approaches were employed to estimate the complete market size. Thereafter, market breakdown and data triangulation were used to estimate the market size of segments and subsegments.

Secondary Research

Secondary sources for this research study include annual reports, press releases, and investor presentations of companies; white papers; certified publications; and articles by recognized authors; gold- and silver-standard websites; EV battery recycling market manufacturing companies, regulatory bodies, trade directories, and databases. The secondary research was mainly used to obtain key information about the industry’s supply chain, the total pool of key players, market classification, and segmentation according to industry trends to the bottom-most level and regional markets. It has also been used to obtain information about key developments from a market-oriented perspective.

Primary Research

The EV battery recycling market market  comprises several stakeholders, such as such as raw material suppliers, technology support providers, EV battery recycling market manufacturers, and regulatory organizations in the supply chain. Various primary sources from both the supply and demand sides of the market were interviewed to obtain qualitative and quantitative information. Primary sources from the supply side included industry experts such as Chief Executive Officers (CEOs), vice presidents, marketing directors, technology and innovation directors, and related key executives from various key companies and organizations operating in the EV  battery recycling market market . Primary sources from the demand side included directors, marketing heads, and purchase managers from various sourcing industries. Following is the breakdown of the primary respondents:
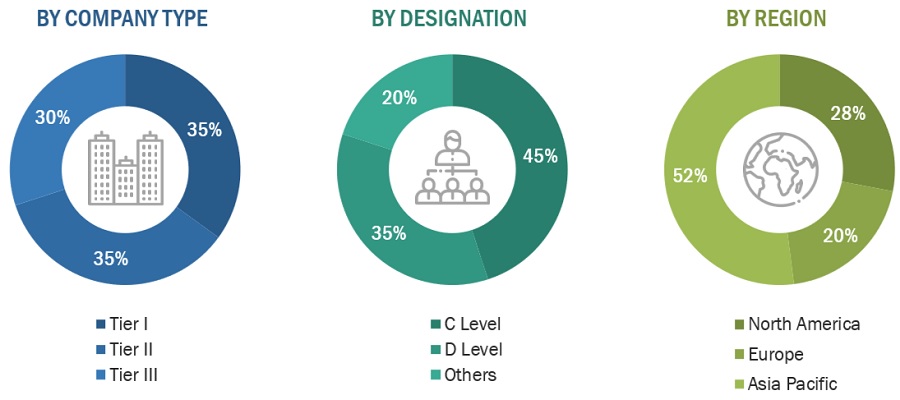
Electric Vehicles Battery Recycling Market Size, and Share

To know about the assumptions considered for the study, download the pdf brochure

Market Size Estimation

Both the top-down and bottom-up approaches have been used to estimate and validate the total size of the EV battery recycling market market. These approaches have also been used extensively to estimate the size of various dependent subsegments of the market. The research methodology used to estimate the market size included the following:

The following segments provide details about the overall market size estimation process employed in this study

  • The key players in the market were identified through secondary research.
  • The market shares in the respective regions were identified through primary and secondary research.
  • The value chain and market size of the EV battery recycling market market, in terms of value, were determined through primary and secondary research.
  • All percentage shares, splits, and breakdowns were determined using secondary sources and verified through primary sources.
  • All possible parameters that affect the market covered in this research study were accounted for, viewed in extensive detail, verified through primary research, and analyzed to obtain the final quantitative and qualitative data.
  • The research included the study of annual and financial reports of the top market players and interviews with industry experts, such as CEOs, VPs, directors, sales managers, and marketing executives, for key insights, both quantitative and qualitative.

Global EV battery recycling market market  Size: Bottom-Up Approach
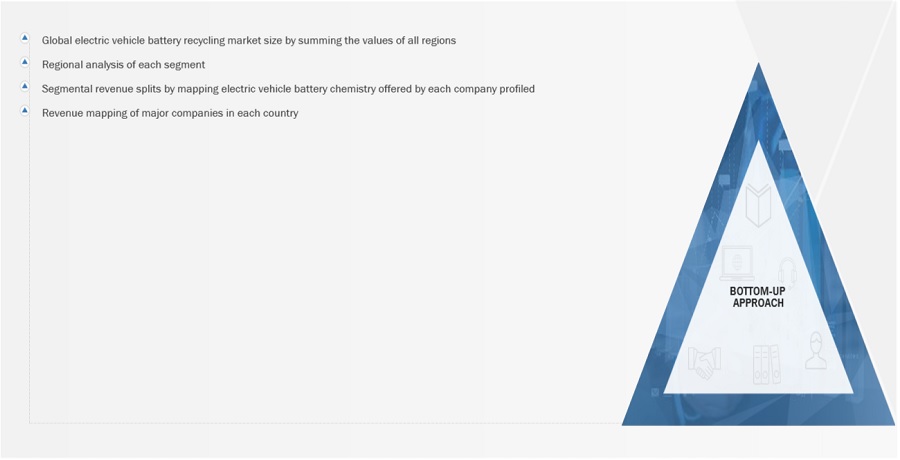
Electric Vehicles Battery Recycling Market Size, and Share

To know about the assumptions considered for the study, Request for Free Sample Report

Global EV  Battery Recycling Market  Size: Top-Down Approach
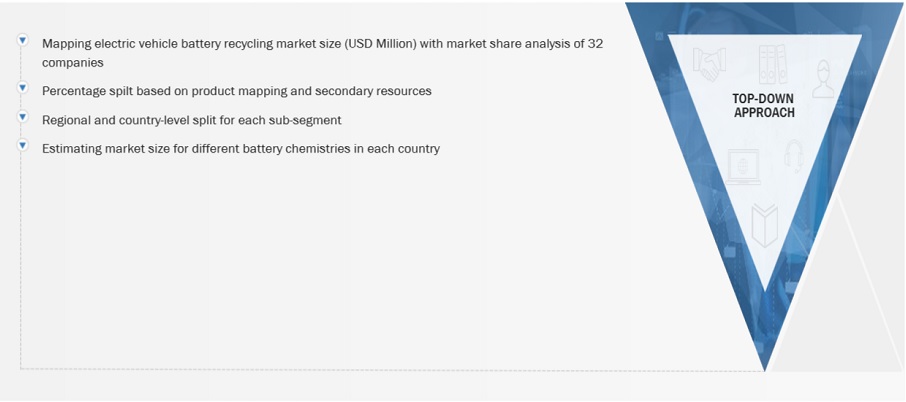
Electric Vehicles Battery Recycling Market Size, and Share

Data Triangulation

After arriving at the overall market size using the market size estimation processes as explained above, the market was split into several segments and sub-segments. To complete the overall market engineering process and arrive at the exact statistics of each market segment and subsegment, the data triangulation and market breakdown procedures were employed, wherever applicable. The data was triangulated by studying various factors and trends from both the demand and supply sides in the oil & gas sector.

Market Definition

The recycling of electric vehicle (EV) batteries involves recovering and repurposing materials from used lithium-ion batteries to reduce environmental impact and handle waste responsibly. This includes collecting, sorting, and dismantling batteries, followed by shredding to separate components. Chemical and mechanical methods are then utilized to extract valuable materials such as lithium, cobalt, and nickel. These recovered materials can be reintegrated into the production of new batteries, promoting resource conservation and lessening the need for raw materials. Additionally, effective recycling contributes to responsible disposal of hazardous waste, fostering a sustainable and circular approach within the electric vehicle industry.

Key Stakeholders

  • Raw material manufacturers
  • Technology support providers
  • Manufacturers of EV battery recycling market
  • Traders, distributors, and suppliers
  • Regulatory Bodies and Government Agencies
  • Research & Development (R&D) Institutions
  • End-use Industries
  • Consulting Firms, Trade Associations, and Industry Bodies
  • Investment Banks and Private Equity Firms

Report Objectives

  • To analyze and forecast the market size of EV battery recycling market market in terms of value and volume
  • To provide detailed information regarding the major factors (drivers, restraints, challenges, and opportunities) influencing the regional market
  • To analyze and forecast the global EV battery recycling market on the basis of battery chemistry , sources,process and region.
  • To analyze the opportunities in the market for stakeholders and provide details of a competitive landscape for market leaders
  • To forecast the size of various market segments based on four major regions: North America, Europe, Asia Pacific along with their respective key countries
  • To track and analyze the competitive developments, such as acquisitions, partnerships, collaborations, agreements and expansions in the market
  • To strategically profile the key players and comprehensively analyze their market shares and core competencies

Available Customizations

With the given market data, MarketsandMarkets offers customizations according to the client-specific needs.

The following customization options are available for the report:

  • Additional country-level analysis of the EV battery recycling market market  
  • Profiling of additional market players (up to 5)

Product Analysis

  • Product matrix, which gives a detailed comparison of the product portfolio of each company.
Custom Market Research Services

We will customize the research for you, in case the report listed above does not meet with your exact requirements. Our custom research will comprehensively cover the business information you require to help you arrive at strategic and profitable business decisions.

Request Customization
Report Code
CH 8945
Published ON
Feb, 2024
Choose License Type
BUY NOW
  • SHARE
X
Request Customization
Speak to Analyst
Speak to Analyst
OR FACE-TO-FACE MEETING
PERSONALIZE THIS RESEARCH
  • Triangulate with your Own Data
  • Get Data as per your Format and Definition
  • Gain a Deeper Dive on a Specific Application, Geography, Customer or Competitor
  • Any level of Personalization
REQUEST A FREE CUSTOMIZATION
LET US HELP YOU!
  • What are the Known and Unknown Adjacencies Impacting the Electric Vehicles Battery Recycling Market
  • What will your New Revenue Sources be?
  • Who will be your Top Customer; what will make them switch?
  • Defend your Market Share or Win Competitors
  • Get a Scorecard for Target Partners
CUSTOMIZED WORKSHOP REQUEST
knowledgestore logo

Want to explore hidden markets that can drive new revenue in Electric Vehicles Battery Recycling Market?

Find Hidden Markets
  • Call Us
  • +1-888-600-6441 (Corporate office hours)
  • +1-888-600-6441 (US/Can toll free)
  • +44-800-368-9399 (UK office hours)
CONNECT WITH US
ABOUT TRUST ONLINE
©2024 MarketsandMarkets Research Private Ltd. All rights reserved
DMCA.com Protection Status
Website Feedback