Railway Management System Market

Railway Management System Market by Offering (Solutions, Services), Solutions (Rail Operations Management, Rail Traffic Management, Rail Asset Management, In-train Intelligent Solutions) and Region - Global Forecast to 2029

Report Code: TC 2357 Apr, 2024, by marketsandmarkets.com

[219 Pages Report] MarketsandMarkets forecasts that the railway management system market size is projected to grow from USD 57.1 billion in 2024 to USD 87.3 billion by 2029, at a CAGR of 8.9% during the forecast period. Government initiatives aimed at modernizing transportation infrastructure and promoting sustainable mobility often involve substantial investments in railway projects. Funding support for railway management system upgrades and expansions contributes to market growth. Concerns about environmental pollution and carbon emissions are prompting a shift towards greener transportation options. Railways are inherently more energy-efficient and eco-friendly compared to other modes of transport, driving investment in railway management systems.
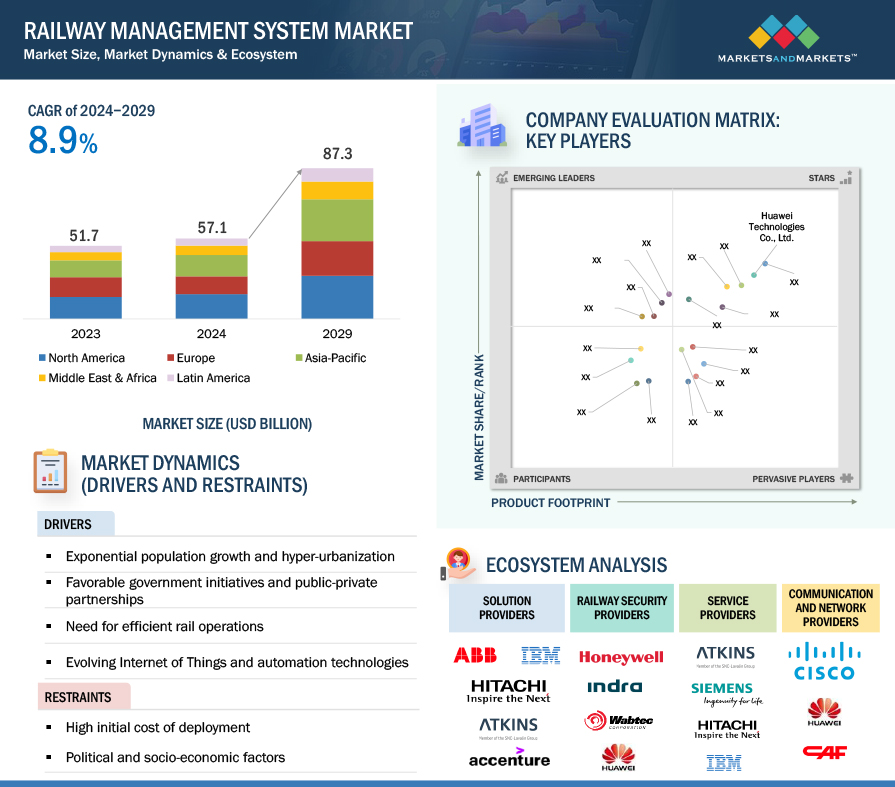
Railway Management System Market

To know about the assumptions considered for the study, Request for Free Sample Report
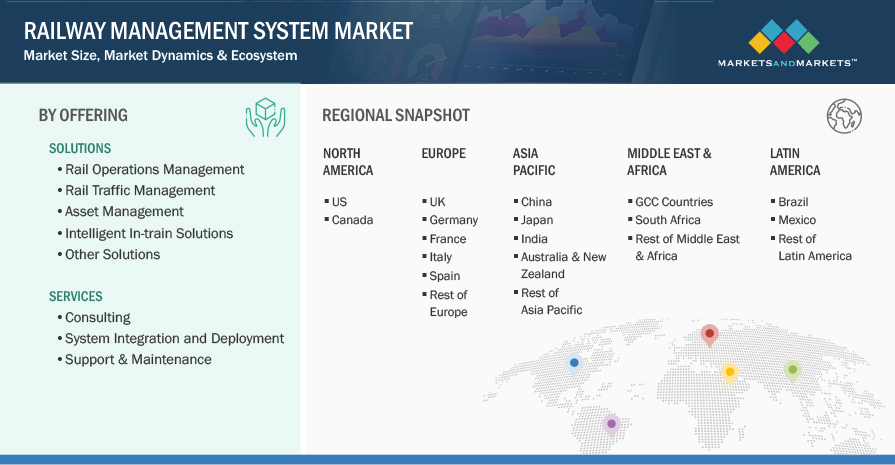
Railway Management System Market Opportunities

To know about the assumptions considered for the study, download the pdf brochure

Railway Management System Market Dynamics

Driver:  Need for efficiency in rail operations

An efficient rail operation needs the proper scheduling, monitoring, and maintenance of rail assets. Maintenance schedules reduce asset productivity due to downtime. This downtime is further elongated as a result of manual diagnostics with a low success rate. To enhance efficiency and reduce time consumption, rail authorities heavily focus on condition-based and predictive maintenance solutions. These solutions help in timely monitoring and efficiently scheduling of assets, thus minimizing downtime.

Predictive and condition-based maintenance reduce reliance on manual diagnostics by using analytics in real time. The widespread use of GPS sensors, detectors, and Radio Frequency Identification (RFID) in rail assets and infrastructures has been made possible by IoT technology. This in turn makes it possible to gather, transfer, and analyze many attributes, including condition, location, temperature, heat, and pressure. This helps improve the maintenance cycle of rail assets. The data from rail assets can be used to optimize rail asset utilization. It also enables the scheduled maintenance of assets, and resource intensities and costs.

Restraint: Political and socio-economic factors

Political and socio-economic factors exert significant influence on the railway management system market. Government policies and funding allocations play a pivotal role in determining the pace and scope of infrastructure development, often subjecting projects to shifts in political priorities and budget constraints. Regulatory frameworks, including safety and environmental standards, shape the design and implementation of management systems, adding complexity and cost. Public-private partnerships, crucial for financing and operation, are sensitive to political stability and policy consistency, impacting private sector involvement. Economic conditions, such as GDP growth and inflation, directly affect investment decisions, with downturns potentially delaying projects and technology upgrades due to budget constraints. Socio-economic development goals, often driving railway projects, must navigate competing interests and community concerns, influencing project planning and execution. Regional disparities in wealth and access to resources can exacerbate technological gaps, widening inequalities in transportation services. Moreover, public perception and stakeholder engagement, critical for project acceptance, can be influenced by socio-economic factors, shaping political decisions and project outcomes.

Opportunity: Increase in the demand for cloud-based services

With their dependable security environment and effective IT administration, cloud-based services, analytics, and internet technologies are becoming more and more in demand. The largest opportunity for rail transport to accept data's evolving architecture and make the most of it is through the big data cloud framework. It provides all rail management businesses with the opportunity to make a significant change that will allow them to improve rail operations and infrastructure. Big data applications are predicted to expand in complexity at a quick rate because of the growing amount of data, new technologies, and the growing requirement for optimum cost-efficiency. These factors would influence the growth of new analytics platforms and data storage.

Challenge: Maintenance and Support

1Maintenance and support pose significant challenges in the railway management system market due to the intricate nature of railway operations. The complexity of these systems, comprising a multitude of interconnected hardware and software components, demands specialized skills for effective diagnosis and troubleshooting. Moreover, diverse technologies integrated into railway networks, such as signaling systems and rolling stock, require coordinated maintenance efforts, often complicated by interoperability issues and legacy infrastructure. Ensuring compliance with stringent safety and regulatory standards further adds complexity to maintenance workflows, necessitating meticulous inspection and documentation processes. Accessing remote or inaccessible locations, common in railway infrastructure, presents logistical hurdles for maintenance crews, driving the need for innovative solutions like remote monitoring technologies. Additionally, aging infrastructure and budget constraints exacerbate maintenance challenges, underscoring the importance of proactive strategies and workforce training to optimize asset performance and reliability.

Railway Management System Market Ecosystem

Prominent companies in this market have innovated their offerings and possess a diversified product portfolio, state-of-the-art technologies, and marketing networks. Prominent companies in this market include Alstom SA (France), Huawei Technologies Co., Ltd. (China), Siemens AG (Germany), Hitachi, Ltd. (Japan), Wabtec Corporation (US), Cisco Systems, Inc. (US), ABB (Switzerland), Indra Sistemas, S.A. (Spain), IBM (US), CAF, Construcciones y Auxiliar de Ferrocarriles, S.A. (Spain).
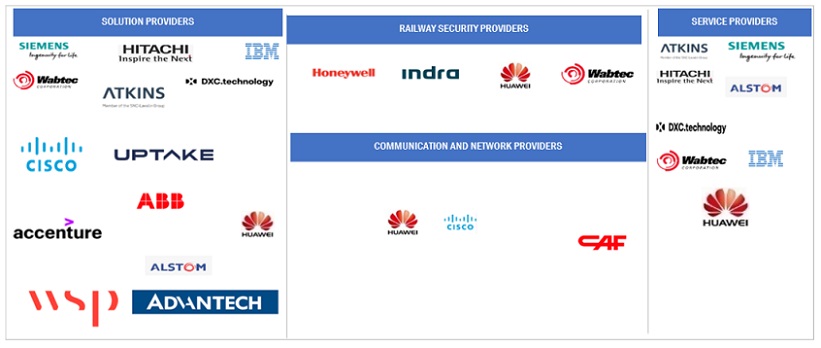
Top Companies in Railway Management System Market

Based on solution, the rail operations management segment is expected to grow with the highest CAGR during the forecast period

The rail operations management system offers solutions to enhance daily operations by analyzing the current status of all railway facilities and infrastructure in real-time. It ensures minimal disruptions in operations by centrally controlling and managing various aspects such as rail infrastructure, traffic flow, freight and passenger handling, revenue and ticketing, workforce, and rail automation. One of its key benefits is the prevention of unwanted incidents or accidents through real-time monitoring of rail movements. Major companies providing solutions for rail operations management include Alstom, Hitachi, Huawei, Wabtec, and IBM.

By services, the support and maintenance segment to hold the largest market size during the forecast period.

The support and maintenance services include round-the-clock troubleshooting assistance, seamless upgrading of current solutions, adept problem-solving, and timely repair or replacement of faulty components. Moreover, proactive services, along with technical support provided by skilled technicians, enhance operational resilience. Additionally, comprehensive test scenario management, facility inspections, and customized training programs contribute to the effectiveness of railway management system solutions. By adopting support and maintenance services, organizations mitigate business risks and reinforce the reliability of their railway management systems, ensuring uninterrupted operations and safeguarding critical assets.

Based on region, Asia Pacific is expected to grow with the highest CAGR during the forecast period.

The railway management market in Asia Pacific is experiencing robust growth, fueled by factors such as rapid urbanization, population expansion, and the pressing need for efficient transportation solutions. Countries across the region are investing heavily in expanding and modernizing their railway infrastructure, with a particular emphasis on high-speed rail networks to enhance connectivity and stimulate economic development. Technology adoption is on the rise, with the integration of IoT, predictive analytics, and automation aimed at improving operational efficiency and passenger experience. Public-private partnerships play a significant role in project development, facilitating innovative financing models and accelerated implementation. Sustainability is also a key focus, with initiatives aimed at reducing carbon emissions and promoting modal shift from road to rail. With a diverse range of market players and intense competition, the railway management market in Asia Pacific presents vast opportunities for growth and innovation, shaping the future of transportation in the region.
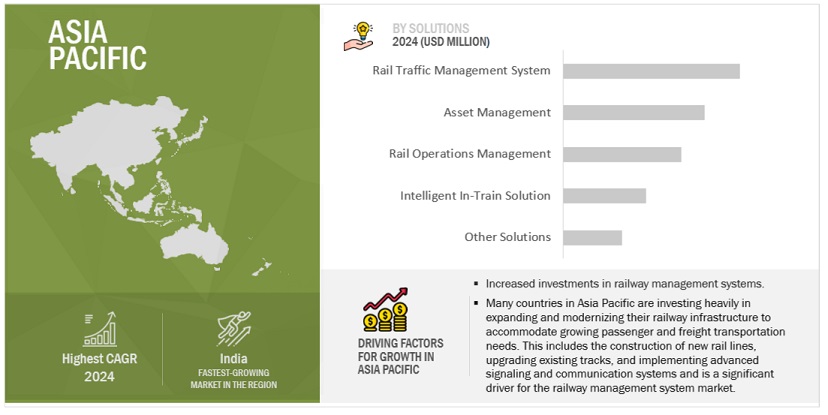
Asia Pacific Railway Management System Market Size, and Share

Market Players:

The major players in the Railway management system market Alstom SA (France), Huawei Technologies Co., Ltd. (China), Siemens AG (Germany), Hitachi, Ltd. (Japan), Wabtec Corporation (US). These players have adopted various growth strategies, such as partnerships, agreements and collaborations, new product launches, product enhancements, and acquisitions to expand their footprint in the railway management system market.

Get online access to the report on the World's First Market Intelligence Cloud

  • Easy to Download Historical Data & Forecast Numbers
  • Company Analysis Dashboard for high growth potential opportunities
  • Research Analyst Access for customization & queries
  • Competitor Analysis with Interactive dashboard
  • Latest News, Updates & Trend analysis
Request Sample

Scope of the Report

Report Metrics

Details

Market size available for years

2019-2029

Base year considered

2023

Forecast period

2024–2029

Forecast units

Value (USD) Million/Billion

Segments Covered

Offering (Solutions(Rail Operations Management, Rail Traffic Management (Signaling Solutions, Real-Time Train Planning And Route Scheduling/Optimizing, Centralized Traffic Control, Positive Train Control, Rail Communications-Based Train Control (CBTC), Other Traffic Management Solutions), Asset Management (Enterprise Asset Management, Field Service Management, Asset Performance Management, Other Aseet Management Systems), Intelligent In-Train Solutions, Other Solutions), Services (Consulting Services, System Integration and Deployment Services, Support And Maintenance Services), and Region

Region covered

North America, Europe, Asia Pacific, Middle East & Africa, Latin America

Companies covered

Alstom SA (France), Huawei Technologies Co., Ltd. (China), Siemens AG (Germany), Hitachi, Ltd. (Japan), Wabtec Corporation (US), Cisco Systems, Inc. (US), ABB (Switzerland), Indra Sistemas, S.A. (Spain), IBM (US), Honeywell International Inc. (US), CAF, Construcciones y Auxiliar de Ferrocarriles, S.A. (Spain), WSP (Canada), Kyosan Electric Mfg. Co., (Japan), Advantech Co., Ltd. (Taiwan), Thales (France), Amadeus IT Group SA (Spain), AtkinsRéalis (UK), DXC Technology Company (US), Fujitsu Limited (Japan), Railroad Software (US), RAILCUBE (Netherlands), Uptake Technologies Inc. (US), NWAY Technologies Private Limited (India), Eurotech S.p.A. (Italy), Frequentis (Austria), Railinc Corporation (US), and Arcadis Gen Holdings Limited (UK)

This research report categorizes the railway management system market based on offering, test solution, type of test, end user, and region.

Based on Offering:
  • Solutions
    • Rail Operations Management
    • Rail Traffic Management
      • Signaling Solutions
      • Real-Time Train Planning And Route Scheduling/Optimizing
      • Centralized Traffic Control
      • Positive Train Control
      • Rail Communications-Based Train Control (CBTC)
      • Other Traffic Management Solutions
    • Asset Management
      • Enterprise Asset Management
      • Field Service Management
      • Asset Performance Management
      • Other Aseet Management Systems
    • Intelligent In-Train Solutions
    • Other Solutions
  • Services
    • Consulting Services
    • System Integration And Deployment Services
    • Support And Maintenance Services
Based on the region:
  • North America
    • US
    • Canada
  • Europe
    • UK
    • Germany
    • France
    • Italy
    • Spain
    • Rest of Europe
  • Asia Pacific
    • China
    • Japan
    • India
    • Australia & New Zealand
    • Rest of Asia Pacific
  • Middle East & Africa
    • GCC Countries
      • UAE
      • KSA
      • Rest of GCC Countries
    • South Africa
    • Rest of Middle East & Africa
  • Latin America
    • Brazil
    • Mexico
    • Rest of Latin America

Recent Developments

  • In March 2024, Siemens partnered with Metrolinx, the regional public transit operator for the Greater Toronto and Hamilton Area, to handle their track, signal, and right-of-way maintenance for the Central Region of Toronto's passenger railway infrastructure system. This partnership builds upon Siemens Mobility's existing maintenance services in the West Region and signal and communications services at the Metrolinx Network Operations Center.
  • In March 2024, Hitachi Rail announced the launch of Train Maintenance DX as a Service, the industry's first "as a Service" solution to improve the work environment and the quality of train maintenance for railway operators, using the digital expertise in train manufacturing that it has accumulated at its Kasado Works in Kudamatsu City, Yamaguchi Prefecture in Japan.
  • In February 2024, Alstom has signed a central service agreement with PKP Polskie Linie Kolejowe S.A, managing the Polish national railway network. The contract aims to offer post-warranty maintenance for railway traffic control devices and computer systems produced by Alstom. This includes Alstom’s railway traffic control systems, track vacancy system (SOL) and power supply. Alstom will provide service support for 328 facilities in 17 Railway Line plants located throughout Poland.
  • In February 2024, Huawei launched its Smart Railway Perimeter Detection solution, to empower high-speed, secure, intelligent, and sustainable development across the transportation industry, facilitating intelligent railway transformation.
  • In December 2023, Alstom launched India’s first Digital Experience Centre ever built by a rail OEM. Located in Bangalore and spread over 5000 sq.ft., the Digital Experience is a hub for executing Urban, Mainline, Freight & Mining (specific market) projects along with the integrated cybersecurity, Security & Telecom and SCADA features. With this center, Alstom has its largest signaling lab infrastructure spread over 60000 sq.ft. in India that aids the company’s vision of making India a global hub for technology and innovation.

Frequently Asked Questions (FAQ):

To speak to our analyst for a discussion on the above findings, click Speak to Analyst

TABLE OF CONTENTS
 
1 INTRODUCTION (Page No. - 24)
    1.1 STUDY OBJECTIVES 
    1.2 MARKET DEFINITION 
    1.3 MARKET SCOPE 
           1.3.1 MARKETS COVERED
                    FIGURE 1 RAILWAY MANAGEMENT SYSTEM MARKET SEGMENTATION
           1.3.2 REGIONS COVERED
           1.3.3 YEARS CONSIDERED
    1.4 INCLUSIONS AND EXCLUSIONS 
           TABLE 1 INCLUSIONS AND EXCLUSIONS
    1.5 CURRENCY CONSIDERED 
           TABLE 2 USD EXCHANGE RATES, 2021–2023
    1.6 STAKEHOLDERS 
    1.7 SUMMARY OF CHANGES 
           1.7.1 RECESSION IMPACT
 
2 RESEARCH METHODOLOGY (Page No. - 29)
    2.1 RESEARCH DATA 
           FIGURE 2 RESEARCH DESIGN
           2.1.1 SECONDARY DATA
                    2.1.1.1 Secondary sources
           2.1.2 PRIMARY DATA
                    2.1.2.1 Breakup of primary interviews
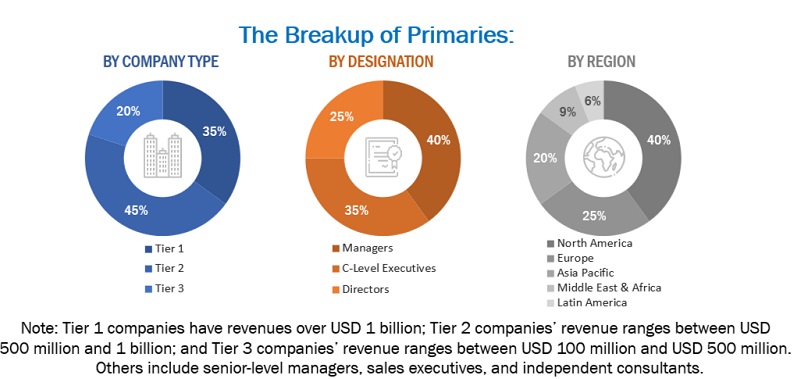
                               FIGURE 3 BREAKDOWN OF PRIMARY INTERVIEWS: BY COMPANY TYPE, DESIGNATION, AND REGION
                    2.1.2.2 Key primary interview participants
                               TABLE 3 KEY PRIMARY INTERVIEW PARTICIPANTS
                    2.1.2.3 Key industry insights
    2.2 DATA TRIANGULATION 
    2.3 MARKET SIZE ESTIMATION METHODOLOGY 
           2.3.1 TOP-DOWN APPROACH
                    FIGURE 4 TOP-DOWN APPROACH
                    2.3.1.1 Demand-side analysis
                               FIGURE 5 DEMAND-SIDE ANALYSIS
           2.3.2 BOTTOM-UP APPROACH
                    FIGURE 6 BOTTOM-UP APPROACH
                    FIGURE 7 BOTTOM-UP (SUPPLY SIDE) ANALYSIS: COLLECTIVE REVENUE FROM SOLUTIONS/SERVICES OF RAILWAY MANAGEMENT SYSTEM MARKET
    2.4 RESEARCH ASSUMPTIONS 
           TABLE 4 RESEARCH ASSUMPTIONS
    2.5 RESEARCH LIMITATIONS 
    2.6 RISK ASSESSMENT 
           TABLE 5 RISK ASSESSMENT
 
3 EXECUTIVE SUMMARY (Page No. - 39)
    FIGURE 8 RAILWAY MANAGEMENT SYSTEM MARKET, 2022–2029 (USD MILLION) 
    FIGURE 9 RAILWAY MANAGEMENT SYSTEM MARKET: REGIONAL SNAPSHOT 
 
4 PREMIUM INSIGHTS (Page No. - 42)
    4.1 ATTRACTIVE OPPORTUNITIES FOR PLAYERS IN RAILWAY MANAGEMENT SYSTEM MARKET 
           FIGURE 10 ONGOING TECHNOLOGICAL ADVANCEMENTS AND GOVERNMENT-LED INITIATIVES TO DRIVE MARKET
    4.2 RAILWAY MANAGEMENT SYSTEM MARKET, BY OFFERING 
           FIGURE 11 SOLUTIONS SEGMENT TO LEAD MARKET IN 2024
    4.3 RAILWAY MANAGEMENT SYSTEM MARKET, BY SOLUTIONS 
           FIGURE 12 RAIL TRAFFIC MANAGEMENT SYSTEMS SEGMENT TO DOMINATE MARKET DURING FORECAST PERIOD
    4.4 NORTH AMERICA: RAILWAY MANAGEMENT SYSTEM MARKET, BY OFFERING AND COUNTRY 
           FIGURE 13 SOLUTIONS SEGMENT AND US TO ACCOUNT FOR LARGEST MARKET SHARES IN 2024
 
5 MARKET OVERVIEW AND INDUSTRY TRENDS (Page No. - 44)
    5.1 INTRODUCTION 
           FIGURE 14 RAILWAY MANAGEMENT SYSTEM MARKET: DRIVERS, RESTRAINTS, OPPORTUNITIES, AND CHALLENGES
           5.1.1 DRIVERS
                    5.1.1.1 Exponential population growth and hyper-urbanization
                    5.1.1.2 Favorable government initiatives and public-private partnerships
                               TABLE 6 PUBLIC-PRIVATE PARTNERSHIPS IN RAILROAD INFRASTRUCTURE PROJECTS
                    5.1.1.3 Need for efficient rail operations
                    5.1.1.4 Evolving Internet of Things and other automation technologies
                    5.1.1.5 Aging railway infrastructure
           5.1.2 RESTRAINTS
                    5.1.2.1 High initial cost of deployment
                    5.1.2.2 Political and socio-economic factors
           5.1.3 OPPORTUNITIES
                    5.1.3.1 Integration of intelligent solutions in transportation infrastructure
                    5.1.3.2 Increased demand for cloud-based services
           5.1.4 CHALLENGES
                    5.1.4.1 Heavy reliance on legacy systems
                    5.1.4.2 Data security and privacy issues
                    5.1.4.3 Stringent safety and regulatory standards
    5.2 BRIEF HISTORY OF RAILWAY MANAGEMENT SYSTEM TECHNOLOGY 
           FIGURE 15 BRIEF HISTORY OF RAILWAY MANAGEMENT SYSTEM TECHNOLOGY
           5.2.1 EARLY 1800S
           5.2.2 LATE 1800S–EARLY 1900S
           5.2.3 MID-1900S
           5.2.4 LATE 1900S–EARLY 2000S
           5.2.5 2000S–PRESENT
    5.3 ECOSYSTEM ANALYSIS 
           FIGURE 16 ECOSYSTEM ANALYSIS
           TABLE 7 ROLE OF COMPANIES IN ECOSYSTEM
    5.4 INVESTMENT AND FUNDING SCENARIO 
           FIGURE 17 INVESTMENT AND FUNDING SCENARIO, 2020–2024
    5.5 CASE STUDY ANALYSIS 
           5.5.1 IMPROVED RAIL INFRASTRUCTURE USING ADVANCED SMART ANALYTIC PROGRAM
           5.5.2 INTELLIGENT INSPECTION THROUGH TRAIN FAULT DETECTION SYSTEM PROJECT
           5.5.3 INTEGRATION OF DIGITAL CAPABILITIES FOR RAILWAY FLEET MANAGEMENT
           5.5.4 ENHANCED ASSET MANAGEMENT PRACTICES WITH TRACKASSET
           5.5.5 UTILIZATION OF RAILIGENT SOLUTION FOR RRX RAIL TRANSPORT
    5.6 VALUE CHAIN ANALYSIS 
           FIGURE 18 RAILWAY MANAGEMENT SYSTEM MARKET: VALUE CHAIN ANALYSIS
    5.7 REGULATORY LANDSCAPE 
           5.7.1 REGULATORY BODIES, GOVERNMENT AGENCIES, AND OTHER ORGANIZATIONS
                    TABLE 8 NORTH AMERICA: REGULATORY BODIES, GOVERNMENT AGENCIES, AND OTHER ORGANIZATIONS
                    TABLE 9 EUROPE: REGULATORY BODIES, GOVERNMENT AGENCIES, AND OTHER ORGANIZATIONS
                    TABLE 10 ASIA PACIFIC: REGULATORY BODIES, GOVERNMENT AGENCIES, AND OTHER ORGANIZATIONS
                    TABLE 11 MIDDLE EAST & AFRICA: REGULATORY BODIES, GOVERNMENT AGENCIES, AND OTHER ORGANIZATIONS
                    TABLE 12 LATIN AMERICA: REGULATORY BODIES, GOVERNMENT AGENCIES, AND OTHER ORGANIZATIONS
    5.8 PATENT ANALYSIS 
           FIGURE 19 PATENT ANALYSIS, 2014–2023
           TABLE 13 INNOVATIONS AND PATENT REGISTRATIONS, 2021–2024
    5.9 PRICING ANALYSIS 
           5.9.1 AVERAGE SELLING PRICE TREND, BY REGION
                    FIGURE 20 AVERAGE SELLING PRICE TREND, BY REGION
           5.9.2 INDICATIVE PRICING ANALYSIS OF KEY PLAYERS, BY SYSTEM
                    TABLE 14 INDICATIVE PRICING ANALYSIS OF RAILWAY MANAGEMENT SYSTEM, BY SYSTEM
    5.10 PORTER’S FIVE FORCES ANALYSIS 
           FIGURE 21 PORTER’S FIVE FORCES ANALYSIS
           TABLE 15 IMPACT OF PORTER’S FIVE FORCES
           5.10.1 THREAT OF NEW ENTRANTS
           5.10.2 THREAT OF SUBSTITUTES
           5.10.3 BARGAINING POWER OF SUPPLIERS
           5.10.4 BARGAINING POWER OF BUYERS
           5.10.5 INTENSITY OF COMPETITIVE RIVALRY
    5.11 TRENDS AND DISRUPTIONS IMPACTING CUSTOMER BUSINESS 
                    FIGURE 22 TRENDS AND DISRUPTIONS IMPACTING CUSTOMER BUSINESS
    5.12 KEY STAKEHOLDERS AND BUYING CRITERIA 
           5.12.1 KEY STAKEHOLDERS IN BUYING PROCESS
                    FIGURE 23 INFLUENCE OF STAKEHOLDERS ON BUYING PROCESS, BY TOP THREE SOLUTIONS
                    TABLE 16 INFLUENCE OF STAKEHOLDERS ON BUYING PROCESS, BY TOP THREE SOLUTIONS (%)
           5.12.2 BUYING CRITERIA
                    FIGURE 24 KEY BUYING CRITERIA
                    TABLE 17 KEY BUYING CRITERIA FOR TOP THREE SOLUTIONS
    5.13 KEY CONFERENCES AND EVENTS 
                    TABLE 18 RAILWAY MANAGEMENT SYSTEM MARKET: KEY CONFERENCES AND EVENTS, 2024
    5.14 TECHNOLOGY ANALYSIS 
           5.14.1 KEY TECHNOLOGIES
                    5.14.1.1 Geographic information systems
                    5.14.1.2 Internet of Things
                    5.14.1.3 Big data analytics
                    5.14.1.4 Artificial intelligence and machine learning
                    5.14.1.5 Advanced communication systems
                    5.14.1.6 Encryption and tokenization
           5.14.2 ADJACENT TECHNOLOGIES
                    5.14.2.1 Cloud computing
                    5.14.2.2 Augmented reality and virtual reality
           5.14.3 COMPLEMENTARY TECHNOLOGIES
                    5.14.3.1 Blockchain
                    5.14.3.2 Robotics and automation
    5.15 BEST PRACTICES IN RAILWAY MANAGEMENT SYSTEM MARKET 
           5.15.1 COMPLIANCE WITH INDUSTRY STANDARDS
           5.15.2 MODULAR AND SCALABLE ARCHITECTURE
           5.15.3 USER-CENTRIC DESIGN
           5.15.4 REAL-TIME MONITORING AND ANALYTICS
           5.15.5 ROBUST SECURITY MEASURES
           5.15.6 INTEROPERABILITY OF NEW SYSTEMS WITH EXISTING RAILWAY INFRASTRUCTURE
           5.15.7 CONTINUOUS TRAINING AND SUPPORT
           5.15.8 REGULAR MAINTENANCE AND UPDATES
           5.15.9 COLLABORATIONS AND PARTNERSHIPS
    5.16 CURRENT AND EMERGING BUSINESS MODELS 
           5.16.1 PERPETUAL LICENSE AND MAINTENANCE
           5.16.2 SUBSCRIPTION-BASED MODEL
           5.16.3 MANAGED SERVICES
           5.16.4 HYBRID MODEL
           5.16.5 OUTCOME-BASED MODEL
           5.16.6 DATA-AS-A-SERVICE
           5.16.7 PLATFORM-AS-A-SERVICE
           5.16.8 PARTNERSHIPS WITH TECHNOLOGY COMPANIES
    5.17 RAILWAY MANAGEMENT SYSTEM TOOLS, FRAMEWORKS, AND TECHNIQUES 
    5.18 FUTURE LANDSCAPE OF RAILWAY MANAGEMENT SYSTEM MARKET 
           5.18.1 SHORT-TERM ROADMAP
           5.18.2 MID-TERM ROADMAP
           5.18.3 LONG-TERM ROADMAP
 
6 RAILWAY MANAGEMENT SYSTEM MARKET, BY OFFERING (Page No. - 74)
    6.1 INTRODUCTION 
           FIGURE 25 RAILWAY MANAGEMENT SYSTEM MARKET, BY OFFERING, 2024–2029 (USD MILLION)
           6.1.1 MARKET DRIVERS
                    TABLE 19 RAILWAY MANAGEMENT SYSTEM MARKET, BY OFFERING, 2018–2023 (USD MILLION)
                    TABLE 20 RAILWAY MANAGEMENT SYSTEM MARKET, BY OFFERING, 2024–2029 (USD MILLION)
    6.2 SOLUTIONS 
           FIGURE 26 RAIL TRAFFIC MANAGEMENT SYSTEM MARKET, BY SOLUTIONS, 2024–2029 (USD MILLION)
           TABLE 21 RAILWAY MANAGEMENT SYSTEM MARKET, BY SOLUTIONS, 2018–2023 (USD MILLION)
           TABLE 22 RAILWAY MANAGEMENT SYSTEM MARKET, BY SOLUTIONS, 2024–2029 (USD MILLION)
           TABLE 23 SOLUTIONS: RAILWAY MANAGEMENT SYSTEM MARKET, BY REGION, 2018–2023 (USD MILLION)
           TABLE 24 SOLUTIONS: RAILWAY MANAGEMENT SYSTEM MARKET, BY REGION, 2024–2029 (USD MILLION)
           6.2.1 RAIL OPERATIONS MANAGEMENT
                    6.2.1.1 Need for smooth, uninterrupted routine operations to drive market
                               TABLE 25 RAIL OPERATIONS MANAGEMENT: RAIL MANAGEMENT SYSTEM MARKET, BY REGION, 2018–2023 (USD MILLION)
                               TABLE 26 RAIL OPERATIONS MANAGEMENT: RAIL MANAGEMENT SYSTEM MARKET, BY REGION, 2024–2029 (USD MILLION)
           6.2.2 RAIL TRAFFIC MANAGEMENT
                    TABLE 27 RAIL TRAFFIC MANAGEMENT: RAILWAY MANAGEMENT SYSTEM MARKET, BY REGION, 2018–2023 (USD MILLION)
                    TABLE 28 RAIL TRAFFIC MANAGEMENT: RAILWAY MANAGEMENT SYSTEM MARKET, BY REGION, 2024–2029 (USD MILLION)
                    6.2.2.1 Signaling solutions
                               6.2.2.1.1 Increasing focus on disaster management and loss minimization to drive market
                    6.2.2.2 Real-time train planning and route scheduling/optimizing
                               6.2.2.2.1 Rising need for improved workflow management and timetable planning to drive market
                    6.2.2.3 Centralized traffic control
                               6.2.2.3.1 Growing emphasis on collecting crucial real-time information about traffic density to drive market
                    6.2.2.4 Positive train control
                               6.2.2.4.1 Surge in use of GPS-based safety technology to drive market
                    6.2.2.5 Rail communications-based train control
                               6.2.2.5.1 Increasing demand for mass transit transport to drive market
                               6.2.2.5.2 Other traffic management solutions
           6.2.3 ASSET MANAGEMENT
                    TABLE 29 ASSET MANAGEMENT: RAILWAY MANAGEMENT SYSTEM MARKET, BY REGION, 2018–2023 (USD MILLION)
                    TABLE 30 ASSET MANAGEMENT: RAILWAY MANAGEMENT SYSTEM MARKET, BY REGION, 2024–2029 (USD MILLION)
                    6.2.3.1 Enterprise asset management
                               6.2.3.1.1 Rising inclination toward centralized asset inventory management to drive market
                    6.2.3.2 Field service management
                               6.2.3.2.1 Increasing need for optimized workforce allocation to drive market
                    6.2.3.3 Asset performance management
                               6.2.3.3.1 Growing focus on monitoring equipment health to drive market
                               6.2.3.3.2 Other asset management systems
           6.2.4 INTELLIGENT IN-TRAIN SOLUTIONS
                    6.2.4.1 Increasing demand for enhanced passenger experience to drive market
                               TABLE 31 INTELLIGENT IN-TRAIN SOLUTIONS: RAILWAY MANAGEMENT SYSTEM MARKET, BY REGION, 2018–2023 (USD MILLION)
                               TABLE 32 INTELLIGENT IN-TRAIN SOLUTIONS: RAILWAY MANAGEMENT SYSTEM MARKET, BY REGION, 2024–2029 (USD MILLION)
           6.2.5 OTHER SOLUTIONS
                    TABLE 33 OTHER SOLUTIONS: RAILWAY MANAGEMENT SYSTEM MARKET, BY REGION, 2018–2023 (USD MILLION)
                    TABLE 34 OTHER SOLUTIONS: RAILWAY MANAGEMENT SYSTEM MARKET, BY REGION, 2024–2029 (USD MILLION)
    6.3 SERVICES 
           FIGURE 27 RAIL TRAFFIC MANAGEMENT SYSTEM MARKET, BY SERVICES, 2024–2029 (USD MILLION)
           TABLE 35 RAILWAY MANAGEMENT SYSTEM MARKET, BY SERVICES, 2018–2023 (USD MILLION)
           TABLE 36 RAILWAY MANAGEMENT SYSTEM MARKET, BY SERVICES, 2024–2029 (USD MILLION)
           TABLE 37 SERVICES: RAILWAY MANAGEMENT SYSTEM MARKET, BY REGION, 2018–2023 (USD MILLION)
           TABLE 38 SERVICES: RAILWAY MANAGEMENT SYSTEM MARKET, BY REGION, 2024–2029 (USD MILLION)
           6.3.1 CONSULTING
                    6.3.1.1 Growing shift toward smart railway infrastructure to drive market
                               TABLE 39 CONSULTING: RAILWAY MANAGEMENT SYSTEM MARKET, BY REGION, 2018–2023 (USD MILLION)
                               TABLE 40 CONSULTING: RAILWAY MANAGEMENT SYSTEM MARKET, BY REGION, 2024–2029 (USD MILLION)
           6.3.2 SYSTEM INTEGRATION AND DEPLOYMENT
                    6.3.2.1 Rising demand for cost-effective systems with minimal deployment-related disruptions to drive market
                               TABLE 41 SYSTEM INTEGRATION AND DEPLOYMENT: RAILWAY MANAGEMENT SYSTEM MARKET, BY REGION, 2018–2023 (USD MILLION)
                               TABLE 42 SYSTEM INTEGRATION AND DEPLOYMENT: RAILWAY MANAGEMENT SYSTEM MARKET, BY REGION, 2024–2029 (USD MILLION)
           6.3.3 SUPPORT & MAINTENANCE
                    6.3.3.1 Need for troubleshooting assistance and repairing components to drive market
                               TABLE 43 SUPPORT & MAINTENANCE: RAILWAY MANAGEMENT SYSTEM MARKET, BY REGION, 2018–2023 (USD MILLION)
                               TABLE 44 SUPPORT & MAINTENANCE: RAILWAY MANAGEMENT SYSTEM MARKET, BY REGION, 2024–2029 (USD MILLION)
 
7 RAILWAY MANAGEMENT SYSTEM MARKET, BY REGION (Page No. - 92)
    7.1 INTRODUCTION 
           FIGURE 28 RAILWAY MANAGEMENT SYSTEM MARKET, BY REGION, 2024–2029
           TABLE 45 RAILWAY MANAGEMENT SYSTEM MARKET, BY REGION, 2018–2023 (USD MILLION)
           TABLE 46 RAILWAY MANAGEMENT SYSTEM MARKET, BY REGION, 2024–2029 (USD MILLION)
    7.2 NORTH AMERICA 
           7.2.1 MARKET DRIVERS
           7.2.2 RECESSION IMPACT ANALYSIS
                    TABLE 47 NORTH AMERICA: RAILWAY MANAGEMENT SYSTEM MARKET, BY OFFERING, 2018–2023 (USD MILLION)
                    TABLE 48 NORTH AMERICA: RAILWAY MANAGEMENT SYSTEM MARKET, BY OFFERING, 2024–2029 (USD MILLION)
                    TABLE 49 NORTH AMERICA: RAILWAY MANAGEMENT SYSTEM MARKET, BY SOLUTIONS, 2018–2023 (USD MILLION)
                    TABLE 50 NORTH AMERICA: RAILWAY MANAGEMENT SYSTEM MARKET, BY SOLUTIONS, 2024–2029 (USD MILLION)
                    TABLE 51 NORTH AMERICA: RAILWAY MANAGEMENT SYSTEM MARKET, BY SERVICES, 2018–2023 (USD MILLION)
                    TABLE 52 NORTH AMERICA: RAILWAY MANAGEMENT SYSTEM MARKET, BY SERVICES, 2024–2029 (USD MILLION)
                    TABLE 53 NORTH AMERICA: RAILWAY MANAGEMENT SYSTEM MARKET, BY COUNTRY, 2018–2023 (USD MILLION)
                    TABLE 54 NORTH AMERICA: RAILWAY MANAGEMENT SYSTEM MARKET, BY COUNTRY, 2024–2029 (USD MILLION)
           7.2.3 US
                    7.2.3.1 Favorable government initiatives to drive market
                               TABLE 55 US: RAILWAY MANAGEMENT SYSTEM MARKET, BY OFFERING, 2018–2023 (USD MILLION)
                               TABLE 56 US: RAILWAY MANAGEMENT SYSTEM MARKET, BY OFFERING, 2024–2029 (USD MILLION)
                               TABLE 57 US: RAILWAY MANAGEMENT SYSTEM MARKET, BY SOLUTIONS, 2018–2023 (USD MILLION)
                               TABLE 58 US: RAILWAY MANAGEMENT SYSTEM MARKET, BY SOLUTIONS, 2024–2029 (USD MILLION)
                               TABLE 59 US: RAILWAY MANAGEMENT SYSTEM MARKET, BY SERVICES, 2018–2023 (USD MILLION)
                               TABLE 60 US: RAILWAY MANAGEMENT SYSTEM MARKET, BY SERVICES, 2024–2029 (USD MILLION)
           7.2.4 CANADA
                    7.2.4.1 Growing capital investments to drive market
    7.3 EUROPE 
           7.3.1 MARKET DRIVERS
           7.3.2 RECESSION IMPACT ANALYSIS
                    FIGURE 29 EUROPE: RAILWAY MANAGEMENT SYSTEM MARKET SNAPSHOT
                    TABLE 61 EUROPE: RAILWAY MANAGEMENT SYSTEM MARKET, BY OFFERING, 2018–2023 (USD MILLION)
                    TABLE 62 EUROPE: RAILWAY MANAGEMENT SYSTEM MARKET, BY OFFERING, 2024–2029 (USD MILLION)
                    TABLE 63 EUROPE: RAILWAY MANAGEMENT SYSTEM MARKET, BY SOLUTIONS, 2018–2023 (USD MILLION)
                    TABLE 64 EUROPE: RAILWAY MANAGEMENT SYSTEM MARKET, BY SOLUTIONS, 2024–2029 (USD MILLION)
                    TABLE 65 EUROPE: RAILWAY MANAGEMENT SYSTEM MARKET, BY SERVICES, 2018–2023 (USD MILLION)
                    TABLE 66 EUROPE: RAILWAY MANAGEMENT SYSTEM MARKET, BY SERVICES, 2024–2029 (USD MILLION)
                    TABLE 67 EUROPE: RAILWAY MANAGEMENT SYSTEM MARKET, BY COUNTRY, 2018–2023 (USD MILLION)
                    TABLE 68 EUROPE: RAILWAY MANAGEMENT SYSTEM MARKET, BY COUNTRY, 2024–2029 (USD MILLION)
           7.3.3 UK
                    7.3.3.1 Increasing emphasis on improving infrastructure to drive market
                               TABLE 69 UK: RAILWAY MANAGEMENT SYSTEM MARKET, BY OFFERING, 2018–2023 (USD MILLION)
                               TABLE 70 UK: RAILWAY MANAGEMENT SYSTEM MARKET, BY OFFERING, 2024–2029 (USD MILLION)
                               TABLE 71 UK: RAILWAY MANAGEMENT SYSTEM MARKET, BY SOLUTIONS, 2018–2023 (USD MILLION)
                               TABLE 72 UK: RAILWAY MANAGEMENT SYSTEM MARKET, BY SOLUTIONS, 2024–2029 (USD MILLION)
                               TABLE 73 UK: RAILWAY MANAGEMENT SYSTEM MARKET, BY SERVICES, 2018–2023 (USD MILLION)
                               TABLE 74 UK: RAILWAY MANAGEMENT SYSTEM MARKET, BY SERVICES, 2024–2029 (USD MILLION)
           7.3.4 GERMANY
                    7.3.4.1 Rising number of electrified tracks and rail modernization efforts to drive market
           7.3.5 FRANCE
                    7.3.5.1 Surge in liberalization efforts to drive market
           7.3.6 ITALY
                    7.3.6.1 Increasing emphasis on carbon neutrality efforts to drive market
           7.3.7 SPAIN
                    7.3.7.1 Growing adoption of European Rail Traffic Management System to drive market
           7.3.8 REST OF EUROPE
    7.4 ASIA PACIFIC 
           7.4.1 MARKET DRIVERS
           7.4.2 RECESSION IMPACT ANALYSIS
                    FIGURE 30 ASIA PACIFIC: RAILWAY MANAGEMENT SYSTEM MARKET SNAPSHOT
                    TABLE 75 ASIA PACIFIC: RAILWAY MANAGEMENT SYSTEM MARKET, BY OFFERING, 2018–2023 (USD MILLION)
                    TABLE 76 ASIA PACIFIC: RAILWAY MANAGEMENT SYSTEM MARKET, BY OFFERING, 2024–2029 (USD MILLION)
                    TABLE 77 ASIA PACIFIC: RAILWAY MANAGEMENT SYSTEM MARKET, BY SOLUTIONS, 2018–2023 (USD MILLION)
                    TABLE 78 ASIA PACIFIC: RAILWAY MANAGEMENT SYSTEM MARKET, BY SOLUTIONS, 2024–2029 (USD MILLION)
                    TABLE 79 ASIA PACIFIC: RAILWAY MANAGEMENT SYSTEM MARKET, BY SERVICES, 2018–2023 (USD MILLION)
                    TABLE 80 ASIA PACIFIC: RAILWAY MANAGEMENT SYSTEM MARKET, BY SERVICES, 2024–2029 (USD MILLION)
                    TABLE 81 ASIA PACIFIC: RAILWAY MANAGEMENT SYSTEM MARKET, BY COUNTRY, 2018–2023 (USD MILLION)
                    TABLE 82 ASIA PACIFIC: RAILWAY MANAGEMENT SYSTEM MARKET, BY COUNTRY, 2024–2029 (USD MILLION)
           7.4.3 CHINA
                    7.4.3.1 Booming Belt and Road Initiative to drive market
                               TABLE 83 CHINA: RAILWAY MANAGEMENT SYSTEM MARKET, BY OFFERING, 2018–2023 (USD MILLION)
                               TABLE 84 CHINA: RAILWAY MANAGEMENT SYSTEM MARKET, BY OFFERING, 2024–2029 (USD MILLION)
                               TABLE 85 CHINA: RAILWAY MANAGEMENT SYSTEM MARKET, BY SOLUTIONS, 2018–2023 (USD MILLION)
                               TABLE 86 CHINA: RAILWAY MANAGEMENT SYSTEM MARKET, BY SOLUTIONS, 2024–2029 (USD MILLION)
                               TABLE 87 CHINA: RAILWAY MANAGEMENT SYSTEM MARKET, BY SERVICES, 2018–2023 (USD MILLION)
                               TABLE 88 CHINA: RAILWAY MANAGEMENT SYSTEM MARKET, BY SERVICES, 2024–2029 (USD MILLION)
           7.4.4 JAPAN
                    7.4.4.1 Rising focus on diversified revenue streams to drive market
           7.4.5 INDIA
                    7.4.5.1 Increasing development of high-speed rail network to drive market
           7.4.6 AUSTRALIA & NEW ZEALAND
                    7.4.6.1 Growing focus on Cross River Rail and Inland Rail projects to drive market
           7.4.7 REST OF ASIA PACIFIC
    7.5 MIDDLE EAST & AFRICA 
           7.5.1 MARKET DRIVERS
           7.5.2 RECESSION IMPACT ANALYSIS
                    TABLE 89 MIDDLE EAST & AFRICA: RAILWAY MANAGEMENT SYSTEM MARKET, BY OFFERING, 2018–2023 (USD MILLION)
                    TABLE 90 MIDDLE EAST & AFRICA: RAILWAY MANAGEMENT SYSTEM MARKET, BY OFFERING, 2024–2029 (USD MILLION)
                    TABLE 91 MIDDLE EAST & AFRICA: RAILWAY MANAGEMENT SYSTEM MARKET, BY SOLUTIONS, 2018–2023 (USD MILLION)
                    TABLE 92 MIDDLE EAST & AFRICA: RAILWAY MANAGEMENT SYSTEM MARKET, BY SOLUTIONS, 2024–2029 (USD MILLION)
                    TABLE 93 MIDDLE EAST & AFRICA: RAILWAY MANAGEMENT SYSTEM MARKET, BY SERVICES, 2018–2023 (USD MILLION)
                    TABLE 94 MIDDLE EAST & AFRICA: RAILWAY MANAGEMENT SYSTEM MARKET, BY SERVICES, 2024–2029 (USD MILLION)
                    TABLE 95 MIDDLE EAST & AFRICA: RAILWAY MANAGEMENT SYSTEM MARKET, BY COUNTRY, 2018–2023 (USD MILLION)
                    TABLE 96 MIDDLE EAST & AFRICA: RAILWAY MANAGEMENT SYSTEM MARKET, BY COUNTRY, 2024–2029 (USD MILLION)
           7.5.3 GCC COUNTRIES
                    TABLE 97 GCC COUNTRIES: RAILWAY MANAGEMENT SYSTEM MARKET, BY OFFERING, 2018–2023 (USD MILLION)
                    TABLE 98 GCC COUNTRIES: RAILWAY MANAGEMENT SYSTEM MARKET, BY OFFERING, 2024–2029 (USD MILLION)
                    TABLE 99 GCC COUNTRIES: RAILWAY MANAGEMENT SYSTEM MARKET, BY SOLUTIONS, 2018–2023 (USD MILLION)
                    TABLE 100 GCC COUNTRIES: RAILWAY MANAGEMENT SYSTEM MARKET, BY SOLUTIONS, 2024–2029 (USD MILLION)
                    TABLE 101 GCC COUNTRIES: RAILWAY MANAGEMENT SYSTEM MARKET, BY SERVICES, 2018–2023 (USD MILLION)
                    TABLE 102 GCC COUNTRIES: RAILWAY MANAGEMENT SYSTEM MARKET, BY SERVICES, 2024–2029 (USD MILLION)
                    TABLE 103 MIDDLE EAST & AFRICA: RAILWAY MANAGEMENT SYSTEM MARKET, BY GCC COUNTRIES, 2018–2023 (USD MILLION)
                    TABLE 104 MIDDLE EAST & AFRICA: RAILWAY MANAGEMENT SYSTEM MARKET, BY GCC COUNTRIES, 2024–2029 (USD MILLION)
                    7.5.3.1 KSA
                               7.5.3.1.1 Growing focus on Cross River Rail and Inland Rail projects to drive market
                    7.5.3.2 UAE
                               7.5.3.2.1 Increasing number of logistics and fleet transport companies to drive market
                    7.5.3.3 Rest of GCC countries
           7.5.4 SOUTH AFRICA
                    7.5.4.1 Growing adoption of IoT and cloud technologies to drive market
           7.5.5 REST OF MIDDLE EAST & AFRICA
    7.6 LATIN AMERICA 
           7.6.1 MARKET DRIVERS
           7.6.2 RECESSION IMPACT ANALYSIS
                    TABLE 105 LATIN AMERICA: RAILWAY MANAGEMENT SYSTEM MARKET, BY OFFERING, 2018–2023 (USD MILLION)
                    TABLE 106 LATIN AMERICA: RAILWAY MANAGEMENT SYSTEM MARKET, BY OFFERING, 2024–2029 (USD MILLION)
                    TABLE 107 LATIN AMERICA: RAILWAY MANAGEMENT SYSTEM MARKET, BY SOLUTIONS, 2018–2023 (USD MILLION)
                    TABLE 108 LATIN AMERICA: RAILWAY MANAGEMENT SYSTEM MARKET, BY SOLUTIONS, 2024–2029 (USD MILLION)
                    TABLE 109 LATIN AMERICA: RAILWAY MANAGEMENT SYSTEM MARKET, BY SERVICES, 2018–2023 (USD MILLION)
                    TABLE 110 LATIN AMERICA: RAILWAY MANAGEMENT SYSTEM MARKET, BY SERVICES, 2024–2029 (USD MILLION)
                    TABLE 111 LATIN AMERICA: RAILWAY MANAGEMENT SYSTEM MARKET, BY COUNTRY, 2018–2023 (USD MILLION)
                    TABLE 112 LATIN AMERICA: RAILWAY MANAGEMENT SYSTEM MARKET, BY COUNTRY, 2024–2029 (USD MILLION)
           7.6.3 BRAZIL
                    7.6.3.1 Surge in information technology infrastructure development and upgrades to drive market
                               TABLE 113 BRAZIL: RAILWAY MANAGEMENT SYSTEM MARKET, BY OFFERING, 2018–2023 (USD MILLION)
                               TABLE 114 BRAZIL: RAILWAY MANAGEMENT SYSTEM MARKET, BY OFFERING, 2024–2029 (USD MILLION)
                               TABLE 115 BRAZIL: RAILWAY MANAGEMENT SYSTEM MARKET, BY SOLUTIONS, 2018–2023 (USD MILLION)
                               TABLE 116 BRAZIL: RAILWAY MANAGEMENT SYSTEM MARKET, BY SOLUTIONS, 2024–2029 (USD MILLION)
                               TABLE 117 BRAZIL: RAILWAY MANAGEMENT SYSTEM MARKET, BY SERVICES, 2018–2023 (USD MILLION)
                               TABLE 118 BRAZIL: RAILWAY MANAGEMENT SYSTEM MARKET, BY SERVICES, 2024–2029 (USD MILLION)
           7.6.4 MEXICO
                    7.6.4.1 Rising focus on Tren Maya railway project to drive market
           7.6.5 REST OF LATIN AMERICA
 
8 COMPETITIVE LANDSCAPE (Page No. - 132)
    8.1 OVERVIEW 
    8.2 KEY PLAYER STRATEGIES 
           TABLE 119 KEY PLAYER STRATEGIES
    8.3 REVENUE ANALYSIS 
           FIGURE 31 REVENUE ANALYSIS OF KEY PLAYERS, 2018–2022 (USD MILLION)
    8.4 MARKET SHARE ANALYSIS 
           TABLE 120 RAILWAY MANAGEMENT SYSTEM MARKET: DEGREE OF COMPETITION, 2023
           FIGURE 32 MARKET SHARE ANALYSIS, 2023
           8.4.1 RANKING ANALYSIS
                    FIGURE 33 RANKING ANALYSIS OF TOP FIVE PLAYERS
    8.5 COMPANY EVALUATION MATRIX: KEY PLAYERS, 2023 
           8.5.1 STARS
           8.5.2 EMERGING LEADERS
           8.5.3 PERVASIVE PLAYERS
           8.5.4 PARTICIPANTS
                    FIGURE 34 RAILWAY MANAGEMENT SYSTEM MARKET: COMPANY EVALUATION MATRIX (KEY PLAYERS), 2023
           8.5.5 COMPANY FOOTPRINT
                    TABLE 121 RAILWAY MANAGEMENT SYSTEM MARKET: COMPANY FOOTPRINT
                    TABLE 122 RAILWAY MANAGEMENT SYSTEM MARKET: REGION FOOTPRINT
                    TABLE 123 RAILWAY MANAGEMENT SYSTEM MARKET: OFFERING FOOTPRINT
                    TABLE 124 RAILWAY MANAGEMENT SYSTEM MARKET: SOLUTIONS FOOTPRINT
    8.6 COMPANY EVALUATION MATRIX: STARTUPS/SMES, 2023 
           8.6.1 PROGRESSIVE COMPANIES
           8.6.2 RESPONSIVE COMPANIES
           8.6.3 DYNAMIC COMPANIES
           8.6.4 STARTING BLOCKS
                    FIGURE 35 RAILWAY MANAGEMENT SYSTEM MARKET: COMPANY EVALUATION MATRIX (STARTUPS/SMES), 2023
           8.6.5 COMPETITIVE BENCHMARKING
                    TABLE 125 RAILWAY MANAGEMENT SYSTEM MARKET: KEY STARTUPS/SMES
                    TABLE 126 RAILWAY MANAGEMENT SYSTEM MARKET: COMPETITIVE BENCHMARKING OF KEY STARTUPS/SMES
    8.7 COMPETITIVE SCENARIOS AND TRENDS 
           8.7.1 PRODUCT LAUNCHES
                    TABLE 127 RAILWAY MANAGEMENT SYSTEM MARKET: PRODUCT LAUNCHES, JANUARY 2021–MARCH 2024
           8.7.2 DEALS
                    TABLE 128 RAILWAY MANAGEMENT SYSTEM MARKET: DEALS, JANUARY 2021–MARCH 2024
    8.8 BRAND/PRODUCT COMPARISON 
           FIGURE 36 BRAND/PRODUCT COMPARISON
    8.9 COMPANY VALUATION AND FINANCIAL METRICS 
           FIGURE 37 COMPANY VALUATION AND FINANCIAL METRICS
 
9 COMPANY PROFILES (Page No. - 155)
    9.1 MAJOR PLAYERS 
(Business Overview, Products/Solutions/Services offered, Recent Developments, MnM View)*
           9.1.1 ALSTOM SA
                    TABLE 129 ALSTOM SA: COMPANY OVERVIEW
                    FIGURE 38 ALSTOM SA: COMPANY SNAPSHOT
                    TABLE 130 ALSTOM SA: PRODUCTS/SOLUTIONS/SERVICES OFFERED
                    TABLE 131 ALSTOM SA: EXPANSIONS
                    TABLE 132 ALSTOM SA: DEALS
           9.1.2 HUAWEI TECHNOLOGIES CO., LTD.
                    TABLE 133 HUAWEI TECHNOLOGIES CO., LTD.: COMPANY OVERVIEW
                    FIGURE 39 HUAWEI TECHNOLOGIES CO., LTD.: COMPANY SNAPSHOT
                    TABLE 134 HUAWEI TECHNOLOGIES CO., LTD.: PRODUCTS/SOLUTIONS/SERVICES OFFERED
                    TABLE 135 HUAWEI TECHNOLOGIES CO., LTD.: PRODUCT LAUNCHES
           9.1.3 SIEMENS
                    TABLE 136 SIEMENS: COMPANY OVERVIEW
                    FIGURE 40 SIEMENS: COMPANY SNAPSHOT
                    TABLE 137 SIEMENS: PRODUCTS/SOLUTIONS/SERVICES OFFERED
                    TABLE 138 SIEMENS: PRODUCT LAUNCHES
                    TABLE 139 SIEMENS: DEALS
           9.1.4 HITACHI, LTD.
                    TABLE 140 HITACHI, LTD.: COMPANY OVERVIEW
                    FIGURE 41 HITACHI, LTD.: COMPANY SNAPSHOT
                    TABLE 141 HITACHI, LTD.: PRODUCTS/SOLUTIONS/SERVICES OFFERED
                    TABLE 142 HITACHI, LTD.: PRODUCT LAUNCHES
                    TABLE 143 HITACHI, LTD.: DEALS
                    TABLE 144 HITACHI, LTD.: OTHER DEVELOPMENTS
           9.1.5 WABTEC CORPORATION
                    TABLE 145 WABTEC CORPORATION: COMPANY OVERVIEW
                    FIGURE 42 WABTEC CORPORATION: COMPANY SNAPSHOT
                    TABLE 146 WABTEC CORPORATION: PRODUCTS/SOLUTIONS/SERVICES OFFERED
                    TABLE 147 WABTEC CORPORATION: PRODUCT LAUNCHES
                    TABLE 148 WABTEC CORPORATION: DEALS
           9.1.6 CISCO SYSTEMS, INC.
                    TABLE 149 CISCO SYSTEMS, INC.: COMPANY OVERVIEW
                    FIGURE 43 CISCO SYSTEMS, INC.: COMPANY SNAPSHOT
                    TABLE 150 CISCO SYSTEMS, INC.: PRODUCTS/SOLUTIONS/SERVICES OFFERED
           9.1.7 ABB
                    TABLE 151 ABB: COMPANY OVERVIEW
                    FIGURE 44 ABB: COMPANY SNAPSHOT
                    TABLE 152 ABB: PRODUCTS/SOLUTIONS/SERVICES OFFERED
                    TABLE 153 ABB: OTHER DEVELOPMENTS
           9.1.8 INDRA SISTEMAS, S.A.
                    TABLE 154 INDRA SISTEMAS, S.A.: COMPANY OVERVIEW
                    FIGURE 45 INDRA SISTEMAS, S.A.: COMPANY SNAPSHOT
                    TABLE 155 INDRA SISTEMAS, S.A.: PRODUCTS/SOLUTIONS/SERVICES OFFERED
                    TABLE 156 INDRA SISTEMAS, S.A.: DEALS
           9.1.9 IBM CORPORATION
                    TABLE 157 IBM CORPORATION: COMPANY OVERVIEW
                    FIGURE 46 IBM CORPORATION: COMPANY SNAPSHOT
                    TABLE 158 IBM CORPORATION: PRODUCTS/SOLUTIONS/SERVICES OFFERED
           9.1.10 HONEYWELL INTERNATIONAL INC.
                    TABLE 159 HONEYWELL INTERNATIONAL INC.: COMPANY OVERVIEW
                    FIGURE 47 HONEYWELL INTERNATIONAL INC.: COMPANY SNAPSHOT
                    TABLE 160 HONEYWELL INTERNATIONAL INC.: PRODUCTS/SOLUTIONS/SERVICES OFFERED
*Details on Business Overview, Products/Solutions/Services offered, Recent Developments, MnM View might not be captured in case of unlisted companies.
    9.2 OTHER PLAYERS 
           9.2.1 CAF
                    TABLE 161 CAF: COMPANY OVERVIEW
           9.2.2 WSP
                    TABLE 162 WSP: COMPANY OVERVIEW
           9.2.3 KYOSAN ELECTRIC MFG. CO., LTD.
                    TABLE 163 KYOSAN ELECTRIC MFG. CO., LTD.: COMPANY OVERVIEW
           9.2.4 ADVANTECH CO., LTD.
                    TABLE 164 ADVANTECH CO., LTD.: COMPANY OVERVIEW
           9.2.5 THALES
                    TABLE 165 THALES: COMPANY OVERVIEW
           9.2.6 AMADEUS IT GROUP SA
                    TABLE 166 AMADEUS IT GROUP SA: COMPANY OVERVIEW
           9.2.7 ATKINSREALIS
                    TABLE 167 ATKINSREALIS: COMPANY OVERVIEW
           9.2.8 DXC TECHNOLOGY COMPANY
                    TABLE 168 DXC TECHNOLOGY COMPANY: COMPANY OVERVIEW
           9.2.9 FUJITSU
                    TABLE 169 FUJITSU: COMPANY OVERVIEW
    9.3 SMES/STARTUPS 
           9.3.1 RAILROAD SOFTWARE
                    TABLE 170 RAILROAD SOFTWARE: COMPANY OVERVIEW
           9.3.2 RAILCUBE
                    TABLE 171 RAILCUBE: COMPANY OVERVIEW
           9.3.3 UPTAKE TECHNOLOGIES INC.
                    TABLE 172 UPTAKE TECHNOLOGIES INC.: COMPANY OVERVIEW
           9.3.4 NWAY TECHNOLOGIES
                    TABLE 173 NWAY TECHNOLOGIES: COMPANY OVERVIEW
           9.3.5 EUROTECH S.P.A.
                    TABLE 174 EUROTECH S.P.A.: COMPANY OVERVIEW
           9.3.6 FREQUENTIS
                    TABLE 175 FREQUENTIS: COMPANY OVERVIEW
           9.3.7 RAILINC CORPORATION
                    TABLE 176 RAILINC CORPORATION: COMPANY OVERVIEW
           9.3.8 ARCADIS GEN HOLDINGS LIMITED
                    TABLE 177 ARCADIS GEN HOLDINGS LIMITED: COMPANY OVERVIEW
 
10 ADJACENT/RELATED MARKETS (Page No. - 205)
     10.1 INTRODUCTION 
               TABLE 178 ADJACENT REPORT DETAILS
             10.1.1 LIMITATIONS
     10.2 DIGITAL RAILWAY MARKET - GLOBAL FORECAST TO 2027 
             10.2.1 MARKET DEFINITION
             10.2.2 MARKET OVERVIEW
             10.2.3 DIGITAL RAILWAY MARKET, BY SOLUTION
                       TABLE 179 DIGITAL RAILWAY MARKET, BY SOLUTION, 2017–2021 (USD BILLION)
                       TABLE 180 DIGITAL RAILWAY MARKET, BY SOLUTION, 2022–2027 (USD BILLION)
             10.2.4 DIGITAL RAILWAY MARKET, BY SERVICE
                       TABLE 181 DIGITAL RAILWAY MARKET, BY SERVICE, 2017–2021 (USD BILLION)
                       TABLE 182 DIGITAL RAILWAY MARKET, BY SERVICE, 2022–2027 (USD BILLION)
                       TABLE 183 PROFESSIONAL SERVICES: DIGITAL RAILWAY MARKET, BY TYPE, 2017–2021 (USD BILLION)
                       TABLE 184 PROFESSIONAL SERVICES: DIGITAL RAILWAY MARKET, BY TYPE, 2022–2027 (USD BILLION)
             10.2.5 DIGITAL RAILWAY MARKET, BY APPLICATION
                       TABLE 185 DIGITAL RAILWAY MARKET, BY APPLICATION, 2017–2021 (USD BILLION)
                       TABLE 186 DIGITAL RAILWAY MARKET, BY APPLICATION, 2022–2027 (USD BILLION)
             10.2.6 DIGITAL RAILWAY MARKET, BY REGION
                       TABLE 187 DIGITAL RAILWAY MARKET, BY REGION, 2017–2021 (USD BILLION)
                       TABLE 188 DIGITAL RAILWAY MARKET, BY REGION, 2022–2027 (USD BILLION)
     10.3 SMART RAILWAY MARKET – GLOBAL FORECAST TO 2027 
             10.3.1 MARKET DEFINITION
             10.3.2 MARKET OVERVIEW
             10.3.3 SMART RAILWAY MARKET, BY OFFERING
                       TABLE 189 SMART RAILWAY MARKET, BY OFFERING, 2017–2021 (USD MILLION)
                       TABLE 190 SMART RAILWAY MARKET, BY OFFERING, 2022–2027 (USD MILLION)
             10.3.4 SMART RAILWAY MARKET, BY SOLUTION
                       TABLE 191 SMART RAILWAY MARKET, BY SOLUTION, 2017–2021 (USD MILLION)
                       TABLE 192 SMART RAILWAY MARKET, BY SOLUTION, 2022–2027 (USD MILLION)
             10.3.5 SMART RAILWAY MARKET, BY SERVICE
                       TABLE 193 SMART RAILWAY MARKET, BY SERVICE, 2017–2021 (USD MILLION)
                       TABLE 194 SMART RAILWAY MARKET, BY SERVICE, 2022–2027 (USD MILLION)
             10.3.6 SMART RAILWAY MARKET, BY REGION
                       TABLE 195 SMART RAILWAY MARKET, BY REGION, 2017–2021 (USD MILLION)
                       TABLE 196 SMART RAILWAY MARKET, BY REGION, 2022–2027 (USD MILLION)
 
11 APPENDIX (Page No. - 213)
     11.1 DISCUSSION GUIDE 
     11.2 KNOWLEDGESTORE: MARKETSANDMARKETS’ SUBSCRIPTION PORTAL 
     11.3 CUSTOMIZATION OPTIONS 
     11.4 RELATED REPORTS 
     11.5 AUTHOR DETAILS 

The study involved four major activities in estimating the current size of the global railway management system market. Exhaustive secondary research was done to collect information on the market, peer market, and parent market. The next step was to validate these findings, assumptions, and sizing with industry experts across the value chain through primary research. Both top-down and bottom-up approaches were employed to estimate the total railway management system market size. After that, the market breakup and data triangulation techniques were used to estimate the market size of segments and subsegments.

Secondary Research

In the secondary research process, various secondary sources, such as Bloomberg and BusinessWeek, have been referred to identify and collect information for this study. The secondary sources included annual reports, press releases, and investor presentations of companies; white papers; and journals, such as Linux Journal and Container Journal, and articles from recognized authors, directories, and databases.

Primary Research

Various primary sources from both supply and demand sides were interviewed to obtain qualitative and quantitative information for this report. The primary sources from the supply side included industry experts, such as Chief Executive Officers (CEOs), Chief Marketing Officers (CMO), Vice Presidents (VPs), Managing Directors (MDs), technology and innovation directors, and related key executives from various key companies and organizations operating in the railway management system market along with the associated service providers, and system integrators operating in the targeted regions. All possible parameters that affect the market covered in this research study have been accounted for, viewed in extensive detail, verified through primary research, and analyzed to get the final quantitative and qualitative data. Following is the breakup of primary respondents.
Railway Management System Market  Market Size, and Share

To know about the assumptions considered for the study, download the pdf brochure

Company Name

Designation

Siemens

Senior Manager

Nway Technology

VP

Hitachi

Business Executive

Market Size Estimation

For making market estimates and forecasting the railway management system market, and other dependent submarkets, the top-down and bottom-up approaches were used. The bottom-up procedure was used to arrive at the overall market size of the global railway management system market using key companies’ revenue and their offerings in the market. The research methodology used to estimate the market size includes the following:

  • The key players in the Railway management system market have been identified through extensive secondary research.
  • The market size, in terms of value, has been determined through primary and secondary research processes.
  • All percentage shares, splits, and breakups have been determined using secondary sources and verified through primary sources.

Railway management system market Size: Bottom-Up Approach

Railway Management System Market  Market Bottom Up Approach

To know about the assumptions considered for the study, Request for Free Sample Report

Railway management system market Size: Top-Down Approach

Railway Management System Market  Market Top Down Approach

Data Triangulation

With data triangulation and validation through primary interviews, the exact value of the overall parent market size was determined and confirmed using this study. The overall market size was then used in the top-down procedure to estimate the size of other individual markets via percentage splits of the market segmentation.

Market Definition

A railway management system combines solutions and associated services for improving the speed, safety, and reliability of rail services, leading to smarter railway infrastructure utilization. The railway management system leverages a combination and integration of technology, planning, and greater intelligence to harness the power of data to meet consumers’ demand for better services and safer travel, and help rail management authorities manage optimal routes, schedules, and capacity on a real-time basis.

Key Stakeholders

  • Railway management system vendors
  • Network and System Integrators (SIs)
  • Cloud service providers
  • Railway infrastructure providers
  • Railway support service providers
  • National railway governing authorities/regulators/bodies
  • Railway operators and agencies
  • Value-Added Resellers (VARs) and distributors

Report Objectives

  • To determine, segment, and forecast the global railway management system market based on offering, and region in terms of value.
  • To forecast the size of the market segments to five main regions: North America, Europe, Asia Pacific, Middle East & Africa, and Latin America.
  • To provide detailed information about the major factors (drivers, opportunities, threats, and challenges) influencing the growth of the railway management system market.
  • To study the complete value chain and related industry segments and perform a value chain analysis of the railway management system market landscape.
  • To strategically analyze the macro and micro markets to individual growth trends, prospects, and contributions to the total railway management system market.
  • To analyze the industry trends, patents, and innovations related to the railway management system market.
  • To analyze the opportunities for stakeholders by identifying the high-growth segments of the railway management system market.
  • To profile the key players in the market and comprehensively analyze their market share/ranking and core competencies.
  • To track and analyze competitive developments, such as mergers & acquisitions, product launches & developments, partnerships, agreements, collaborations, business expansions, and Research & Development (R&D) activities.

Available Customizations

With the given market data, MarketsandMarkets offers customizations as per the company’s specific needs. The following customization options are available for the report:

Company Information

  • Detailed analysis and profiling of an additional two market players
Custom Market Research Services

We will customize the research for you, in case the report listed above does not meet with your exact requirements. Our custom research will comprehensively cover the business information you require to help you arrive at strategic and profitable business decisions.

Request Customization

Instant Answers with GPT - Ask Now!

Ask real questions. Get complete answers !
Report Code
TC 2357
Published ON
Apr, 2024
Choose License Type
BUY NOW
  • SHARE
X
Request Customization
Speak to Analyst
Speak to Analyst
OR FACE-TO-FACE MEETING
PERSONALIZE THIS RESEARCH
  • Triangulate with your Own Data
  • Get Data as per your Format and Definition
  • Gain a Deeper Dive on a Specific Application, Geography, Customer or Competitor
  • Any level of Personalization
REQUEST A FREE CUSTOMIZATION
LET US HELP YOU!
  • What are the Known and Unknown Adjacencies Impacting the Railway Management System Market
  • What will your New Revenue Sources be?
  • Who will be your Top Customer; what will make them switch?
  • Defend your Market Share or Win Competitors
  • Get a Scorecard for Target Partners
CUSTOMIZED WORKSHOP REQUEST
+1-888-600-6441
  • Call Us
  • +1-888-600-6441 (Corporate office hours)
  • +1-888-600-6441 (US/Can toll free)
  • +44-800-368-9399 (UK office hours)
CONNECT WITH US
ABOUT TRUST ONLINE
©2024 MarketsandMarkets Research Private Ltd. All rights reserved
DMCA.com Protection Status Website Feedback