Esoteric Testing Market

Esoteric Testing Market Size, Share & Trends by Type (Endocrinology, Oncology, Neurology, Genetic Tests, Autoimmune, Infectious Diseases), Technology (ELISA, CLIA, Flow Cytometry, NGS, RT-PCR, Chromatography, Spectrometry), Specimen (Blood, Urine) - Global Forecast to 2029

Report Code: MD 5930 Jun, 2024, by marketsandmarkets.com

Esoteric Testing Market Size, Share & Trends

The size of global esoteric testing market in terms of revenue was estimated to be worth $32.2 billion in 2024 and is poised to reach $48.3 billion by 2029, growing at a CAGR of 8.5% from 2024 to 2029. The comprehensive research encompasses an exhaustive examination of industry trends, meticulous pricing analysis, patent scrutiny, insights derived from conferences and webinars, identification of key stakeholders, and a nuanced understanding of market purchasing dynamics.

Growth in the market is primarily driven by the growing geriatric population, advancements in esoteric tests for personalized medicine, increasing research funding for precision medicine, and increase in drug and alcohol abuse and stringent laws mandating drug and alcohol testing.

Esoteric Testing Market Trends
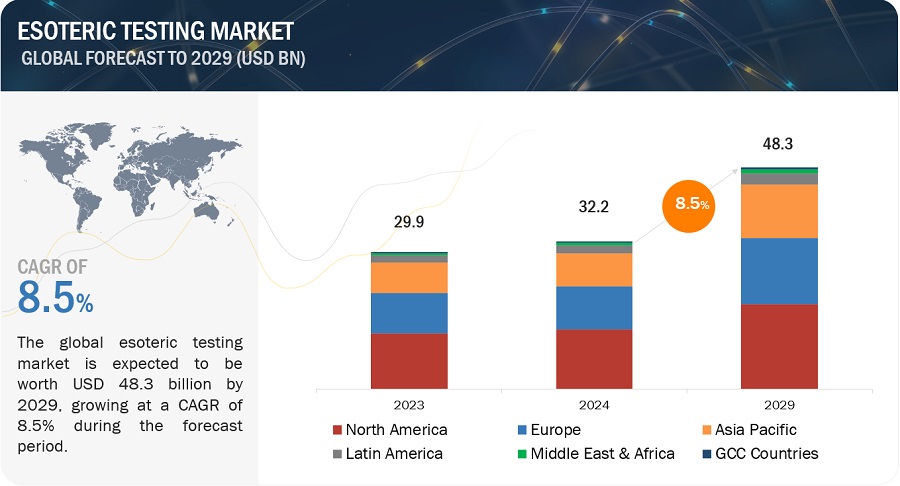
Esoteric Testing Market

To know about the assumptions considered for the study, Request for Free Sample Report
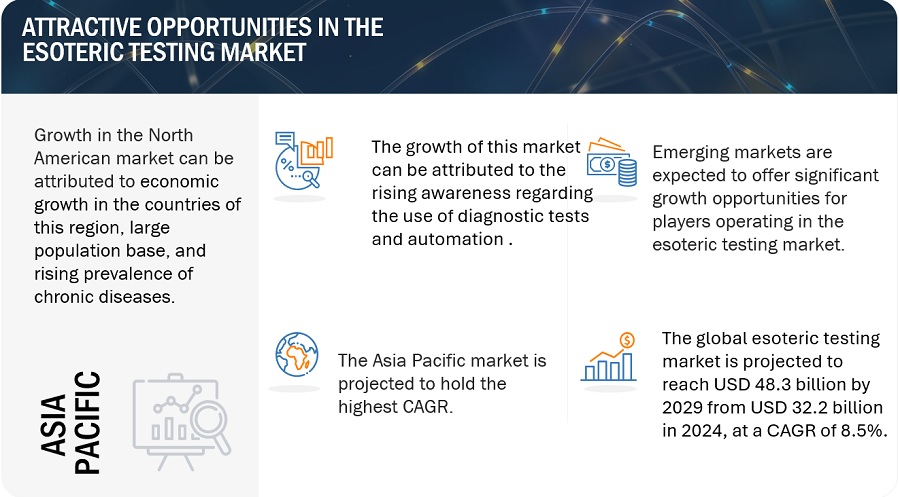
Esoteric Testing Market

Esoteric Testing Market Dynamics

DRIVER: Increasing research funding for precision medicine, genetic analysis, and personalized medicine

Several research grants have been awarded for the research of genomics, precision medicine, and personalized medicine. These will support the understanding, diagnosis, and therapy development for rare molecules, helping esoteric testing laboratories to expand their diagnostic offerings.

Technological, diagnostic, and healthcare solution developments are being driven by the growing investments in finance for R&D activities in the market. This initiative has the potential to improve patient outcomes, increase diagnostic accuracy, and address global health issues, thus contributing to market growth in the coming years.

Recently, several organizations, authorities, and governments have deliberated their attention on personalized medicine. For instance, the new European Partnership for Personalised Medicine (EP PerMed), initiated on October 5, 2023, endeavors to enhance future healthcare provision for all individuals by focusing on personalized therapy.

Restraint: High capital investments and low-cost-benefit ratio for biomarkers

The development of esoteric testing methods often leads to the discovery of new biomarkers. Esoteric testing helps researchers and doctors better understand how these biomarkers relate to health and disease. Significant capital investments are required for the discovery, development, and validation of biomarkers. This is a major factor restraining the growth of the biomarkers market and other related markets such as diagnostics (in vitro diagnostics or companion diagnostics) and personalized medicine.

Opportunity: Emerging technologies and advanced tests for screening and risk identification in esoteric testing

The increasing number of research studies on rare molecules has resulted in the development of several new technologies that hold great diagnostic potential for rare molecules. For instance, COLD-PCR helps in the diagnosis of rare mutations with the use of CO-amplification at lower denaturation temperature polymerase chain reaction (COLD-PCR) methods. This helps in the selective denaturation of wild-type-mutant heteroduplexes using the critical temperature, allowing the enrichment of rare mutations. These mutations are then analyzed by using techniques such as digital PCR, NGS, pyrosequencing, or Sanger sequencing

Over the coming years, there will be notable growth in advanced tests for screening and risk assessment, spurred by the trend toward less invasive screening methods and their increasing clinical significance. In the longer term, as understanding deepens regarding the connections between genetic and proteomic markers and diseases, these tests will gain clinical relevance and actionable insights, leading to expanded utilization and positive healthcare outcomes.

Challenge: Inaccuracies and misdiagnosis in diagnostic testing

Inaccuracies and misdiagnoses in esoteric testing can arise from a variety of factors, including inadequate sample extraction and testing, inconsistent or lacking test reporting, and retesting. The most prevalent infectious disorders impacted by diagnostic errors include urinary tract infections (UTIs), pleuro-pulmonary infections, tuberculosis (TB), upper respiratory tract infections (URTIs), and infections of the central nervous system (CNS). There was a considerable impact on clinical outcomes linked with errors related to tuberculosis (TB) and intra-abdominal infections (IAI). In approximately 33% of cases involving errors related to upper respiratory tract infections (URTIs), the incorrect causative pathogen was under consideration.

According to the National Center for Biotechnology Information (NCBI), as of 2023, an estimated USD 50 billion to USD 60 billion is spent annually on unsuccessful cancer trials at the industry level. Improved target validation and more appropriate preclinical models are required to reduce attrition, with greater consideration for decision-making prior to the start of clinical trials.

Esoteric Testing Industry Ecosystem

Esoteric Testing Market  Ecosystem

In 2023, the infectious diseases testing segment accounted for the largest share of the esoteric testing industry, by type

Based on type, the esoteric testing market is segmented into infectious disease testing, autoimmune disease testing, endocrinology testing, oncology testing, genetic testing, toxicology and drug monitoring testing, neurology testing, and other types of testing. The high CAGR of this segment is attributed to the increasing prevalence of infectious diseases such as dengue, hepatitis B & C, malaria, HIV, and tuberculosis.

In 2023, the Enzyme-linked Immunosorbent Assay (ELISA) segment accounted for the largest share of the esoteric testing industry, by technology

Based on technology, the esoteric testing market is segmented into chemiluminescence immunoassay (CLIA), enzyme-linked immunosorbent assay (ELISA), real-time PCR, chromatography and mass spectrometry, flow cytometry, DNA sequencing and next-generation sequencing, and other technologies. Enhanced specificity and sensitivity via antigen-antibody reactions, coupled with high efficiency of simultaneous analyses, will drive the growth of this market.

In 2023, the market for Blood, serum and plasma specimens has the largest market share of the esoteric testing industry and is projected to have highest CAGR during the forecast period, by specimen

Based on specimens, the esoteric testing market is segmented into blood, serum, and plasma, urine, and other specimens. Blood is the most widely collected sample for esoteric testing procedures and is preferred for overall health screening as it provides information on various health conditions, such as genetic disorders, cardiovascular diseases, cancer, and diabetes. When used as a specimen in esoteric testing, blood, serum and plasma provides important insights into complex medical disorders, allowing for accurate diagnosis and customized treatment plans. Its importance in furthering medical research and customized treatment is highlighted by its capacity to identify complex biomarkers and genetic fingerprints.

In 2023, North America accounted for the largest share of the esoteric testing industry, followed by Europe, by region

The global esoteric testing market is segmented into six major regions namely, North America, Europe, the Asia Pacific, Middle East & Africa, Latin America, and the GCC Countries. North America accounted for the largest share of the market in 2023. The growth of the North American market is mainly driven by its well-established esoteric laboratories, high per capita healthcare expenditure, and technologically advanced healthcare infrastructure.
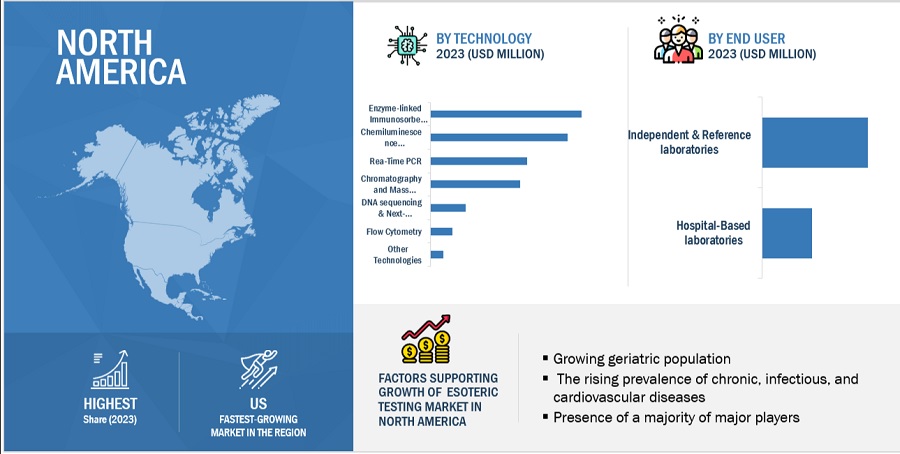
Esoteric Testing Market  by Region

To know about the assumptions considered for the study, download the pdf brochure

The major players in this market are Labcorp (US), Quest Diagnostics (US), and H.U. Group Holdings (Japan), Sonic Healthcare (Australia), OPKO Health, Inc. (US). These players’ market leadership is due to their comprehensive product portfolios and expansive global footprint. These dominant market players have several advantages, including strong research and development budgets, strong marketing and distribution networks, and well-established brand recognition.

Scope of the Esoteric Testing Industry:

Report Metric

Details

Market Revenue in 2024

$32.2 billion

Projected Revenue by 2029

$48.3 billion

Revenue Rate

Poised to Grow at a CAGR of 8.5%

Market Driver

Increasing research funding for precision medicine, genetic analysis, and personalized medicine

Market Opportunity

Emerging technologies and advanced tests for screening and risk identification in esoteric testing

This research report categorizes the esoteric testing market to forecast revenue and analyze trends in each of the following submarkets:

By Region
  • North America
  • Europe
  • Asia Pacific
  • Latin America
  • Middle East & Africa
  • GCC Countries
By Type
  • Autoimmune Diseases Testing
  • Infectious Disease Testing
  • Endocrinology Testing
  • Genetic Testing
  • Toxicology & Drug Monitoring Testing
  • Oncology Testing
  • Neurology Testing
  • Other Types of Testing
By Technology
  • Chemiluminescence Immunoassay
  • Enzyme-linked Immunosorbent Assay
  • Real-time PCR
  • DNA Sequencing & Next-generation Sequencing
  • Flow Cytometry
  • Chromatography & Mass Spectrometry
  • Other Technologies
By Specimen
  • Blood, Serum, and Plasma
  • Urine
  • Other Specimens
By End User
  • Independent and Reference laboratories
  • Hospital-based laboratories

Recent Developments of the Esoteric Testing Industry:

  • In April 2024, Labcorp launched glial fibrillary acidic protein (GFAP), a critical blood-based biomarker for the early detection of neurodegenerative diseases and neurological injuries.
  • In April 2024, Quest launched a new blood biomarker test for phosphorylated tau 217, or p-tau217. P-tau217 is useful for the early diagnosis of AD.
  • In March 2024, Labcorp launched pTau217 test to identify the presence or absence of phosphorylated tau 217 (pTau217), a pivotal blood biomarker designed to aid in the diagnosis of Alzheimer's disease and the subsequent monitoring of patients undergoing treatment with new Alzheimer's disease therapies.

Frequently Asked Questions (FAQ):

To speak to our analyst for a discussion on the above findings, click Speak to Analyst

TABLE OF CONTENTS
 
1 INTRODUCTION (Page No. - 37)
    1.1 STUDY OBJECTIVES 
    1.2 MARKET DEFINITION 
           1.2.1 INCLUSIONS & EXCLUSIONS OF STUDY
    1.3 MARKET SEGMENTATION 
           1.3.1 MARKETS COVERED
                    FIGURE 1 ESOTERIC TESTING MARKET SEGMENTATION
           1.3.2 REGIONS COVERED
           1.3.3 YEARS CONSIDERED
    1.4 CURRENCY 
    1.5 STAKEHOLDERS 
    1.6 SUMMARY OF CHANGES 
           1.6.1 RECESSION IMPACT
 
2 RESEARCH METHODOLOGY (Page No. - 42)
    2.1 RESEARCH DATA 
          FIGURE 2 ESOTERIC TESTING MARKET: RESEARCH DESIGN
           2.1.1 SECONDARY DATA
                    2.1.1.1 Key data from secondary sources
           2.1.2 PRIMARY DATA
                    2.1.2.1 Primary sources
                    2.1.2.2 Key data from primary sources
                    2.1.2.3 Key industry insights
                                FIGURE 3 BREAKDOWN OF PRIMARY INTERVIEWS: SUPPLY-SIDE AND DEMAND-SIDE PARTICIPANTS
                                FIGURE 4 BREAKDOWN OF PRIMARY INTERVIEWS: BY COMPANY TYPE, DESIGNATION,  AND REGION
    2.2 MARKET SIZE ESTIMATION 
           2.2.1 BOTTOM-UP APPROACH
                    2.2.1.1 Approach 1: Company Revenue Estimation Approach
                                FIGURE 5 COMPANY REVENUE ESTIMATION
                                FIGURE 6 CAGR PROJECTIONS: SUPPLY-SIDE ANALYSIS
           2.2.2 TOP-DOWN APPROACH
                    FIGURE 7 ESOTERIC TESTING INDUSTRY: TOP-DOWN APPROACH
    2.3 MARKET BREAKDOWN AND DATA TRIANGULATION 
          FIGURE 8 DATA TRIANGULATION METHODOLOGY
    2.4 MARKET SHARE ANALYSIS 
    2.5 STUDY ASSUMPTIONS 
    2.6 GROWTH RATE ASSUMPTIONS 
    2.7 RESEARCH LIMITATIONS 
           2.7.1 METHODOLOGY-RELATED LIMITATIONS
           2.7.2 SCOPE-RELATED LIMITATIONS
    2.8 RISK ASSESSMENT 
          TABLE 1 RISK ASSESSMENT
    2.9 RECESSION IMPACT ON MARKET 
 
3 EXECUTIVE SUMMARY (Page No. - 55)
    FIGURE 9 ESOTERIC TESTING MARKET, BY TYPE, 2024 VS. 2029 (USD BILLION)
    FIGURE 10 ESOTERIC TESTING INDUSTRY, BY TECHNOLOGY, 2024 VS. 2029 (USD BILLION)
    FIGURE 11 MARKET, BY SPECIMEN, 2024 VS. 2029 (USD BILLION)
    FIGURE 12 MARKET, BY END USER, 2024 VS. 2029 (USD BILLION)
    FIGURE 13 GEOGRAPHICAL SNAPSHOT OF MARKET
 
4 PREMIUM INSIGHTS (Page No. - 59)
    4.1 ESOTERIC TESTING MARKET OVERVIEW 
          FIGURE 14 RISING PREVALENCE OF CHRONIC AND INFECTIOUS DISEASES TO DRIVE MARKET
    4.2 ASIA PACIFIC: ESOTERIC TESTING INDUSTRY, BY TECHNOLOGY  AND COUNTRY (2023) 
          FIGURE 15 ELISA SEGMENT ACCOUNTED FOR LARGEST SHARE OF ASIA PACIFIC  MARKET IN 2023
    4.3 MARKET: GEOGRAPHIC GROWTH OPPORTUNITIES 
          FIGURE 16 CHINA TO REGISTER HIGHEST GROWTH DURING FORECAST PERIOD
    4.4 MARKET: REGIONAL MIX (2022–2029) 
          FIGURE 17 ASIA PACIFIC TO WITNESS HIGHEST GROWTH DURING FORECAST PERIOD
    4.5 MARKET: DEVELOPED VS. DEVELOPING MARKETS 
          FIGURE 18 DEVELOPING MARKETS TO REGISTER HIGHER GROWTH DURING FORECAST PERIOD
 
5 MARKET OVERVIEW (Page No. - 63)
    5.1 INTRODUCTION 
    5.2 MARKET DYNAMICS 
          FIGURE 19 ESOTERIC TESTING MARKET: DRIVERS, RESTRAINTS, OPPORTUNITIES,  AND CHALLENGES
           5.2.1 DRIVERS
                    5.2.1.1 Growing geriatric population and increasing prevalence of chronic and infectious diseases
                                FIGURE 20 INCIDENCE OF CANCER, BY REGION, 2022 VS. 2030 VS. 2040 (MILLION)
                                FIGURE 21 INCIDENCE OF DIABETES, BY REGION, 2021 VS. 2030 VS. 2045 (MILLION)
                                TABLE 2 GLOBAL INCIDENCE OF INFECTIOUS DISEASES
                                FIGURE 22 GERIATRIC POPULATION, BY REGION, 2022 VS. 2050 (%)
                                TABLE 3 ESOTERIC TESTS INDICATED FOR CHRONIC AND INFECTIOUS DISEASES
                    5.2.1.2 Increasing use of esoteric DNA sequencing technologies in precision medicine and early diagnosis of cancer
                    5.2.1.3 Advancements in esoteric tests for personalized medicine
                    5.2.1.4 Increasing research funding for precision medicine, genetic analysis, and personalized medicine
                    5.2.1.5 Growing number of collaborations
                    5.2.1.6 Increasing drug and alcohol abuse and stringent laws mandating drug and alcohol testing
           5.2.2 RESTRAINTS
                    5.2.2.1 Inadequate reimbursement
                    5.2.2.2 High capital investments and low-cost-benefit ratio for biomarkers
           5.2.3 OPPORTUNITIES
                    5.2.3.1 Emerging technologies and advanced tests for screening and risk identification in esoteric testing
                    5.2.3.2 Advances in understanding heterogeneity of diseases and safety signals
                    5.2.3.3 Growth opportunities in emerging economies
           5.2.4 CHALLENGES
                    5.2.4.1 Dearth of skilled professionals
                    5.2.4.2 Inaccuracies and misdiagnosis in diagnostic testing
    5.3 PRICING ANALYSIS 
          TABLE 4 AVERAGE SELLING PRICE OF ESOTERIC TESTS, BY REGION
    5.4 VALUE CHAIN ANALYSIS 
          FIGURE 23 VALUE CHAIN ANALYSIS: MAJOR VALUE ADDED DURING MANUFACTURING AND ASSEMBLY PHASES
    5.5 SUPPLY CHAIN ANALYSIS 
          FIGURE 24 ESOTERIC TESTING INDUSTRY: SUPPLY CHAIN ANALYSIS
    5.6 ECOSYSTEM ANALYSIS OF MARKET 
          FIGURE 25 MARKET: ECOSYSTEM ANALYSIS
           5.6.1 ROLE IN ECOSYSTEM
                    TABLE 5 MARKET: ROLE IN ECOSYSTEM
                    FIGURE 26 KEY PLAYERS IN MARKET ECOSYSTEM
    5.7 REGULATORY OVERVIEW 
           5.7.1 NORTH AMERICA
                    5.7.1.1 US
                    5.7.1.2 Canada
           5.7.2 EUROPE
                    TABLE 6 ACCREDITATION BODIES IN EUROPE
           5.7.3 ASIA PACIFIC
                    5.7.3.1 Japan
                    5.7.3.2 India
                    5.7.3.3 China
           5.7.4 MIDDLE EAST
                    5.7.4.1 Saudi Arabia
                    5.7.4.2 UAE
    5.8 TECHNOLOGY ANALYSIS 
           5.8.1 KEY TECHNOLOGIES
                    5.8.1.1 Immunoassay techniques
           5.8.2 COMPLEMENTARY TECHNOLOGIES
                    5.8.2.1 Polymerase chain reaction
           5.8.3 ADJACENT TECHNOLOGIES
                    5.8.3.1 Mass spectrometry
                    5.8.3.2 Flow cytometry
                                TABLE 7 KEY PLAYERS OFFERING ESOTERIC TESTS WITH ADVANCED TECHNOLOGIES
    5.9 PATENT ANALYSIS 
          FIGURE 27 PATENT ANALYSIS FOR MARKET (JANUARY 2013–DECEMBER 2023)
    5.10 KEY CONFERENCES & EVENTS IN 2024–2025 
           TABLE 8 MARKET: DETAILED LIST OF KEY CONFERENCES & EVENTS,  2O24–2025
    5.11 PORTER’S FIVE FORCES ANALYSIS 
           FIGURE 28 MARKET: PORTER’S FIVE FORCES ANALYSIS
           TABLE 9 MARKET: PORTER’S FIVE FORCES ANALYSIS
           5.11.1 INTENSITY OF COMPETITIVE RIVALRY
           5.11.2 BARGAINING POWER OF SUPPLIERS
           5.11.3 BARGAINING POWER OF BUYERS
           5.11.4 THREAT OF SUBSTITUTES
           5.11.5 THREAT OF NEW ENTRANTS
    5.12 KEY STAKEHOLDERS AND BUYING CRITERIA 
           5.12.1 KEY STAKEHOLDERS IN BUYING PROCESS
                     FIGURE 29 INFLUENCE OF STAKEHOLDERS ON BUYING PROCESS FOR END USERS
                     TABLE 10 INFLUENCE OF STAKEHOLDERS ON BUYING PROCESS FOR END USERS (%)
           5.12.2 BUYING CRITERIA
                     FIGURE 30 KEY BUYING CRITERIA FOR ESOTERIC TESTING END USERS
                     TABLE 11 KEY BUYING CRITERIA FOR ESOTERIC TESTING END USERS
    5.13 TRENDS/DISRUPTIONS IMPACTING CUSTOMER’S BUSINESS 
           5.13.1 REVENUE SHIFT IN MARKET
    5.14 INVESTMENT AND FUNDING SCENARIO 
 
6 ESOTERIC TESTING MARKET, BY TECHNOLOGY (Page No. - 93)
    6.1 INTRODUCTION 
          TABLE 12 ESOTERIC TESTING INDUSTRY, BY TECHNOLOGY, 2022–2029 (USD MILLION)
    6.2 CHEMILUMINESCENCE IMMUNOASSAY 
           6.2.1 HIGH THROUGHPUT AND REDUCED HUMAN ERROR TO DRIVE MARKET
                     TABLE 13 MARKET FOR CHEMILUMINESCENCE IMMUNOASSAY, BY REGION, 2022–2029 (USD MILLION)
                     TABLE 14 NORTH AMERICA: MARKET FOR CHEMILUMINESCENCE IMMUNOASSAY, BY COUNTRY, 2022–2029 (USD MILLION)
                     TABLE 15 EUROPE: MARKET FOR CHEMILUMINESCENCE IMMUNOASSAY,  BY COUNTRY, 2022–2029 (USD MILLION)
                     TABLE 16 ASIA PACIFIC: MARKET FOR CHEMILUMINESCENCE IMMUNOASSAY, BY COUNTRY, 2022–2029 (USD MILLION)
                     TABLE 17 LATIN AMERICA: MARKET FOR CHEMILUMINESCENCE IMMUNOASSAY, BY COUNTRY, 2022–2029 (USD MILLION)
    6.3 ENZYME-LINKED IMMUNOSORBENT ASSAY 
           6.3.1 GROWING NUMBER OF DRUG DISCOVERY ACTIVITIES TO PROPEL MARKET
                     TABLE 18 EXAMPLES OF ESOTERIC ELISA TESTS
                     TABLE 19 MARKET FOR ENZYME-LINKED IMMUNOSORBENT ASSAY, BY REGION, 2022–2029 (USD MILLION)
                     TABLE 20 NORTH AMERICA: MARKET FOR ENZYME-LINKED IMMUNOSORBENT ASSAY, BY COUNTRY, 2022–2029 (USD MILLION)
                     TABLE 21 EUROPE: MARKET FOR ENZYME-LINKED IMMUNOSORBENT ASSAY,  BY COUNTRY, 2022–2029 (USD MILLION)
                     TABLE 22 ASIA PACIFIC: MARKET FOR ENZYME-LINKED IMMUNOSORBENT ASSAY, BY COUNTRY, 2022–2029 (USD MILLION)
                     TABLE 23 LATIN AMERICA: MARKET FOR ENZYME-LINKED IMMUNOSORBENT ASSAY, BY COUNTRY, 2022–2029 (USD MILLION)
    6.4 REAL-TIME PCR 
           6.4.1 INCREASING USE OF QPCR FOR VARIOUS DIAGNOSTIC AND RESEARCH PURPOSES TO SUPPORT MARKET GROWTH
                     TABLE 24 MARKET FOR REAL-TIME PCR, BY REGION,  2022–2029 (USD MILLION)
                     TABLE 25 NORTH AMERICA: MARKET FOR REAL-TIME PCR, BY COUNTRY,  2022–2029 (USD MILLION)
                     TABLE 26 EUROPE: MARKET FOR REAL-TIME PCR, BY COUNTRY,  2022–2029 (USD MILLION)
                     TABLE 27 ASIA PACIFIC: MARKET FOR REAL-TIME PCR, BY COUNTRY,  2022–2029 (USD MILLION)
                     TABLE 28 LATIN AMERICA: MARKET FOR REAL-TIME PCR, BY COUNTRY,  2022–2029 (USD MILLION)
    6.5 DNA SEQUENCING AND NEXT-GENERATION SEQUENCING 
           6.5.1 RISING DEMAND FOR PERSONALIZED MEDICINE TO AID MARKET GROWTH
                     TABLE 29 EXAMPLES OF ESOTERIC TESTS FOR DNA SEQUENCING
                     TABLE 30 MARKET FOR DNA SEQUENCING AND NEXT-GENERATION SEQUENCING, BY REGION, 2022–2029 (USD MILLION)
                     TABLE 31 NORTH AMERICA: MARKET FOR DNA SEQUENCING AND NEXT-GENERATION SEQUENCING, BY COUNTRY, 2022–2029 (USD MILLION)
                     TABLE 32 EUROPE: MARKET FOR DNA SEQUENCING AND NEXT-GENERATION SEQUENCING, BY COUNTRY, 2022–2029 (USD MILLION)
                     TABLE 33 ASIA PACIFIC: MARKET FOR DNA SEQUENCING AND NEXT-GENERATION SEQUENCING, BY COUNTRY, 2022–2029 (USD MILLION)
                     TABLE 34 LATIN AMERICA: MARKET FOR DNA SEQUENCING AND NEXT-GENERATION SEQUENCING, BY COUNTRY, 2022–2029 (USD MILLION)
    6.6 FLOW CYTOMETRY 
           6.6.1 RISING PREVALENCE OF CANCER, HIV, AND HEMATOLOGIC MALIGNANCIES TO DRIVE MARKET
                     TABLE 35 MARKET FOR FLOW CYTOMETRY, BY REGION,  2022–2029 (USD MILLION)
                     TABLE 36 NORTH AMERICA: MARKET FOR FLOW CYTOMETRY,  BY COUNTRY, 2022–2029 (USD MILLION)
                     TABLE 37 EUROPE: MARKET FOR FLOW CYTOMETRY, BY COUNTRY,  2022–2029 (USD MILLION)
                     TABLE 38 ASIA PACIFIC: MARKET FOR FLOW CYTOMETRY, BY COUNTRY,  2022–2029 (USD MILLION)
                     TABLE 39 LATIN AMERICA: MARKET FOR FLOW CYTOMETRY, BY COUNTRY, 2022–2029 (USD MILLION)
    6.7 CHROMATOGRAPHY AND MASS SPECTROMETRY 
           6.7.1 METHODOLOGICAL IMPROVEMENTS AND TECHNOLOGICAL INNOVATIONS TO BOOST MARKET GROWTH
                     TABLE 40 MARKET FOR CHROMATOGRAPHY AND MASS SPECTROMETRY,  BY REGION, 2022–2029 (USD MILLION)
                     TABLE 41 NORTH AMERICA: MARKET FOR CHROMATOGRAPHY AND MASS SPECTROMETRY, BY COUNTRY, 2022–2029 (USD MILLION)
                     TABLE 42 EUROPE: MARKET FOR CHROMATOGRAPHY AND MASS SPECTROMETRY, BY COUNTRY, 2022–2029 (USD MILLION)
                     TABLE 43 ASIA PACIFIC: MARKET FOR CHROMATOGRAPHY AND MASS SPECTROMETRY, BY COUNTRY, 2022–2029 (USD MILLION)
                     TABLE 44 LATIN AMERICA: MARKET FOR CHROMATOGRAPHY AND MASS SPECTROMETRY, BY COUNTRY, 2022–2029 (USD MILLION)
    6.8 OTHER TECHNOLOGIES 
          TABLE 45 MARKET FOR OTHER TECHNOLOGIES, BY REGION,  2022–2029 (USD MILLION)
          TABLE 46 NORTH AMERICA: MARKET FOR OTHER TECHNOLOGIES, BY COUNTRY, 2022–2029 (USD MILLION)
          TABLE 47 EUROPE: MARKET FOR OTHER TECHNOLOGIES, BY COUNTRY,  2022–2029 (USD MILLION)
          TABLE 48 ASIA PACIFIC: MARKET FOR OTHER TECHNOLOGIES,  BY COUNTRY, 2022–2029 (USD MILLION)
          TABLE 49 LATIN AMERICA: MARKET FOR OTHER TECHNOLOGIES, BY COUNTRY, 2022–2029 (USD MILLION)
 
7 ESOTERIC TESTING MARKET, BY TYPE (Page No. - 117)
    7.1 INTRODUCTION 
          TABLE 50 ESOTERIC TESTING INDUSTRY, BY TYPE, 2022–2029 (USD MILLION)
    7.2 ONCOLOGY TESTING 
           7.2.1 HIGH BURDEN OF CANCER TO DRIVE MARKET
                     TABLE 51 PREVALENCE OF CANCER AMONG MALES, 2022
                     TABLE 52 PREVALENCE OF CANCER AMONG FEMALES, 2022
                     TABLE 53 EXAMPLES OF ESOTERIC TESTS FOR CANCER DIAGNOSIS
                     TABLE 54 ESOTERIC ONCOLOGY TESTING MARKET, BY REGION, 2022–2029 (USD MILLION)
                     TABLE 55 NORTH AMERICA: ESOTERIC ONCOLOGY TESTING MARKET, BY COUNTRY,  2022–2029 (USD MILLION)
                     TABLE 56 EUROPE: ESOTERIC ONCOLOGY TESTING MARKET, BY COUNTRY,  2022–2029 (USD MILLION)
                     TABLE 57 ASIA PACIFIC: ESOTERIC ONCOLOGY TESTING MARKET, BY COUNTRY,  2022–2029 (USD MILLION)
                     TABLE 58 LATIN AMERICA: ESOTERIC ONCOLOGY TESTING MARKET, BY COUNTRY,  2022–2029 (USD MILLION)
    7.3 AUTOIMMUNE DISEASE TESTING 
           7.3.1 RISING PREVALENCE OF AUTOIMMUNE DISEASES TO SUPPORT MARKET GROWTH
                     TABLE 59 ESOTERIC AUTOIMMUNE DISEASE TESTING MARKET, BY REGION,  2022–2029 (USD MILLION)
                     TABLE 60 NORTH AMERICA: ESOTERIC AUTOIMMUNE DISEASE TESTING MARKET, BY COUNTRY, 2022–2029 (USD MILLION)
                     TABLE 61 EUROPE: ESOTERIC AUTOIMMUNE DISEASE TESTING MARKET, BY COUNTRY,  2022–2029 (USD MILLION)
                     TABLE 62 ASIA PACIFIC: ESOTERIC AUTOIMMUNE DISEASE TESTING MARKET, BY COUNTRY,  2022–2029 (USD MILLION)
                     TABLE 63 LATIN AMERICA: ESOTERIC AUTOIMMUNE DISEASE TESTING MARKET, BY COUNTRY, 2022–2029 (USD MILLION)
    7.4 INFECTIOUS DISEASE TESTING 
           7.4.1 RISING PREVALENCE OF INFECTIOUS DISEASES TO AID MARKET GROWTH
                     TABLE 64 EXAMPLES OF ESOTERIC TESTS FOR INFECTIOUS DISEASES
                     TABLE 65 ESOTERIC INFECTIOUS DISEASE TESTING MARKET, BY REGION,  2022–2029 (USD MILLION)
                     TABLE 66 NORTH AMERICA: ESOTERIC INFECTIOUS DISEASE TESTING MARKET, BY COUNTRY, 2022–2029 (USD MILLION)
                     TABLE 67 EUROPE: ESOTERIC INFECTIOUS DISEASE TESTING MARKET, BY COUNTRY,  2022–2029 (USD MILLION)
                     TABLE 68 ASIA PACIFIC: ESOTERIC INFECTIOUS DISEASE TESTING MARKET, BY COUNTRY,  2022–2029 (USD MILLION)
                     TABLE 69 LATIN AMERICA: ESOTERIC INFECTIOUS DISEASE TESTING MARKET, BY COUNTRY,  2022–2029 (USD MILLION)
    7.5 ENDOCRINOLOGY TESTING 
           7.5.1 INCREASING INCIDENCE OF DIABETES TO DRIVE ADOPTION OF ESOTERIC TESTS
                     TABLE 70 ESOTERIC ENDOCRINOLOGY TESTING MARKET, BY REGION, 2022–2029 (USD MILLION)
                     TABLE 71 NORTH AMERICA: ESOTERIC ENDOCRINOLOGY TESTING MARKET, BY COUNTRY,  2022–2029 (USD MILLION)
                     TABLE 72 EUROPE: ESOTERIC ENDOCRINOLOGY TESTING MARKET, BY COUNTRY,  2022–2029 (USD MILLION)
                     TABLE 73 ASIA PACIFIC: ESOTERIC ENDOCRINOLOGY TESTING MARKET, BY COUNTRY,  2022–2029 (USD MILLION)
                     TABLE 74 LATIN AMERICA: ESOTERIC ENDOCRINOLOGY TESTING MARKET, BY COUNTRY,  2022–2029 (USD MILLION)
    7.6 GENETIC TESTING 
           7.6.1 ADVANCEMENTS IN GENOMICS AND PROTEOMICS TO SUPPORT MARKET GROWTH
                     TABLE 75 ESOTERIC GENETIC TESTING MARKET, BY REGION, 2022–2029 (USD MILLION)
                     TABLE 76 NORTH AMERICA: ESOTERIC GENETIC TESTING MARKET, BY COUNTRY,  2022–2029 (USD MILLION)
                     TABLE 77 EUROPE: ESOTERIC GENETIC TESTING MARKET, BY COUNTRY, 2022–2029 (USD MILLION)
                     TABLE 78 ASIA PACIFIC: ESOTERIC GENETIC TESTING MARKET, BY COUNTRY,  2022–2029 (USD MILLION)
                     TABLE 79 LATIN AMERICA: ESOTERIC GENETIC TESTING MARKET, BY COUNTRY,  2022–2029 (USD MILLION)
    7.7 NEUROLOGY TESTING 
           7.7.1 INCREASING PREVALENCE OF NEUROLOGICAL DISORDERS TO DRIVE MARKET
                     TABLE 80 EXAMPLES OF ESOTERIC TESTS FOR NEUROLOGICAL DISORDERS
                     TABLE 81 ESOTERIC NEUROLOGY TESTING MARKET, BY REGION, 2022–2029 (USD MILLION)
                     TABLE 82 NORTH AMERICA: ESOTERIC NEUROLOGY TESTING MARKET, BY COUNTRY,  2022–2029 (USD MILLION)
                     TABLE 83 EUROPE: ESOTERIC NEUROLOGY TESTING MARKET, BY COUNTRY,  2022–2029 (USD MILLION)
                     TABLE 84 ASIA PACIFIC: ESOTERIC NEUROLOGY TESTING MARKET, BY COUNTRY,  2022–2029 (USD MILLION)
                     TABLE 85 LATIN AMERICA: ESOTERIC NEUROLOGY TESTING MARKET, BY COUNTRY,  2022–2029 (USD MILLION)
    7.8 TOXICOLOGY AND DRUG MONITORING TESTING 
           7.8.1 INCREASING CASES OF DRUG ABUSE AND ILLICIT DRUG CONSUMPTION TO DRIVE DEMAND FOR ESOTERIC TESTING
                     TABLE 86 ESOTERIC TOXICOLOGY AND DRUG MONITORING TESTING MARKET, BY REGION,  2022–2029 (USD MILLION)
                     TABLE 87 NORTH AMERICA: ESOTERIC TOXICOLOGY AND DRUG MONITORING TESTING MARKET,  BY COUNTRY, 2022–2029 (USD MILLION)
                     TABLE 88 EUROPE: ESOTERIC TOXICOLOGY AND DRUG MONITORING TESTING MARKET,  BY COUNTRY, 2022–2029 (USD MILLION)
                     TABLE 89 ASIA PACIFIC: ESOTERIC TOXICOLOGY AND DRUG MONITORING TESTING MARKET,  BY COUNTRY, 2022–2029 (USD MILLION)
                     TABLE 90 LATIN AMERICA: ESOTERIC TOXICOLOGY AND DRUG MONITORING TESTING MARKET,  BY COUNTRY, 2022–2029 (USD MILLION)
    7.9 OTHER TYPES OF TESTING 
          TABLE 91 MARKET FOR OTHER TYPES OF TESTING, BY REGION,  2022–2029 (USD MILLION)
          TABLE 92 NORTH AMERICA: MARKET FOR OTHER TYPES OF TESTING,  BY COUNTRY, 2022–2029 (USD MILLION)
          TABLE 93 EUROPE: MARKET FOR OTHER TYPES OF TESTING, BY COUNTRY,  2022–2029 (USD MILLION)
          TABLE 94 ASIA PACIFIC: MARKET FOR OTHER TYPES OF TESTING, BY COUNTRY,  2022–2029 (USD MILLION)
          TABLE 95 LATIN AMERICA: MARKET FOR OTHER TYPES OF TESTING,  BY COUNTRY, 2022–2029 (USD MILLION)
 
8 ESOTERIC TESTING MARKET, BY SPECIMEN (Page No. - 147)
    8.1 INTRODUCTION 
           TABLE 96 ESOTERIC TESTING INDUSTRY, BY SPECIMEN, 2022–2029 (USD MILLION)
    8.2 BLOOD, SERUM, AND PLASMA 
           8.2.1 GREATER PREFERENCE AMONG HEALTHCARE PROVIDERS TO PROPEL MARKET
                     TABLE 97 MARKET FOR BLOOD, SERUM, AND PLASMA SPECIMENS, BY REGION, 2022–2029 (USD MILLION)
                     TABLE 98 NORTH AMERICA: MARKET FOR BLOOD, SERUM, AND PLASMA SPECIMENS, BY COUNTRY, 2022–2029 (USD MILLION)
                     TABLE 99 EUROPE: MARKET FOR BLOOD, SERUM, AND PLASMA SPECIMENS,  BY COUNTRY, 2022–2029 (USD MILLION)
                     TABLE 100 ASIA PACIFIC: MARKET FOR BLOOD, SERUM, AND PLASMA SPECIMENS, BY COUNTRY, 2022–2029 (USD MILLION)
                     TABLE 101 LATIN AMERICA: MARKET FOR BLOOD, SERUM, AND PLASMA SPECIMENS, BY COUNTRY, 2022–2029 (USD MILLION)
    8.3 URINE 
           8.3.1 INCREASING UTILIZATION IN ILLICIT DRUG TESTING TO BOOST DEMAND
                     TABLE 102 MARKET FOR URINE SPECIMENS, BY REGION,  2022–2029 (USD MILLION)
                     TABLE 103 NORTH AMERICA: MARKET FOR URINE SPECIMENS, BY COUNTRY, 2022–2029 (USD MILLION)
                     TABLE 104 EUROPE: MARKET FOR URINE SPECIMENS, BY COUNTRY,  2022–2029 (USD MILLION)
                     TABLE 105 ASIA PACIFIC: MARKET FOR URINE SPECIMENS, BY COUNTRY,  2022–2029 (USD MILLION)
                     TABLE 106 LATIN AMERICA: MARKET FOR URINE SPECIMENS, BY COUNTRY, 2022–2029 (USD MILLION)
    8.4 OTHER SPECIMENS 
          TABLE 107 MARKET FOR OTHER SPECIMENS, BY REGION,  2022–2029 (USD MILLION)
          TABLE 108 NORTH AMERICA: MARKET FOR OTHER SPECIMENS, BY COUNTRY, 2022–2029 (USD MILLION)
          TABLE 109 EUROPE: MARKET FOR OTHER SPECIMENS, BY COUNTRY,  2022–2029 (USD MILLION)
          TABLE 110 ASIA PACIFIC: MARKET FOR OTHER SPECIMENS, BY COUNTRY,  2022–2029 (USD MILLION)
          TABLE 111 LATIN AMERICA: MARKET FOR OTHER SPECIMENS, BY COUNTRY, 2022–2029 (USD MILLION)
 
9 ESOTERIC TESTING MARKET, BY END USER (Page No. - 159)
    9.1 INTRODUCTION 
           TABLE 112 ESOTERIC TESTING INDUSTRY, BY END USER, 2022–2029 (USD MILLION)
    9.2 INDEPENDENT AND REFERENCE LABORATORIES 
           9.2.1 LARGEST AND FASTEST-GROWING END USERS OF ESOTERIC TESTS
                    TABLE 113 MARKET FOR INDEPENDENT AND REFERENCE LABORATORIES,  BY REGION, 2022–2029 (USD MILLION)
                    TABLE 114 NORTH AMERICA: MARKET FOR INDEPENDENT AND REFERENCE LABORATORIES, BY COUNTRY, 2022–2029 (USD MILLION)
                    TABLE 115 EUROPE: MARKET FOR INDEPENDENT AND REFERENCE LABORATORIES, BY COUNTRY, 2022–2029 (USD MILLION)
                    TABLE 116 ASIA PACIFIC: MARKET FOR INDEPENDENT AND REFERENCE LABORATORIES, BY COUNTRY, 2022–2029 (USD MILLION)
                    TABLE 117 LATIN AMERICA: MARKET FOR INDEPENDENT AND REFERENCE LABORATORIES, BY COUNTRY, 2022–2029 (USD MILLION)
    9.3 HOSPITAL-BASED LABORATORIES 
           9.3.1 INCREASING NUMBER OF SPECIALTY DIAGNOSTIC TESTS PERFORMED TO SUPPORT MARKET GROWTH
                    TABLE 118 MARKET FOR HOSPITAL-BASED LABORATORIES,  BY REGION, 2022–2029 (USD MILLION)
                    TABLE 119 NORTH AMERICA: MARKET FOR HOSPITAL-BASED LABORATORIES,  BY COUNTRY, 2022–2029 (USD MILLION)
                    TABLE 120 EUROPE: MARKET FOR HOSPITAL-BASED LABORATORIES,  BY COUNTRY, 2022–2029 (USD MILLION)
                    TABLE 121 ASIA PACIFIC: MARKET FOR HOSPITAL-BASED LABORATORIES,  BY COUNTRY, 2022–2029 (USD MILLION)
                    TABLE 122 LATIN AMERICA: MARKET FOR HOSPITAL-BASED LABORATORIES,  BY COUNTRY, 2022–2029 (USD MILLION)
 
10 ESOTERIC TESTING MARKET, BY REGION (Page No. - 167)
     10.1 INTRODUCTION 
             TABLE 123 ESOTERIC TESTING INDUSTRY, BY REGION, 2022–2029 (USD MILLION)
     10.2 NORTH AMERICA 
             FIGURE 31 NORTH AMERICA: ESOTERIC TESTING MARKET SNAPSHOT
             TABLE 124 NORTH AMERICA: MARKET, BY COUNTRY, 2022–2029 (USD MILLION)
             TABLE 125 NORTH AMERICA: MARKET, BY TYPE, 2022–2029 (USD MILLION)
             TABLE 126 NORTH AMERICA: MARKET, BY TECHNOLOGY,  2022–2029 (USD MILLION)
             TABLE 127 NORTH AMERICA: MARKET, BY SPECIMEN,  2022–2029 (USD MILLION)
             TABLE 128 NORTH AMERICA: MARKET, BY END USER,  2022–2029 (USD MILLION)
             10.2.1 NORTH AMERICA: RECESSION IMPACT
             10.2.2 US
                        10.2.2.1 Favorable policies for molecular diagnostic providers to support market growth
                                      TABLE 129 US: INCIDENCE, MORTALITY, AND PREVALENCE, BY CANCER TYPE, 2022
                                      TABLE 130 US: ESOTERIC TESTING MARKET, BY TYPE, 2022–2029 (USD MILLION)
                                      TABLE 131 US: MARKET, BY TECHNOLOGY, 2022–2029 (USD MILLION)
                                      TABLE 132 US: MARKET, BY SPECIMEN,  2022–2029 (USD MILLION)
                                      TABLE 133 US: MARKET, BY END USER, 2022–2029 (USD MILLION)
             10.2.3 CANADA
                        10.2.3.1 Lack of proper reimbursements for diagnostic tests to hamper market growth
                                      TABLE 134 CANADA: ESOTERIC TESTING MARKET, BY TYPE, 2022–2029 (USD MILLION)
                                      TABLE 135 CANADA: MARKET, BY TECHNOLOGY, 2022–2029 (USD MILLION)
                                      TABLE 136 CANADA: MARKET, BY SPECIMEN,  2022–2029 (USD MILLION)
                                      TABLE 137 CANADA: MARKET, BY END USER, 2022–2029 (USD MILLION)
     10.3 EUROPE 
             TABLE 138 EUROPE: ESOTERIC TESTING MARKET, BY COUNTRY, 2022–2029 (USD MILLION)
             TABLE 139 EUROPE: MARKET, BY TYPE, 2022–2029 (USD MILLION)
             TABLE 140 EUROPE: MARKET, BY TECHNOLOGY, 2022–2029 (USD MILLION)
             TABLE 141 EUROPE: MARKET, BY SPECIMEN, 2022–2029 (USD MILLION)
             TABLE 142 EUROPE: MARKET, BY END USER, 2022–2029 (USD MILLION)
             10.3.1 EUROPE: RECESSION IMPACT
             10.3.2 GERMANY
                        10.3.2.1 Favorable government policies to propel market
                                      TABLE 143 GERMANY: INCIDENCE, MORTALITY, AND PREVALENCE, BY CANCER TYPE, 2022
                                      TABLE 144 GERMANY: ESOTERIC TESTING MARKET, BY TYPE, 2022–2029 (USD MILLION)
                                      TABLE 145 GERMANY: MARKET, BY TECHNOLOGY, 2022–2029 (USD MILLION)
                                      TABLE 146 GERMANY: MARKET, BY SPECIMEN, 2022–2029 (USD MILLION)
                                      TABLE 147 GERMANY: MARKET, BY END USER, 2022–2029 (USD MILLION)
             10.3.3 FRANCE
                        10.3.3.1 Rising demand for early disease diagnosis to drive market
                                      TABLE 148 FRANCE: ESOTERIC TESTING MARKET, BY TYPE, 2022–2029 (USD MILLION)
                                      TABLE 149 FRANCE: MARKET, BY TECHNOLOGY, 2022–2029 (USD MILLION)
                                      TABLE 150 FRANCE: MARKET, BY SPECIMEN, 2022–2029 (USD MILLION)
                                      TABLE 151 FRANCE: MARKET, BY END USER, 2022–2029 (USD MILLION)
             10.3.4 ITALY
                        10.3.4.1 Rapidly growing geriatric population to favor market growth
                                      TABLE 152 ITALY: ESOTERIC TESTING MARKET, BY TYPE, 2022–2029 (USD MILLION)
                                      TABLE 153 ITALY: MARKET, BY TECHNOLOGY, 2022–2029 (USD MILLION)
                                      TABLE 154 ITALY: MARKET, BY SPECIMEN, 2022–2029 (USD MILLION)
                                      TABLE 155 ITALY: MARKET, BY END USER, 2022–2029 (USD MILLION)
             10.3.5 UK
                        10.3.5.1 Favorable investment scenario to drive market
                                      TABLE 156 UK: ESOTERIC TESTING MARKET, BY TYPE, 2022–2029 (USD MILLION)
                                      TABLE 157 UK: MARKET, BY TECHNOLOGY, 2022–2029 (USD MILLION)
                                      TABLE 158 UK: MARKET, BY SPECIMEN, 2022–2029 (USD MILLION)
                                      TABLE 159 UK: MARKET, BY END USER, 2022–2029 (USD MILLION)
             10.3.6 SPAIN
                        10.3.6.1 High burden of chronic and infectious diseases to drive adoption of esoteric tests
                                      TABLE 160 SPAIN: ESOTERIC TESTING MARKET, BY TYPE, 2022–2029 (USD MILLION)
                                      TABLE 161 SPAIN: MARKET, BY TECHNOLOGY, 2022–2029 (USD MILLION)
                                      TABLE 162 SPAIN: MARKET, BY SPECIMEN, 2022–2029 (USD MILLION)
                                      TABLE 163 SPAIN: MARKET, BY END USER, 2022–2029 (USD MILLION)
             10.3.7 REST OF EUROPE
                        TABLE 164 REST OF EUROPE: CANCER INCIDENCE, BY COUNTRY, 2022 VS. 2045
                        TABLE 165 REST OF EUROPE: ESOTERIC TESTING MARKET, BY TYPE, 2022–2029 (USD MILLION)
                        TABLE 166 REST OF EUROPE: MARKET, BY TECHNOLOGY,  2022–2029 (USD MILLION)
                        TABLE 167 REST OF EUROPE: MARKET, BY SPECIMEN,  2022–2029 (USD MILLION)
                        TABLE 168 REST OF EUROPE: MARKET, BY END USER,  2022–2029 (USD MILLION)
     10.4 ASIA PACIFIC 
             FIGURE 32 ASIA PACIFIC: ESOTERIC TESTING MARKET SNAPSHOT
             TABLE 169 ASIA PACIFIC: MARKET, BY COUNTRY, 2022–2029 (USD MILLION)
             TABLE 170 ASIA PACIFIC: MARKET, BY TYPE, 2022–2029 (USD MILLION)
             TABLE 171 ASIA PACIFIC: MARKET, BY TECHNOLOGY, 2022–2029 (USD MILLION)
             TABLE 172 ASIA PACIFIC: MARKET, BY SPECIMEN, 2022–2029 (USD MILLION)
             TABLE 173 ASIA PACIFIC: MARKET, BY END USER, 2022–2029 (USD MILLION)
             10.4.1 ASIA PACIFIC: RECESSION IMPACT
             10.4.2 JAPAN
                        10.4.2.1 Presence of well-developed healthcare system to favor market growth
                                      TABLE 174 JAPAN: CANCER INCIDENCE, MORTALITY, AND PREVALENCE, BY CANCER TYPE, 2022
                                      TABLE 175 JAPAN: ESOTERIC TESTING MARKET, BY TYPE, 2022–2029 (USD MILLION)
                                      TABLE 176 JAPAN: MARKET, BY TECHNOLOGY, 2022–2029 (USD MILLION)
                                      TABLE 177 JAPAN: MARKET, BY SPECIMEN, 2022–2029 (USD MILLION)
                                      TABLE 178 JAPAN: MARKET, BY END USER, 2022–2029 (USD MILLION)
             10.4.3 CHINA
                        10.4.3.1 China to register highest growth rate in Asia Pacific esoteric testing market during forecast period
                                      TABLE 179 CHINA: CANCER INCIDENCE, MORTALITY, AND PREVALENCE, BY CANCER TYPE, 2022
                                      TABLE 180 CHINA: MARKET, BY TYPE, 2022–2029 (USD MILLION)
                                      TABLE 181 CHINA: MARKET, BY TECHNOLOGY, 2022–2029 (USD MILLION)
                                      TABLE 182 CHINA: MARKET, BY SPECIMEN, 2022–2029 (USD MILLION)
                                      TABLE 183 CHINA: MARKET, BY END USER, 2022–2029 (USD MILLION)
             10.4.4 INDIA
                        10.4.4.1 Improving healthcare system to support market growth
                                      TABLE 184 INDIA: CANCER INCIDENCE, MORTALITY, AND PREVALENCE, BY CANCER TYPE, 2022
                                      TABLE 185 INDIA: ESOTERIC TESTING MARKET, BY TYPE, 2022–2029 (USD MILLION)
                                      TABLE 186 INDIA: MARKET, BY TECHNOLOGY, 2022–2029 (USD MILLION)
                                      TABLE 187 INDIA: MARKET, BY SPECIMEN, 2022–2029 (USD MILLION)
                                      TABLE 188 INDIA: MARKET, BY END USER, 2022–2029 (USD MILLION)
             10.4.5 AUSTRALIA
                        10.4.5.1 Increasing incidence of chronic diseases and increasing focus on preventive healthcare to propel market
                                      TABLE 189 AUSTRALIA: ESOTERIC TESTING MARKET, BY TYPE, 2022–2029 (USD MILLION)
                                      TABLE 190 AUSTRALIA: MARKET, BY TECHNOLOGY, 2022–2029 (USD MILLION)
                                      TABLE 191 AUSTRALIA: MARKET, BY SPECIMEN, 2022–2029 (USD MILLION)
                                      TABLE 192 AUSTRALIA: MARKET, BY END USER, 2022–2029 (USD MILLION)
             10.4.6 REST OF ASIA PACIFIC
                        TABLE 193 REST OF ASIA PACIFIC: ESOTERIC TESTING MARKET, BY TYPE, 2022–2029 (USD MILLION)
                        TABLE 194 REST OF ASIA PACIFIC: MARKET, BY TECHNOLOGY,  2022–2029 (USD MILLION)
                        TABLE 195 REST OF ASIA PACIFIC: MARKET, BY SPECIMEN,  2022–2029 (USD MILLION)
                        TABLE 196 REST OF ASIA PACIFIC: MARKET, BY END USER,  2022–2029 (USD MILLION)
     10.5 LATIN AMERICA 
             TABLE 197 LATIN AMERICA: ESOTERIC TESTING MARKET, BY COUNTRY, 2022–2029 (USD MILLION)
             TABLE 198 LATIN AMERICA: MARKET, BY TYPE, 2022–2029 (USD MILLION)
             TABLE 199 LATIN AMERICA: MARKET, BY TECHNOLOGY,  2022–2029 (USD MILLION)
             TABLE 200 LATIN AMERICA: MARKET, BY SPECIMEN, 2022–2029 (USD MILLION)
             TABLE 201 LATIN AMERICA: MARKET, BY END USER, 2022–2029 (USD MILLION)
             10.5.1 LATIN AMERICA: RECESSION IMPACT
             10.5.2 BRAZIL
                        10.5.2.1 Presence of large and well-developed pharmaceutical industry to drive market
                                      TABLE 202 BRAZIL: ESOTERIC TESTING MARKET, BY TYPE, 2022–2029 (USD MILLION)
                                      TABLE 203 BRAZIL: MARKET, BY TECHNOLOGY, 2022–2029 (USD MILLION)
                                      TABLE 204 BRAZIL: MARKET, BY SPECIMEN, 2022–2029 (USD MILLION)
                                      TABLE 205 BRAZIL: MARKET, BY END USER, 2022–2029 (USD MILLION)
             10.5.3 MEXICO
                        10.5.3.1 Growth in private healthcare sector to propel market
                                      TABLE 206 MEXICO: ESOTERIC TESTING MARKET, BY TYPE, 2022–2029 (USD MILLION)
                                      TABLE 207 MEXICO: MARKET, BY TECHNOLOGY, 2022–2029 (USD MILLION)
                                      TABLE 208 MEXICO: MARKET, BY SPECIMEN, 2022–2029 (USD MILLION)
                                      TABLE 209 MEXICO: MARKET, BY END USER, 2022–2029 (USD MILLION)
             10.5.4 REST OF LATIN AMERICA
                        TABLE 210 REST OF LATIN AMERICA: ESOTERIC TESTING MARKET, BY TYPE,  2022–2029 (USD MILLION)
                        TABLE 211 REST OF LATIN AMERICA: MARKET, BY TECHNOLOGY,  2022–2029 (USD MILLION)
                        TABLE 212 REST OF LATIN AMERICA: MARKET, BY SPECIMEN,  2022–2029 (USD MILLION)
                        TABLE 213 REST OF LATIN AMERICA: ESOTERIC TESTING MARKET, BY END USER,  2022–2029 (USD MILLION)
     10.6 MIDDLE EAST & AFRICA 
             10.6.1 IMPROVEMENTS IN HEALTHCARE INFRASTRUCTURE TO DRIVE MARKET
                        TABLE 214 AFRICA: CANCER INCIDENCE, MORTALITY, AND PREVALENCE, BY CANCER TYPE, 2022
                        TABLE 215 MIDDLE EAST & AFRICA: ESOTERIC TESTING MARKET, BY TEST,  2022–2029 (USD MILLION)
                        TABLE 216 MIDDLE EAST & AFRICA: MARKET, BY TECHNOLOGY,  2022–2029 (USD MILLION)
                        TABLE 217 MIDDLE EAST & AFRICA: MARKET, BY SPECIMEN,  2022–2029 (USD MILLION)
                        TABLE 218 MIDDLE EAST & AFRICA: ESOTERIC TESTING MARKET, BY END USER,  2022–2029 (USD MILLION)
     10.7 MIDDLE EAST & AFRICA: RECESSION IMPACT 
     10.8 GCC COUNTRIES 
             10.8.1 HEALTHCARE INFRASTRUCTURE DEVELOPMENT TO DRIVE MARKET
                        TABLE 219 GCC COUNTRIES: ESOTERIC TESTING MARKET, BY TYPE, 2022–2029 (USD MILLION)
                        TABLE 220 GCC COUNTRIES: MARKET, BY TECHNOLOGY,  2022–2029 (USD MILLION)
                        TABLE 221 GCC COUNTRIES: MARKET, BY SPECIMEN,  2022–2029 (USD MILLION)
                        TABLE 222 GCC COUNTRIES: ESOTERIC TESTING MARKET, BY END USER, 2022–2029 (USD MILLION)
             10.8.2 GCC COUNTRIES: RECESSION IMPACT
 
11 COMPETITIVE LANDSCAPE (Page No. - 234)
     11.1 OVERVIEW 
     11.2 KEY PLAYER STRATEGIES/RIGHT TO WIN 
             TABLE 223 OVERVIEW OF STRATEGIES ADOPTED BY KEY MARKET PLAYERS
     11.3 REVENUE SHARE ANALYSIS 
             FIGURE 33 REVENUE SHARE ANALYSIS OF KEY PLAYERS IN ESOTERIC TESTING MARKET, 2021–2023 (USD MILLION)
     11.4 MARKET SHARE ANALYSIS 
             TABLE 224 ESOTERIC TESTING INDUSTRY: DEGREE OF COMPETITION
             FIGURE 34 ESOTERIC TESTING INDUSTRY SHARE ANALYSIS, 2023
     11.5 COMPANY EVALUATION MATRIX: KEY PLAYERS, 2023 
             11.5.1 STARS
             11.5.2 EMERGING LEADERS
             11.5.3 PERVASIVE PLAYERS
             11.5.4 PARTICIPANTS
                        FIGURE 35 ESOTERIC TESTING INDUSTRY: COMPANY EVALUATION MATRIX (KEY PLAYERS), 2023
             11.5.5 COMPANY FOOTPRINT: KEY PLAYERS, 2023
                        TABLE 225 COMPANY FOOTPRINT
                        TABLE 226 TYPE FOOTPRINT
                        TABLE 227 TECHNOLOGY FOOTPRINT
                        TABLE 228 END-USER FOOTPRINT
                        TABLE 229 REGIONAL FOOTPRINT
     11.6 COMPANY EVALUATION MATRIX: STARTUPS/SMES, 2023 
             11.6.1 PROGRESSIVE COMPANIES
             11.6.2 STARTING BLOCKS
             11.6.3 RESPONSIVE COMPANIES
             11.6.4 DYNAMIC COMPANIES
                        FIGURE 36 ESOTERIC TESTING INDUSTRY: COMPANY EVALUATION MATRIX (STARTUPS/SMES), 2023
             11.6.5 COMPETITIVE BENCHMARKING OF KEY STARTUPS/SMES
                        TABLE 230 ESOTERIC TESTING INDUSTRY: DETAILED LIST OF KEY STARTUPS/SMES
     11.7 COMPETITIVE SCENARIO 
             11.7.1 SERVICE LAUNCHES
                        TABLE 231 ESOTERIC TESTING INDUSTRY: SERVICE LAUNCHES, JANUARY 2021–APRIL 2024
             11.7.2 DEALS
                        TABLE 232 ESOTERIC TESTING INDUSTRY: DEALS, JANUARY 2021–APRIL 2024
             11.7.3 EXPANSIONS
                        TABLE 233 ESOTERIC TESTING INDUSTRY: EXPANSIONS, JANUARY 2021–APRIL 2024
     11.8 VALUATION AND FINANCIAL METRICS OF ESOTERIC TESTING VENDORS 
             FIGURE 37 EV/EBITDA OF TOP 3 COMPANIES IN ESOTERIC TESTING INDUSTRY
             FIGURE 38 EV/REVENUE OF TOP 3 COMPANIES IN ESOTERIC TESTING INDUSTRY
             FIGURE 39 1-YEAR PRICE TOTAL RETURN OF TOP 3 COMPANIES IN ESOTERIC  TESTING MARKET
             FIGURE 40 5-YEAR BETA OF TOP 3 COMPANIES IN ESOTERIC TESTING INDUSTRY
 
12 COMPANY PROFILES (Page No. - 252)
(Business overview, Products offered, Recent Developments, MNM view)*
     12.1 MAJOR PLAYERS 
             12.1.1 LABCORP
                        TABLE 234 LABCORP: BUSINESS OVERVIEW
                        FIGURE 41 LABCORP: COMPANY SNAPSHOT (2023)
                        TABLE 235 LABCORP: SERVICES OFFERED
                        TABLE 236 LABCORP: SERVICE LAUNCHES, JANUARY 2021–APRIL 2024
                        TABLE 237 LABCORP: DEALS, JANUARY 2021–APRIL 2024
                        TABLE 238 LABCORP: EXPANSIONS, JANUARY 2021–APRIL 2024
             12.1.2 QUEST DIAGNOSTICS
                        TABLE 239 QUEST DIAGNOSTICS: BUSINESS OVERVIEW
                        FIGURE 42 QUEST DIAGNOSTICS: COMPANY SNAPSHOT (2023)
                        TABLE 240 QUEST DIAGNOSTICS: SERVICES OFFERED
                        TABLE 241 QUEST DIAGNOSTICS: SERVICE LAUNCHES, JANUARY 2021–APRIL 2024
                        TABLE 242 QUEST DIAGNOSTICS: DEALS, JANUARY 2021–APRIL 2024
                        TABLE 243 QUEST DIAGNOSTICS: EXPANSIONS, JANUARY 2021–APRIL 2024
             12.1.3 OPKO HEALTH, INC.
                        TABLE 244 OPKO HEALTH, INC.: BUSINESS OVERVIEW
                        FIGURE 43 OPKO HEALTH, INC.: COMPANY SNAPSHOT (2023)
                        TABLE 245 OPKO HEALTH, INC.: SERVICES OFFERED
                        TABLE 246 OPKO HEALTH, INC.: DEALS, JANUARY 2021–APRIL 2024
             12.1.4 H.U. GROUP HOLDINGS, INC.
                        TABLE 247 H.U. GROUP HOLDINGS, INC.: BUSINESS OVERVIEW
                        FIGURE 44 H.U. GROUP HOLDINGS, INC.: COMPANY SNAPSHOT (2023)
                        TABLE 248 H.U. GROUP HOLDINGS, INC.: SERVICES OFFERED
                        TABLE 249 H.U. GROUP HOLDINGS, INC.: DEALS, JANUARY 2021–APRIL 2024
             12.1.5 SONIC HEALTHCARE LIMITED
                        TABLE 250 SONIC HEALTHCARE LIMITED: BUSINESS OVERVIEW
                        FIGURE 45 SONIC HEALTHCARE LIMITED: COMPANY SNAPSHOT (2023)
                        TABLE 251 SONIC HEALTHCARE LIMITED: SERVICES OFFERED
                        TABLE 252 SONIC HEALTHCARE LIMITED: DEALS
             12.1.6 MAYO FOUNDATION FOR MEDICAL EDUCATION AND RESEARCH (MFMER)
                        TABLE 253 MAYO FOUNDATION FOR MEDICAL EDUCATION AND RESEARCH: BUSINESS OVERVIEW
                        TABLE 254 MAYO FOUNDATION FOR MEDICAL EDUCATION AND RESEARCH: SERVICES OFFERED
             12.1.7 EUROFINS SCIENTIFIC
                        TABLE 255 EUROFINS SCIENTIFIC: BUSINESS OVERVIEW
                        FIGURE 46 EUROFINS SCIENTIFIC: COMPANY SNAPSHOT (2023)
                        TABLE 256 EUROFINS SCIENTIFIC: SERVICES OFFERED
                        TABLE 257 EUROFINS SCIENTIFIC: SERVICE LAUNCHES, JANUARY 2021–APRIL 2024
                        TABLE 258 EUROFINS SCIENTIFIC: DEALS, JANUARY 2021–APRIL 2024
             12.1.8 STANFORD HEALTH CARE
                        TABLE 259 STANFORD HEALTH CARE: BUSINESS OVERVIEW
                        TABLE 260 STANFORD HEALTH CARE: SERVICES OFFERED
                        TABLE 261 STANFORD HEALTH CARE: SERVICE LAUNCHES, JANUARY 2021–APRIL 2024
                        TABLE 262 STANFORD HEALTH CARE: DEALS, JANUARY 2021–APRIL 2024
             12.1.9 FOUNDATION MEDICINE, INC.
                        TABLE 263 FOUNDATION MEDICINE, INC.: BUSINESS OVERVIEW
                        TABLE 264 FOUNDATION MEDICINE, INC.: SERVICES OFFERED
                        TABLE 265 FOUNDATION MEDICINE, INC.: DEALS, JANUARY 2021–APRIL 2024
             12.1.10 KINDSTAR GLOBALGENE TECHNOLOGY, INC.
                        TABLE 266 KINDSTAR GLOBALGENE TECHNOLOGY, INC.: BUSINESS OVERVIEW
                        FIGURE 47 KINDSTAR GLOBALGENE TECHNOLOGY, INC.: COMPANY SNAPSHOT (2023)
                        TABLE 267 KINDSTAR GLOBALGENE TECHNOLOGY, INC.: SERVICES OFFERED
             12.1.11 GEORGIA ESOTERIC & MOLECULAR LABORATORY, LLC
                        TABLE 268 GEORGIA ESOTERIC & MOLECULAR LABORATORY, LLC: BUSINESS OVERVIEW
                        TABLE 269 GEORGIA ESOTERIC & MOLECULAR LABORATORY, LLC: SERVICES OFFERED
             12.1.12 THYROCARE TECHNOLOGIES LIMITED
                        TABLE 270 THYROCARE TECHNOLOGIES LIMITED: BUSINESS OVERVIEW
                        FIGURE 48 THYROCARE TECHNOLOGIES LIMITED: COMPANY SNAPSHOT (2023)
                        TABLE 271 THYROCARE TECHNOLOGIES LIMITED: SERVICES OFFERED
             12.1.13 ACM GLOBAL LABORATORIES
                        TABLE 272 ACM GLOBAL LABORATORIES: BUSINESS OVERVIEW
                        TABLE 273 ACM GLOBAL LABORATORIES: SERVICES OFFERED
     12.2 OTHER PLAYERS 
             12.2.1 NMS LABS
             12.2.2 HEALTHQUEST ESOTERICS
             12.2.3 CERBA XPERT
             12.2.4 LEOLABS, INC.
             12.2.5 FLOW HEALTH
             12.2.6 INVITAE CORPORATION
             12.2.7 MYRIAD GENETICS, INC.
             12.2.8 ARUP LABORATORIES
             12.2.9 FULGENT GENETICS
             12.2.10 BIOMONTR LABS
             12.2.11 LABGENOMICS
 
*Details on Business overview, Products/Services/Solutions offered, Recent Developments, MNM view might not be captured in case of unlisted companies.
 
13 APPENDIX (Page No. - 296)
     13.1 DISCUSSION GUIDE 
     13.2 KNOWLEDGESTORE: MARKETSANDMARKETS’  SUBSCRIPTION PORTAL 
     13.3 CUSTOMIZATION OPTIONS 
     13.4 RELATED REPORTS 
     13.5 AUTHOR DETAILS 

To determine the current size of the esoteric testing market, this study engaged in four main activities. A comprehensive study was conducted using secondary research methods to gather data about the market, its parent market, and its peer markets. The next stage involved conducting primary research to confirm these conclusions, assumptions, and sizing with industry experts throughout the value chain. A combination of top-down and bottom-up methods was used to assess the overall market size. The market sizes of segments and subsegments were then estimated using data triangulation techniques and market breakdown.

The four steps involved in estimating the market size are

Collecting Secondary Data

Within the secondary data collection process, a range of secondary sources were reviewed so as to identify and gather data for this study, including regulatory bodies, databases (like D&B Hoovers, Bloomberg Business, and Factiva), white papers, certified publications, articles by well-known authors, annual reports, press releases, and investor presentations of companies.

Collecting Primary Data

During the primary research phase, a comprehensive approach was adopted, involving interviews with a diverse array of sources from both the supply and demand sides. These interviews aimed to gather qualitative and quantitative data essential for compiling this report. Primary sources primarily comprised industry experts spanning core and related sectors, as well as favored suppliers, manufacturers, distributors, service providers, technology innovators, and entities associated with all facets of this industry's value chain. In-depth interviews were meticulously conducted with a range of primary respondents, including key industry stakeholders, subject-matter authorities, C-level executives representing pivotal market players, and industry advisors. The objective was to obtain and authenticate critical qualitative and quantitative insights and to evaluate future potentialities comprehensively.

A breakdown of the primary respondents is provided below:

Breakdown of Primary Participants:
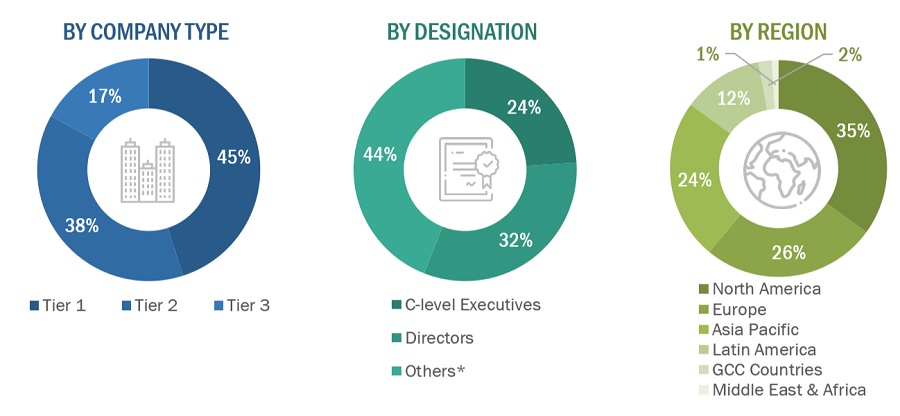
Esoteric Testing Market  Size, and Share

Note 1: Others include sales, marketing, and product managers.

Note 2: Tiers of companies are defined based on their total revenue. As of 2023, Tier 1 = >USD 5 billion, Tier 2 = USD 500 million to USD 5 billion, and Tier 3 = <USD 500 million.

To know about the assumptions considered for the study, download the pdf brochure

COMPANY NAME

DESIGNATION

HealthQuest Esoterics

Strategic Manager

Labcorp

Advisor

Sonic Healthcare

Senior Director

OPKO health

VP Marketing

Market Size Estimation

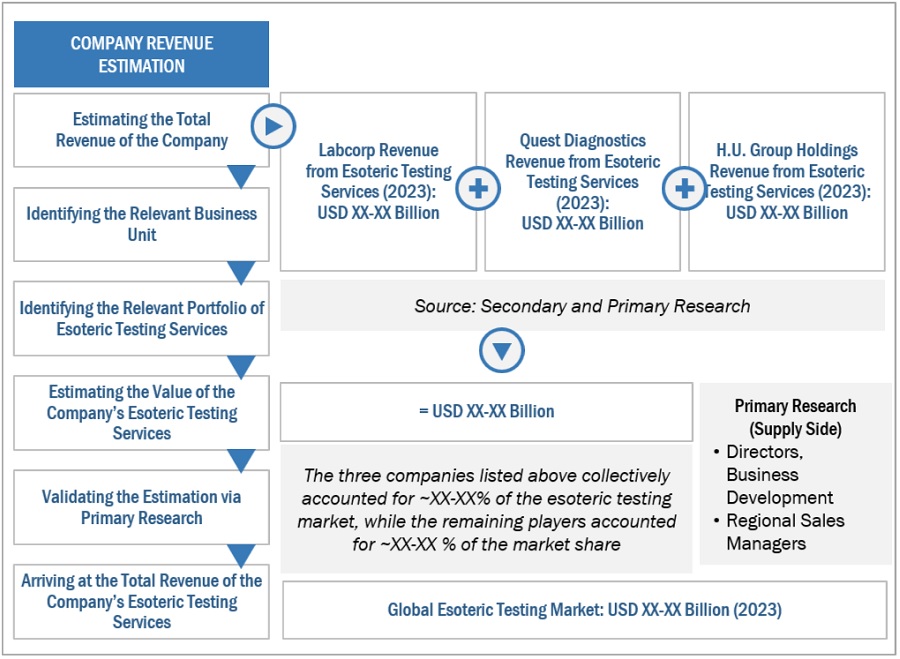
All major service providers offering various esoteric services were identified at the global/regional level. Revenue mapping was done for the major players and was extrapolated to arrive at the global market value of each type of segment. The market value of esoteric testing market was also split into various segments and subsegments at the region and country level based on:

  • Services mapping of various service providers for each type in esoteric testing market at the regional and country-level
  • Relative adoption pattern of each esoteric testing market among key application segments at the regional and/or country-level
  • Detailed primary research to gather qualitative and quantitative information related to segments and subsegments at the regional and/or country level.
  • Detailed secondary research to gauge the prevailing market trends at the regional and/or country level

Global Esoteric Testing Market Size: Bottom Up Approach
Esoteric Testing Market  Size, and Share

To know about the assumptions considered for the study, Request for Free Sample Report

Global Esoteric Testing Market Size: Top-Down Approach

Esoteric Testing Market  Size, and Share

Data Triangulation

After arriving at the overall market size applying the process mentioned above, the total market was split into several segments and subsegments. To complete the overall market engineering process and arrive at the exact statistics for all segments and subsegments, data triangulation and market breakdown procedures were employed, wherever applicable. The data was triangulated by studying various factors and trends from both the demand and supply sides.

Market Definition

Esoteric testing is the diagnosis, detection, or quantitation of rare analytes in a sample. These tests are offered by specialized laboratories equipped with sophisticated diagnostic instruments and reagents, such as reference & independent laboratories and hospital-based laboratories. Many large and medium-sized commercial laboratories, companies, and physician office laboratories outsource these complex tests to reference and independent laboratories. These laboratories are limited in number, and the tests offered are costlier than routine diagnostic tests.

Key Stakeholders

  • Manufacturers and Vendors of Esoteric Testing Instruments and Consumables
  • Esoteric Testing Laboratories and Service Providers
  • Pharmaceutical and Biopharmaceutical Companies
  • Diagnostic Associations
  • Research Associations Involved in the Research of Infectious and Chronic Diseases
  • Various Research and Consulting Firms
  • Distributors of Esoteric Instruments and Consumables
  • Contract Research Manufacturers of Esoteric Testing Consumables
  • Healthcare Institutes
  • Research Institutes

Report Objectives

  • To provide detailed information about the factors influencing the market growth (such as drivers, trends, opportunities, and challenges)
  • To define, describe, segment, and forecast the in esoteric testing market by type, by technology, by specimen, by end user, and by region
  • To analyze market opportunities for stakeholders and provide details of the competitive landscape for key players
  • To analyze micro markets with respect to individual growth trends, prospects, and contributions to the overall esoteric testing market
  • To forecast the size of the esoteric testing market in six main regions along with their respective key countries, namely, North America, Europe, the Asia Pacific, Latin America, Middle East & Africa, and GCC Countries.
  • To profile key players in the esoteric testing market and comprehensively analyze their core competencies and market shares
  • To track and analyze competitive developments, such as service launches; expansions; acquisitions, and collaborations, of the leading players in the esoteric testing market.
  • To benchmark players within the esoteric testing market using the Competitive Leadership Mapping framework, which analyzes market players on various parameters within the broad categories of business and product strategy

Available Customizations

MarketsandMarkets offers the following customizations for this market report

Country Information

  • Additional country-level analysis of the esoteric testing market

Company profiles

  • Additional 3 company profiles of players operating in the esoteric testing market.

Product Analysis

Custom Market Research Services

We will customize the research for you, in case the report listed above does not meet with your exact requirements. Our custom research will comprehensively cover the business information you require to help you arrive at strategic and profitable business decisions.

Request Customization

Instant Answers with GPT - Ask Now!

Ask real questions. Get complete answers !
Report Code
MD 5930
Published ON
Jun, 2024
Choose License Type
BUY NOW
  • SHARE
X
Request Customization
Speak to Analyst
Speak to Analyst
OR FACE-TO-FACE MEETING
PERSONALIZE THIS RESEARCH
  • Triangulate with your Own Data
  • Get Data as per your Format and Definition
  • Gain a Deeper Dive on a Specific Application, Geography, Customer or Competitor
  • Any level of Personalization
REQUEST A FREE CUSTOMIZATION
LET US HELP YOU!
  • What are the Known and Unknown Adjacencies Impacting the Esoteric Testing Market
  • What will your New Revenue Sources be?
  • Who will be your Top Customer; what will make them switch?
  • Defend your Market Share or Win Competitors
  • Get a Scorecard for Target Partners
CUSTOMIZED WORKSHOP REQUEST
+1-888-600-6441
  • Call Us
  • +1-888-600-6441 (Corporate office hours)
  • +1-888-600-6441 (US/Can toll free)
  • +44-800-368-9399 (UK office hours)
CONNECT WITH US
ABOUT TRUST ONLINE
©2024 MarketsandMarkets Research Private Ltd. All rights reserved
DMCA.com Protection Status Website Feedback