Beta-Glucan Market

Beta-Glucan Market by Category (Soluble, Insoluble), Source (Cereal & Grains, Mushroom, Yeast, Seaweed), Application (Food & Beverage, Dietary Supplement, Personal Care, Cosmetics, Pharmaceutical, Animal Feed), Type and Region - Global Forecast to 2029

Report Code: FB 5113 Apr, 2024, by marketsandmarkets.com

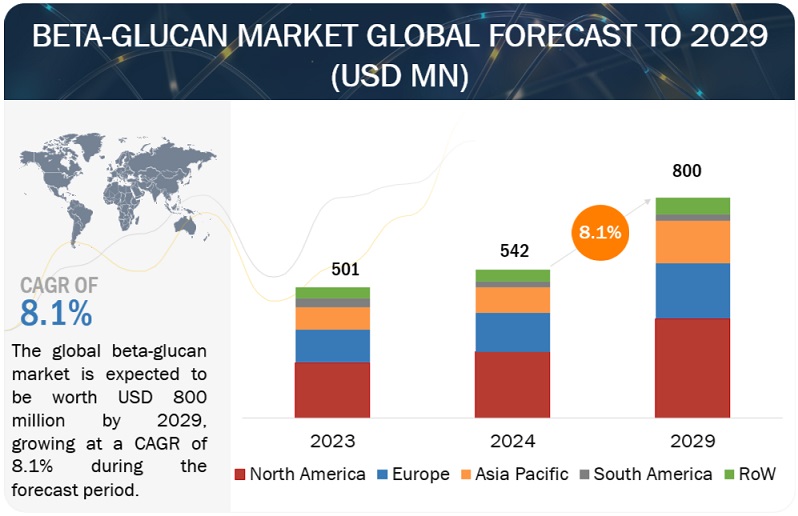
[337 Pages Report] The beta-glucan market is estimated at USD 542 million in 2024; it is projected to grow at a CAGR of 8.1% to reach USD 800 million by 2029. The growing need for nutritional supplements stems from urbanization and the hectic pace of modern life. Consequently, food additives are incorporated into food products to enhance their nutritional value without posing any adverse effects. Both the conventional and organic food sectors are witnessing a surge in demand for natural ingredients. According to a 2022 report by BakeryandSnacks, a prominent online publication in the bakery and snacks industries, natural ingredients are at the forefront of consumer preferences: approximately 47% of global consumers seek natural products, and 55% prioritize natural attributes when purchasing products in at least one category. The demand for natural food additives has surged due to stringent EU regulations that restrict the use of synthetic additives, leading to significant growth in the food additives market. Beta-glucan, sourced from various materials including cereals, grains, yeast, mushrooms, and seaweed, is a safe and naturally occurring potent Biological Response Modifier (BRM) that nutritionally stimulates the immune system. Consequently, there is a rising demand for food products enriched with beta-glucan to support a healthy lifestyle.
Beta-Glucan Market

To know about the assumptions considered for the study, Request for Free Sample Report
Beta-Glucan Market Opportunities

To know about the assumptions considered for the study, download the pdf brochure

Beta-Glucan Market Dynamics

Driver: Beta-glucan's growing role in multiple industrial applications

Beta-glucan has long been recognized for its health-promoting properties, including boosting the immune system, reducing inflammation, and lowering cholesterol. Its versatile applications are expanding beyond the realms of health and nutrition. Recently, there's been a surge of interest in utilizing beta-glucan across diverse industries, transcending its traditional use in food and supplements. For instance, beta-glucan is being explored as an eco-friendly alternative in food packaging, aiming to replace conventional petroleum-derived plastics. Research published in the Journal of Applied Polymer Science in 2020 showcased that films made from beta-glucan exhibited promising mechanical strength. These films could potentially serve as edible coatings for fresh produce, enhancing their shelf life and freshness. Moreover, the European Commission's Joint Research Centre has delved into using beta-glucan as a coating agent for paper-based packaging. This application aims to bolster the packaging's resistance to water and increase its longevity. In line with this innovation, Biopack, a leading food packaging company, introduced a beta-glucan-based coating in 2021. This innovative coating not only enhances the water-resistant and durable properties of paper-based packaging but also aligns with sustainability goals, making packaging more environmentally benign.

Restraint: Price volatility of raw materials

Price instability in raw materials significantly impacts the beta-glucan market. A prime example of this is the fluctuation in oat prices, a key source of beta-glucan, due to weather-related events. For instance, a severe drought in Scandinavia in 2018 led to a substantial increase in oat prices. Consequently, this rise affected the prices of beta-glucan products dependent on oats, making them more costly for consumers. Concurrently, in 2018, the demand-driven price surge for beta-glucan derived from yeast also escalated, particularly in the food and beverage sector.

Drawing a parallel to recent data from the IMF, the volatility in raw material prices remains evident. Barley prices experienced a significant increase from USD 104 per Metric Ton in 2020 to USD 178 per MT in 2021, further rising to USD 225 per MT in 2022. Similarly, oat prices saw an uptick, moving from USD 3 per bushel in 2020 to USD 4.8 per bushel in 2021 and reaching USD 5.5 per bushel in 2022. Such price variations underscore the challenges faced by the beta-glucan market, where changes in raw material costs directly impact the affordability and availability of beta-glucan products for consumers..

Opportunity: Increase in application of beta glucan in different industries

Due to growing research and awareness of its functional benefits, beta-glucan is seeing increased adoption across fast-paced sectors like food & beverage and pharmaceuticals. It finds predominant use in food, nutraceuticals, cosmetics, personal care, and animal feed industries. The rising demand for health-promoting and prebiotic properties in beta-glucan is driving its application in food & beverages and pharmaceuticals. In 2021, Alltech, an animal nutrition company, introduced Optigen, a beta-glucan additive derived from yeast, aimed at boosting the immune system and gut health of poultry.

While beta-glucan has been extensively studied for its potential health advantages, such as immune modulation, anti-inflammatory effects, and cholesterol reduction, recent years have seen increased interest in its application across diverse industries beyond food and supplements. Beta-glucan is being explored as a biodegradable and renewable alternative to petroleum-based plastics in food packaging. A 2020 study in the Journal of Applied Polymer Science highlighted that beta-glucan-based films exhibited favorable mechanical properties, indicating their potential as edible coatings for fruits and vegetables. The European Commission's Joint Research Centre has also delved into using beta-glucan as a paper coating to enhance its water resistance and durability. In 2021, Biopack, a food packaging company, launched a beta-glucan-based coating to improve the water resistance and sustainability of paper-based packaging.

Moreover, beta-glucan's potential in wound healing through tissue regeneration and inflammation reduction has been a subject of study. A 2021 systematic review and meta-analysis published in the International Journal of Biological Macromolecules affirmed that beta-glucan-based dressings effectively foster wound healing in both human and animal trials. The review also highlighted the well-tolerated nature of beta-glucan-based dressings with minimal side effects.

Challenge:Lack of consumer awareness

A major hurdle facing the beta-glucan industry is the limited awareness among consumers and food manufacturers about its potential uses and benefits. This lack of familiarity can restrict the demand for products containing beta-glucan and hinder market expansion. Research illustrates this issue; a 2018 study in the Journal of Nutrition Education and Behavior revealed that while consumers recognized the health advantages of oatmeal, they were less informed about the specific benefits of beta-glucan. The study recommended that raising awareness of beta-glucan's health-promoting properties could stimulate demand for products incorporating this ingredient. Government entities, such as the United States Department of Agriculture (USDA), have a role to play in enhancing beta-glucan awareness by disseminating research on its health benefits, including its potential to lower cholesterol and support heart health. Additionally, the European Food Safety Authority (EFSA) has approved health claims related to beta-glucan, such as its ability to lower blood cholesterol levels.

Beta-Glucan Market Ecosystem

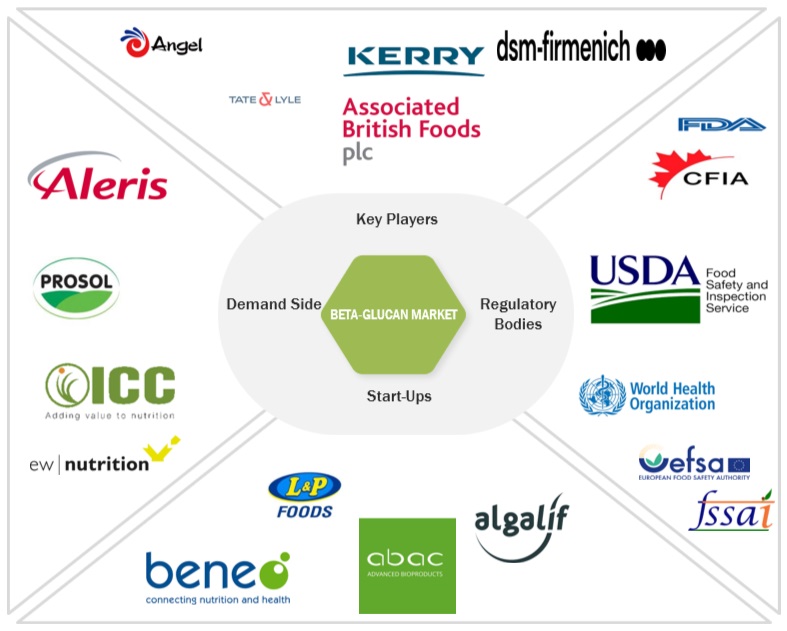
Prominent companies in this market include well-established, financially stable manufacturers of beta-glucan. These companies have been operating in the market for several years and possess a diversified product portfolio, state-of-the-art technologies, and strong global sales and marketing networks. Prominent companies in this market include Tate & Lyle PLC (England), Kerry Group PLC (Ireland), Koninklijke DSM NV (Netherlands), International Flavors & Fragrances INC. (US), Merck (US).
Top Companies in Beta-Glucan Market

Cereals & grains are anticipated to dominate the beta-glucan market in terms of market share.

The market for cereals and grains rich in beta-glucan is projected to experience substantial growth in the forthcoming years, fueled by the escalating consumer demand for healthier and functional foods. Beta-glucan, a dietary fiber present in the cell walls of cereals like oats, barley, and rye, offers various health advantages, including cholesterol reduction, enhanced heart health, and immune system fortification.

Oats stand as the predominant source of beta-glucan, and the demand for oat-based products is anticipated to surge in the coming years. The increasing popularity of oat milk and oat-centric snacks underscores this evolving trend. Additionally, barley and rye, as alternative sources of beta-glucan, are also expected to witness rising demand.

Furthermore, the COVID-19 pandemic has precipitated a change in consumer preferences towards health-enhancing and immune-boosting foods, further amplifying the demand for cereals rich in beta-glucan. In summary, the market for beta-glucan-enriched cereals and grains is poised for significant expansion, driven by the growing consumer inclination towards functional and healthier food options. Industry participants are actively investing in research and development to introduce new products and improve existing ones, thereby stimulating market growth. Companies are innovating by formulating blends of beta-glucan with other ingredients to craft distinctive products with augmented health benefits. For example, in 2019, Kellogg's unveiled "Hi! Happy Inside" breakfast cereal, touted as a digestive wellness product featuring beta-glucan from wheat as a key component.

The soluble category in the beta-glucan market is forecasted to register the most significant CAGR over the projected period.

Soluble beta-glucan, a form of soluble fiber present in various foods like oats, barley, and mushrooms, offers a range of health advantages. These benefits include lowering cholesterol levels, enhancing immune system functionality, and potentially decreasing the likelihood of certain cancers.

The escalating demand for soluble beta-glucan can be attributed to the growing body of scientific research supporting its health-promoting properties. For instance, a 2022 review published in the Nutrients journal revealed that the consumption of beta-glucan from oats or barley can lead to reductions in both total and LDL cholesterol levels, which are key risk factors for cardiovascular diseases. Furthermore, the study suggested that beta-glucan might also provide additional cardiovascular benefits, such as mitigating inflammation and enhancing endothelial function.

The food & beverage segment is projected to dominate the market based on application.

Consuming beta-glucan has been associated with various health advantages, including lowering the risk of chronic conditions such as diabetes, heart disease, and specific types of cancer. The US FDA has endorsed health claims related to beta-glucan, indicating that "soluble fiber from certain foods like oats and barley, when part of a diet low in saturated fat and cholesterol, can potentially reduce the risk of heart disease." In 2021, the Swedish oat milk brand Oatly introduced a new range of beta-glucan-fortified oat milk products in the US market. Branded as "Oatly+ Beta-Glucan," these products are promoted for their potential to enhance heart health and overall well-being. Consequently, the rising demand for beta-glucan in the food and beverage sector is fueled by the growing recognition of its health benefits, especially in preventing and managing chronic illnesses.

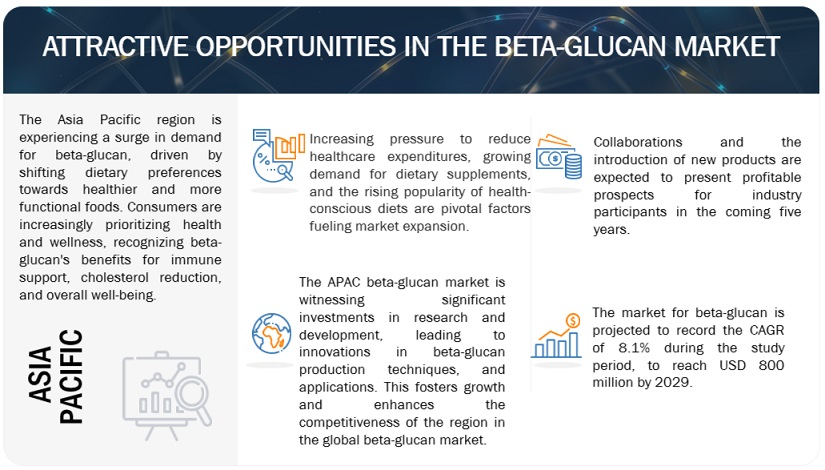
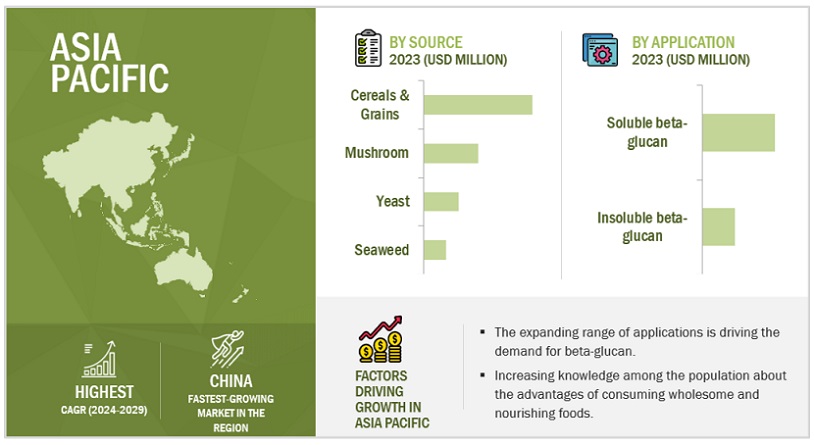
The Asia Pacific region is anticipated to experience the most rapid growth between 2024 and 2029.

The beta-glucan market has been analyzed across regions including North America, Europe, Asia Pacific, South America, and the Rest of the World. In the Asia Pacific region, the beta-glucan market is propelled by innovations and advancements in beta-glucan-based food, beverage, industrial, and healthcare products. This growth trend is prompting local Asian firms to diversify their product offerings with beta-glucan, aiming to achieve substantial revenue growth. Additionally, the expanding market in the region.

Major players operating in the Tate & Lyle PLC (UK), Kerry Group plc (Ireland), dsm-firmenich (Switzerland), Merck (Germany), Lesaffre  (France), Kemin Industries (US), Angel Yeast Co. Ltd (China), Lallemand (Canada), Associated British Foods Plc (UK), Biorigin (Brazil), Ceapro Inc. (Canada), Specialty Biotech Co., Ltd. (US), Alltech (US), Garuda International Inc. (US), and Leiber (Germany).

Other players in the market include VW-Ingredients (Netherlands), Super Beta Glucan(US), GlycaNova AS  (Norway), NutriScience Innovations, LLC (US), Algalíf Iceland hf. (Iceland), ABAC R&D  (Switzerland), Natural Biologics (New Zealand), BENEO (Germany), L&P Food Ingredient Co., Ltd. (China), Beta Bio Technology sp. z o. o (Poland).
North American Beta-Glucan Market Size, and Share

Key Market Players 

Key Market Players in this include Tate & Lyle PLC (London), Kerry Group PLC (Ireland), DSM Firmenich (Switzerland), Merck (US), Kemin Industries (US), Alltech (US), AngelYeast Co., Ltd (China), Lallemand Inc. (Canada),  Leiber (Germany), Lesaffre (France) Associated British Foods Plc (UK), Biorigin (Brazil), Ceapro Inc. (Canada), Specialty Biotech Co., Ltd. (US), Alltech (US), Garuda International Inc. (US), and Leiber (Germany).

Other players include VW-Ingredients (Netherlands), Super Beta Glucan(US), GlycaNova AS  (Norway), NutriScience Innovations, LLC (US), Algalíf Iceland hf. (Iceland), ABAC R&D  (Switzerland), Natural Biologics (New Zealand), BENEO (Germany), L&P Food Ingredient Co., Ltd. (China), Beta Bio Technology sp. z o. o (Poland).

  These players in this market are focusing on increasing their presence through agreements and collaborations. These companies have a strong presence in North America, Asia Pacific, and Europe. They also have manufacturing facilities along with strong distribution networks across these regions.

Get online access to the report on the World's First Market Intelligence Cloud

  • Easy to Download Historical Data & Forecast Numbers
  • Company Analysis Dashboard for high growth potential opportunities
  • Research Analyst Access for customization & queries
  • Competitor Analysis with Interactive dashboard
  • Latest News, Updates & Trend analysis
Request Sample

Scope of the Report

:

Report Metric

Details

Market size estimation

2024–2029

Base year considered

2023

Forecast period considered

2024–2029

Units considered

Value (USD), Volume (Ton)

Segments Covered

By Source, by Application, by Category, by Type, by Extraction method (Qualitative) And Region

Regions covered

North America, Europe, Asia Pacific, South America, and RoW

Companies studied

Key Players:

  • Tate & Lyle PLC (UK)
  • Kerry Group PLC (Ireland)
  • dsm-firmenich (Switzerland)
  • Associated British Foods plc (UK)
  • Alltech (US)
  • AngelYeast Co., Ltd (China)
  • Lallemand Inc. (Canada)
  • Leiber (Germany)
  • Lesaffre (France) 
  • Merck (Germany)
  • Ceapro Inc. (Canada)
  • Biorigin (Brazil)
  • Kemin Industries, Inc (US)
  • Specialty Biotech Co., Ltd (Thailand)
  • Garuda International Inc. (US)

Other Players:

  • VW-Ingredients (Netherlands)
  • Super Beta Glucan (US)
  • GlycaNova AS (Norway)
  • NutriScience Innovations, LLC (US)
  • Algalíf Iceland hf. (Iceland)
  • ABAC R&D (Switzerland)
  • Natural Biologics (New Zealand)
  • BENEO (Germany)
  • L&P Food Ingredient Co., Ltd. (China)
  • Beta Bio Technology sp. z o. o (Poland)

This research report categorizes the beta-glucan market based on source, application, category, type, extraction method (qualitative), and region.

Beta-glucan market:

By Source
  • Cereals & Grains
    • Oats
    • Barley
    • Other Sources
  • Mushroom
  • Yeast
  • Seaweed
By Application
  • Food & Beverages
  • Personal Care
  • Cosmetics
  • Pharmaceuticals
  • Dietary Supplements
  • Animal Feed
    • Livestock
    • Pets
By Category
  • Soluble Beta-glucan
  • Insoluble Beta-glucan
By Type
  • (1,3) Beta-glucan
  • (1,4) Beta-glucan
  • (1,6) Beta-glucan
By Extraction Method (Qualitative)
  • Beta-glucan from Cereals
  • Beta-glucan from Yeast 
Region
  • North America
  • Europe
  • Asia-Pacific
  • South America
  • RoW

Recent Developments

  • In June 2023, Kemin Industries has received approval from the Thai Food and Drug Administration (TFDA) for its immune support ingredient, BetaVia Complete, as a Novel Food in Thailand. BetaVia Complete is derived from Kemin’s proprietary strain of algae, Euglena gracilis, which is rich in beta-1,3-glucan, protein, and essential fatty acids. The TFDA has approved its use in food supplements at a dosage of 375 milligrams per day after conducting a thorough safety evaluation.
  • In December 2022, Kemin Industries expanded its production facility in Cavriago, demonstrating the company's dedication to innovation and sustainability in animal nutrition and health. With these new additions, Kemin aims to meet the rising demand for premium-quality beta-glucan products and further foster innovation in this crucial sector.
  • In January 2022, DSM introduced an integrated Food & Beverage operating structure that consolidates three segments of its nutrition business: Food Specialties, Hydrocolloids, and a portion of its Nutritional Products Group. The newly formed Food & Beverage division aims to guide consumers in making choices that balance taste, texture, and health. This strategic move aligns with DSM's objective to evolve into a fully dedicated Health, Nutrition & Bioscience company, building on its announcement from September 2021.
  • In June 2020, Lesaffre acquired a majority stake in the Chinese firm, Biohymn Biotechnology, a specialized producer of yeast and yeast extracts. With an eye on its expansion plans and to tap into the Chinese market, Lesaffre made this significant investment. This move aligns perfectly with Lesaffre Human Care's strategy to bolster its footprint in China and enhance its proximity to clients.
  • in December 2021, Angel Yeast commenced its yeast product expansion project, targeting an annual output of 20,000 tons. Undertaken by China National Chemical Engineering NO.16 Construction Co., Ltd., this expansion is slated for completion by May 2024. The project aims to significantly boost the company's total production capacity.

Frequently Asked Questions (FAQ):

To speak to our analyst for a discussion on the above findings, click Speak to Analyst

TABLE OF CONTENTS
 
1 INTRODUCTION (Page No. - 44)
    1.1 STUDY OBJECTIVES 
    1.2 MARKET DEFINITION 
    1.3 STUDY SCOPE 
           1.3.1 MARKET SEGMENTATION
           1.3.2 INCLUSIONS AND EXCLUSIONS
           1.3.3 REGIONS COVERED
           1.3.4 YEARS CONSIDERED
    1.4 CURRENCY CONSIDERED 
           TABLE 1 USD EXCHANGE RATES, 2019–2023
    1.5 UNIT CONSIDERED 
    1.6 STAKEHOLDERS 
    1.7 SUMMARY OF CHANGES 
           1.7.1 IMPACT OF RECESSION
 
2 RESEARCH METHODOLOGY (Page No. - 50)
    2.1 RESEARCH DATA 
           FIGURE 1 BETA-GLUCAN MARKET: RESEARCH DESIGN
           2.1.1 SECONDARY DATA
                    2.1.1.1 Key data from secondary sources
           2.1.2 PRIMARY DATA
                    2.1.2.1 Key data from primary sources
                    2.1.2.2 Breakdown of primary profiles
                               FIGURE 2 BREAKDOWN OF PRIMARY INTERVIEWS: BY COMPANY TYPE, DESIGNATION, AND REGION
                    2.1.2.3 Key insights from industry experts
    2.2 MARKET SIZE ESTIMATION 
           2.2.1 TOP-DOWN APPROACH
                    FIGURE 3 MARKET SIZE ESTIMATION METHODOLOGY: TOP-DOWN APPROACH
           2.2.2 SUPPLY-SIDE ANALYSIS
                    FIGURE 4 BETA-GLUCAN MARKET SIZE CALCULATION: SUPPLY SIDE
           2.2.3 BOTTOM-UP APPROACH (DEMAND SIDE)
                    FIGURE 5 MARKET SIZE ESTIMATION METHODOLOGY: BOTTOM-UP APPROACH
    2.3 DATA TRIANGULATION AND MARKET BREAKUP 
           FIGURE 6 DATA TRIANGULATION
    2.4 RESEARCH ASSUMPTIONS 
    2.5 LIMITATIONS AND RISK ASSESSMENT 
    2.6 RECESSION IMPACT ANALYSIS 
           2.6.1 MACRO-INDICATORS OF RECESSION
                    FIGURE 7 RECESSION INDICATORS
                    FIGURE 8 GLOBAL INFLATION RATE, 2011–2022
                    FIGURE 9 GLOBAL GDP, 2011–2022 (USD TRILLION)
                    FIGURE 10 RECESSION INDICATORS AND THEIR IMPACT ON BETA-GLUCAN MARKET
                    FIGURE 11 GLOBAL BETA-GLUCAN MARKET: EARLIER FORECAST VS. RECESSION FORECAST
 
3 EXECUTIVE SUMMARY (Page No. - 65)
    TABLE 2 BETA-GLUCAN MARKET SHARE SNAPSHOT, 2024 VS. 2029 (USD MILLION) 
    FIGURE 12 BETA-GLUCAN MARKET, BY SOURCE, 2024 VS. 2029 (USD MILLION) 
    FIGURE 13 BETA-GLUCAN MARKET, BY CATEGORY, 2024 VS. 2029 (USD MILLION) 
    FIGURE 14 BETA-GLUCAN MARKET, BY TYPE, 2024 VS. 2029 (USD MILLION) 
    FIGURE 15 BETA-GLUCAN MARKET, BY APPLICATION, 2024 VS. 2029 (USD MILLION) 
    FIGURE 16 BETA-GLUCAN MARKET SHARE AND GROWTH RATE, BY REGION, 2024 (BY VALUE) 
 
4 PREMIUM INSIGHTS (Page No. - 70)
    4.1 ATTRACTIVE OPPORTUNITIES FOR PLAYERS IN BETA-GLUCAN MARKET 
           FIGURE 17 CONSUMER PREFERENCES FOR HEALTHY AND NUTRITIONAL PROTEIN TO DRIVE BETA-GLUCAN MARKET
    4.2 ASIA PACIFIC: BETA-GLUCAN MARKET, BY CATEGORY AND COUNTRY 
           FIGURE 18 CHINA AND SOLUBLE SEGMENT TO ACCOUNT FOR SIGNIFICANT SHARES IN 2024
    4.3 BETA-GLUCAN MARKET, BY TYPE 
           FIGURE 19 (1,3 BETA-GLUCAN) SEGMENT TO ACCOUNT FOR LARGEST MARKET DURING FORECAST PERIOD
    4.4 BETA-GLUCAN MARKET, BY SOURCE 
           FIGURE 20 CEREALS & GRAINS SEGMENT TO LARGEST MARKET DURING FORECAST PERIOD
    4.5 BETA-GLUCAN MARKET, BY CATEGORY 
           FIGURE 21 SOLUBLE SEGMENT TO ACCOUNT FOR LARGER MARKET DURING FORECAST PERIOD
    4.6 BETA-GLUCAN MARKET, BY APPLICATION 
           FIGURE 22 FOOD & BEVERAGES SEGMENT TO ACCOUNT FOR LARGEST MARKET DURING FORECAST PERIOD
    4.7 BETA-GLUCAN MARKET, BY CATEGORY AND REGION 
           FIGURE 23 SOLUBLE SEGMENT TO LEAD ACROSS ALL REGIONAL MARKETS DURING FORECAST PERIOD
    4.8 BETA-GLUCAN MARKET: REGIONAL SNAPSHOT 
           FIGURE 24 US TO DOMINATE BETA-GLUCAN MARKET IN 2024
 
5 MARKET OVERVIEW (Page No. - 76)
    5.1 INTRODUCTION 
    5.2 MACROECONOMIC INDICATORS 
           5.2.1 RISING GLOBAL DOMESTIC PRODUCT AND POPULATION GROWTH TO DRIVE APPETITE FOR BETA-GLUCAN
                    FIGURE 25 GLOBAL POPULATION GROWTH, 1950–2050 (BILLION)
                    FIGURE 26 GDP GROWTH, 2016–2022 (TRILLION)
           5.2.2 RISING HEALTH CONCERNS AND GROWTH IN DISEASES
                    FIGURE 27 PERCENTAGE POPULATION OF CANCER PATIENTS, BY REGION, 2022
           5.2.3 INCREASE IN CONSUMPTION OF DIETARY FIBERS
    5.3 MARKET DYNAMICS 
           FIGURE 28 BETA-GLUCAN MARKET: DRIVERS, RESTRAINTS, OPPORTUNITIES, AND CHALLENGES
           5.3.1 DRIVERS
                    5.3.1.1 Growth in health consciousness and increasing health expenditure
                               FIGURE 29 GLOBAL OECD HEALTH SPENDING AS SHARE OF GLOBAL DOMESTIC PRODUCT, 2017–2021
                    5.3.1.2 Increasing research and application of beta-glucan in fast-moving industries
           5.3.2 RESTRAINTS
                    5.3.2.1 Inconsistency in regulatory norms governing beta-glucan
                    5.3.2.2 Price volatility of raw materials
           5.3.3 OPPORTUNITIES
                    5.3.3.1 Growing demand for natural and plant-based ingredients
                    5.3.3.2 Demand for personalized nutrition and tailored beta-glucan products
                    5.3.3.3 Untapped beta-glucan applications
           5.3.4 CHALLENGES
                    5.3.4.1 Lack of consumer awareness regarding benefits of beta-glucan
                    5.3.4.2 High research and development costs
 
6 INDUSTRY TRENDS (Page No. - 85)
    6.1 INTRODUCTION 
    6.2 SUPPLY CHAIN ANALYSIS 
           FIGURE 30 BETA-GLUCAN MARKET: SUPPLY CHAIN ANALYSIS
    6.3 VALUE CHAIN ANALYSIS 
           FIGURE 31 BETA-GLUCAN MARKET: VALUE CHAIN ANALYSIS
           6.3.1 RESEARCH & DEVELOPMENT
           6.3.2 RAW MATERIAL SOURCING
           6.3.3 PRODUCTION
           6.3.4 DISTRIBUTION
           6.3.5 END USERS
    6.4 TRADE ANALYSIS 
           6.4.1 IMPORT SCENARIO OF YEAST
                    FIGURE 32 HS CODE 2102: IMPORT VALUE OF YEAST, BY KEY COUNTRY, 2019–2023
                    TABLE 3 HS CODE 2102: IMPORT SCENARIO OF YEAST, BY COUNTRY, 2022 (USD)
           6.4.2 EXPORT SCENARIO OF YEAST
                    FIGURE 33 HS CODE 2102: EXPORT VALUE OF YEAST, BY KEY COUNTRY, 2019–2023
                    TABLE 4 HS CODE 2102: EXPORT SCENARIO OF YEAST, BY COUNTRY, 2022 (USD)
           6.4.3 IMPORT SCENARIO OF MUSHROOMS
                    FIGURE 34 HS CODE 2003: IMPORT VALUE OF MUSHROOMS, BY KEY COUNTRY, 2019–2023
                    TABLE 5 HS CODE 2003: IMPORT SCENARIO OF MUSHROOMS, BY COUNTRY, 2022 (USD)
           6.4.4 EXPORT SCENARIO OF MUSHROOMS
                    FIGURE 35 HS CODE 2003: EXPORT VALUE OF MUSHROOMS, BY KEY COUNTRY, 2019–2023
                    TABLE 6 HS CODE 2003: EXPORT SCENARIO OF MUSHROOMS, BY COUNTRY, 2022 (USD)
           6.4.5 IMPORT SCENARIO OF OATS
                    FIGURE 36 HS CODE 1004: IMPORT VALUE OF OATS, BY KEY COUNTRY, 2019–2023
                    TABLE 7 HS CODE 1004: IMPORT SCENARIO OF OATS, BY COUNTRY, 2022 (USD)
           6.4.6 EXPORT SCENARIO OF OATS
                    FIGURE 37 HS CODE 1004: EXPORT VALUE OF OATS, BY KEY COUNTRY, 2019–2023
                    TABLE 8 HS CODE 1004: EXPORT SCENARIO OF OATS, BY COUNTRY, 2022 (USD)
           6.4.7 IMPORT SCENARIO OF BARLEY
                    FIGURE 38 HS CODE 1003: IMPORT VALUE OF BARLEY, BY KEY COUNTRY, 2019–2023
                    TABLE 9 HS CODE 1003: IMPORT SCENARIO OF BARLEY, BY COUNTRY, 2022 (USD)
           6.4.8 EXPORT SCENARIO OF BARLEY
                    FIGURE 39 HS CODE 1003: EXPORT VALUE OF BARLEY, BY KEY COUNTRY, 2019–2023
                    TABLE 10 HS CODE 1003: EXPORT SCENARIO OF BARLEY, BY COUNTRY, 2022 (USD)
    6.5 TECHNOLOGY ANALYSIS 
           6.5.1 KEY TECHNOLOGIES
                    6.5.1.1 Encapsulation
           6.5.2 COMPLEMENTARY TECHNOLOGIES
                    6.5.2.1 High-purity yeast beta-glucan technology
           6.5.3 ADJACENT TECHNOLOGIES
                    6.5.3.1 New avenues for yeast culture and extraction
    6.6 PRICING ANALYSIS 
           6.6.1 AVERAGE SELLING PRICE TREND, BY REGION
                    TABLE 11 BETA-GLUCAN MARKET: AVERAGE SELLING PRICE TREND, BY REGION, 2023–2029 (USD/TONS)
           6.6.2 AVERAGE SELLING PRICE TREND, BY SOURCE
                    TABLE 12 BETA-GLUCAN MARKET: AVERAGE SELLING PRICE TREND, BY SOURCE, 2023–2029 (USD/TONS)
                    FIGURE 40 AVERAGE SELLING PRICE TREND, BY SOURCE (USD/TONS)
    6.7 ECOSYSTEM/MARKET MAP 
           6.7.1 DEMAND SIDE
           6.7.2 SUPPLY SIDE
                    FIGURE 41 KEY PLAYERS IN BETA-GLUCAN MARKET ECOSYSTEM
                    TABLE 13 BETA-GLUCAN MARKET: ECOSYSTEM
    6.8 TRENDS/DISRUPTIONS IMPACTING CUSTOMERS’ BUSINESSES 
           FIGURE 42 REVENUE SHIFT FOR BETA-GLUCAN MARKET VENDORS
    6.9 PATENT ANALYSIS 
           TABLE 14 LIST OF MAJOR PATENTS PERTAINING TO BETA-GLUCAN MARKET, 2014–2024
           FIGURE 43 NUMBER OF PATENTS GRANTED FOR BETA-GLUCAN, 2014–2023
           FIGURE 44 REGIONAL ANALYSIS OF PATENTS GRANTED FOR BETA-GLUCAN
    6.10 KEY CONFERENCES AND EVENTS 
           TABLE 15 BETA-GLUCAN MARKET: LIST OF KEY CONFERENCES AND EVENTS, 2024
    6.11 REGULATORY LANDSCAPE 
           6.11.1 LIST OF REGULATORY BODIES, GOVERNMENT AGENCIES, AND OTHER ORGANIZATIONS
                    6.11.1.1 North America
                               TABLE 16 NORTH AMERICA: LIST OF REGULATORY BODIES, GOVERNMENT AGENCIES, AND OTHER ORGANIZATIONS
                    6.11.1.2 Europe
                               TABLE 17 EUROPE: LIST OF REGULATORY BODIES, GOVERNMENT AGENCIES, AND OTHER ORGANIZATIONS
                    6.11.1.3 Asia Pacific
                               TABLE 18 ASIA PACIFIC: LIST OF REGULATORY BODIES, GOVERNMENT AGENCIES, AND OTHER ORGANIZATIONS
                    6.11.1.4 RoW
                               TABLE 19 ROW: LIST OF REGULATORY BODIES, GOVERNMENT AGENCIES, AND OTHER ORGANIZATIONS
           6.11.2 REGULATORY FRAMEWORK
                    6.11.2.1 Introduction
                    6.11.2.2 North America
                               6.11.2.2.1 US Food and Drug Administration (21CFR101.14)
                               6.11.2.2.2 US Food and Drug Administration (21CFR101.81)
                    6.11.2.3 European Food Safety Authority
                               6.11.2.3.1 European Union
    6.12 PORTER’S FIVE FORCES’ ANALYSIS 
                    TABLE 20 PORTER’S FIVE FORCES’ IMPACT ON BETA-GLUCAN MARKET
           6.12.1 THREAT OF NEW ENTRANTS
           6.12.2 THREAT OF SUBSTITUTES
           6.12.3 BARGAINING POWER OF SUPPLIERS
           6.12.4 BARGAINING POWER OF BUYERS
           6.12.5 INTENSITY OF COMPETITIVE RIVALRY
    6.13 KEY STAKEHOLDERS AND BUYING CRITERIA 
           6.13.1 KEY STAKEHOLDERS IN BUYING PROCESS
                    FIGURE 45 INFLUENCE OF STAKEHOLDERS ON BUYING PROCESS FOR TOP APPLICATIONS
                    TABLE 21 INFLUENCE OF STAKEHOLDERS ON BUYING PROCESS FOR TOP APPLICATIONS
           6.13.2 BUYING CRITERIA
                    TABLE 22 KEY BUYING CRITERIA FOR TOP APPLICATIONS
                    FIGURE 46 KEY BUYING CRITERIA FOR TOP APPLICATIONS
    6.14 CASE STUDY ANALYSIS 
           6.14.1 CARGILL INVESTED USD 35 MILLION TO PRODUCE SOLUBLE FIBERS THAT MEET CONSUMER DEMAND FOR HEALTHY PRODUCTS
           6.14.2 TATE & LYLE ENTERED INTO PARTNERSHIP WITH SOLEVO TO DISTRIBUTE WIDE RANGE OF PRODUCTS AND TAP UNTAPPED OPPORTUNITIES
    6.15 BETA-GLUCAN PURITY ANALYSIS 
           6.15.1 ACIDIC EXTRACTION
           6.15.2 ALKALINE EXTRACTION
           6.15.3 WATER EXTRACTION
           6.15.4 ENZYMATIC EXTRACTION
 
7 BETA-GLUCAN MARKET, BY EXTRACTION METHOD (Page No. - 116)
    7.1 INTRODUCTION 
           TABLE 23 BETA-GLUCAN YIELDS AND PRODUCTION TECHNOLOGIES FROM VARIOUS SOURCES
    7.2 BETA-GLUCAN FROM CEREALS 
    7.3 BETA-GLUCAN FROM YEAST 
 
8 BETA-GLUCAN MARKET, BY APPLICATION (Page No. - 118)
    8.1 INTRODUCTION 
           TABLE 24 APPLICATION OVERVIEW
           FIGURE 47 BETA-GLUCAN MARKET, BY APPLICATION, 2024 VS. 2029 (USD MILLION)
           TABLE 25 BETA-GLUCAN MARKET: BY APPLICATION, 2019–2023 (USD MILLION)
           TABLE 26 BETA-GLUCAN MARKET, BY APPLICATION, 2024–2029 (USD MILLION)
    8.2 FOOD & BEVERAGES 
           8.2.1 INCREASING AWARENESS OF HEALTH BENEFITS IN PREVENTING AND MANAGING CHRONIC DISEASES TO DRIVE DEMAND FOR BETA-GLUCAN
                    TABLE 27 FOOD & BEVERAGES: BETA-GLUCAN MARKET, BY REGION, 2019–2023 (USD MILLION)
                    TABLE 28 FOOD & BEVERAGES: BETA-GLUCAN MARKET, BY REGION, 2024–2029 (USD MILLION)
    8.3 PERSONAL CARE 
           8.3.1 GROWING CONSUMER DEMAND FOR NATURAL AND HEALTHY PRODUCTS AND AWARENESS REGARDING SKIN HEALTH TO PROPEL MARKET
                    TABLE 29 PERSONAL CARE: BETA-GLUCAN MARKET, BY REGION, 2019–2023 (USD MILLION)
                    TABLE 30 PERSONAL CARE: BETA-GLUCAN MARKET, BY REGION, 2024–2029 (USD MILLION)
                    8.3.1.1 By form
                               8.3.1.1.1 Creams
                               8.3.1.1.2 Lotions
                               8.3.1.1.3 Other personal care forms
                               TABLE 31 PERSONAL CARE: BETA-GLUCAN MARKET, BY FORM, 2019–2023 (USD MILLION)
                               TABLE 32 PERSONAL CARE: BETA-GLUCAN MARKET, BY FORM, 2024–2029 (USD MILLION)
                    8.3.1.2 By functionality
                               8.3.1.2.1 Spot reduction
                               8.3.1.2.2 Skin treatment/Wound healing
                               8.3.1.2.3 Skin moisturization & hydration
                               8.3.1.2.4 Anti-irritation/Anti-inflammatory
                               8.3.1.2.5 Collagen stimulation & anti-aging
                               8.3.1.2.6 Other personal care functionalities
                               TABLE 33 PERSONAL CARE: BETA-GLUCAN MARKET, BY FUNCTIONALITY, 2019–2023 (USD MILLION)
                               TABLE 34 PERSONAL CARE: BETA-GLUCAN MARKET, BY FUNCTIONALITY, 2024–2029 (USD MILLION)
    8.4 COSMETICS 
           8.4.1 BETA-GLUCAN TO IMPROVE SPREADABILITY OF FORMULATIONS AND ENHANCE THEIR ADHERENCE TO SKIN
                    TABLE 35 COSMETICS: BETA-GLUCAN MARKET, BY REGION, 2019–2023 (USD MILLION)
                    TABLE 36 COSMETICS: BETA-GLUCAN MARKET, BY REGION, 2024–2029 (USD MILLION)
                    8.4.1.1 By form
                               8.4.1.1.1 Creams
                               8.4.1.1.2 Lotions
                               8.4.1.1.3 Other cosmetics forms
                               TABLE 37 COSMETICS: BETA-GLUCAN MARKET, BY FORM, 2019–2023 (USD MILLION)
                               TABLE 38 COSMETICS: BETA-GLUCAN MARKET, BY FORM, 2024–2029 (USD MILLION)
                    8.4.1.2 By functionality
                               8.4.1.2.1 UV protection
                               8.4.1.2.2 Barrier enhancement
                               8.4.1.2.3 Skin moisturization & hydration
                               8.4.1.2.4 Collagen stimulation & anti-aging
                               8.4.1.2.5 Other cosmetics functionalities
                               TABLE 39 COSMETICS: BETA-GLUCAN MARKET, BY FUNCTIONALITY, 2019–2023 (USD MILLION)
                               TABLE 40 COSMETICS: BETA-GLUCAN MARKET, BY FUNCTIONALITY, 2024–2029 (USD MILLION)
    8.5 PHARMACEUTICALS 
           8.5.1 GOVERNMENT INVESTMENT IN BENEFITS OF BETA-GLUCAN IN PHARMACEUTICAL APPLICATIONS TO SPUR MARKET
                    TABLE 41 PHARMACEUTICALS: BETA-GLUCAN MARKET, BY REGION, 2019–2023 (USD MILLION)
                    TABLE 42 PHARMACEUTICALS: BETA-GLUCAN MARKET, BY REGION, 2024–2029 (USD MILLION)
    8.6 DIETARY SUPPLEMENTS 
           8.6.1 NEED FOR IMMUNE SYSTEM SUPPORT, CHOLESTEROL REDUCTION, AND IMPROVED GUT HEALTH TO FUEL DEMAND FOR BETA-GLUCAN
                    TABLE 43 DIETARY SUPPLEMENTS: BETA-GLUCAN MARKET, BY REGION, 2019–2023 (USD MILLION)
                    TABLE 44 DIETARY SUPPLEMENTS: BETA-GLUCAN MARKET, BY REGION, 2024–2029 (USD MILLION)
    8.7 ANIMAL FEED 
           8.7.1 BETA-GLUCAN TO IMPROVE GROWTH AND FEED EFFICIENCY IN LIVESTOCK AND HELP THEM RESIST INFECTIONS AND DISEASES
                    TABLE 45 ANIMAL FEED: BETA-GLUCAN MARKET, BY REGION, 2019–2023 (USD MILLION)
                    TABLE 46 ANIMAL FEED: BETA-GLUCAN MARKET, BY REGION, 2024–2029 (USD MILLION)
                    TABLE 47 ANIMAL FEED: BETA-GLUCAN MARKET, BY SUB-APPLICATION, 2019–2023 (USD MILLION)
                    TABLE 48 ANIMAL FEED: BETA-GLUCAN MARKET, BY SUB-APPLICATION, 2024–2029 (USD MILLION)
                    8.7.1.1 Pets
                    8.7.1.2 Livestock
 
9 BETA-GLUCAN MARKET, BY BRAND (Page No. - 135)
    9.1 INTRODUCTION 
    9.2 EPICOR 
    9.3 BETAVIA 
    9.4 M-GARD 
    9.5 AVENACARE 
    9.6 AB BIOTEK HUMAN NUTRITION AND HEALTH 
    9.7 YESTIMUN 
    9.8 BENICAROS 
    9.9 IMMUDYNE NUTRITIONAL PUREMUNE 
    9.10 WELLMUNE 
    9.11 OTHER BRANDS 
           9.11.1 OATWELL
           9.11.2 PROMOAT
           9.11.3 SANACEL
           9.11.4 AVENACARE
           9.11.5 NUTRIM
 
10 BETA-GLUCAN MARKET, BY CATEGORY (Page No. - 139)
     10.1 INTRODUCTION 
               FIGURE 48 BETA-GLUCAN MARKET, BY CATEGORY, 2024 VS. 2029 (USD MILLION)
               TABLE 49 BETA-GLUCAN MARKET, BY CATEGORY, 2019–2023 (USD MILLION)
               TABLE 50 BETA-GLUCAN MARKET, BY CATEGORY, 2024–2029 (USD MILLION)
     10.2 SOLUBLE BETA-GLUCAN 
             10.2.1 SOLUBLE BETA-GLUCAN TO REDUCE CHOLESTEROL LEVELS AND IMPROVE IMMUNE FUNCTION
                       TABLE 51 SOLUBLE: BETA-GLUCAN MARKET, BY REGION, 2019–2023 (USD MILLION)
                       TABLE 52 SOLUBLE: BETA-GLUCAN MARKET, BY REGION, 2024–2029 (USD MILLION)
     10.3 INSOLUBLE BETA-GLUCAN 
             10.3.1 INSOLUBLE BETA-GLUCAN TO MAINTAIN HEALTHY DIGESTIVE SYSTEM BY FACILITATING SMOOTH MOVEMENT OF FOOD THROUGH DIGESTIVE TRACT
                       TABLE 53 INSOLUBLE: BETA-GLUCAN MARKET, BY REGION, 2019–2023 (USD MILLION)
                       TABLE 54 INSOLUBLE: BETA-GLUCAN MARKET, BY REGION, 2024–2029 (USD MILLION)
 
11 BETA-GLUCAN MARKET, BY SOURCE (Page No. - 144)
     11.1 INTRODUCTION 
               FIGURE 49 BETA-GLUCAN MARKET, BY SOURCE, 2024 VS. 2029 (USD MILLION)
               TABLE 55 BETA-GLUCAN MARKET, BY SOURCE, 2019–2023 (USD MILLION)
               TABLE 56 BETA-GLUCAN MARKET, BY SOURCE, 2024–2029 (USD MILLION)
               TABLE 57 BETA-GLUCAN MARKET, BY SOURCE, 2019–2023 (TONS)
               TABLE 58 BETA-GLUCAN MARKET, BY SOURCE, 2024–2029 (TONS)
     11.2 CEREALS & GRAINS 
             11.2.1 NEED FOR REDUCING CHOLESTEROL LEVELS, IMPROVING HEART HEALTH, AND BOOSTING IMMUNE SYSTEM TO DRIVE MARKET
                       TABLE 59 CEREALS & GRAINS: BETA-GLUCAN MARKET, BY REGION, 2019–2023 (USD MILLION)
                       TABLE 60 CEREALS & GRAINS: BETA-GLUCAN MARKET, BY REGION, 2024–2029 (USD MILLION)
                       TABLE 61 CEREALS & GRAINS: BETA-GLUCAN MARKET, BY REGION, 2019–2023 (TONS)
                       TABLE 62 CEREALS & GRAINS: BETA-GLUCAN MARKET, BY REGION, 2024–2029 (TONS)
     11.3 MUSHROOMS 
             11.3.1 GLUCAN FROM MUSHROOMS TO OFFER IMMUNE HEALTH BENEFITS AND IMPROVE SKIN HEALTH AND ANTI-INFLAMMATORY EFFECTS
                       TABLE 63 MUSHROOMS: BETA-GLUCAN MARKET, BY REGION, 2019–2023 (USD MILLION)
                       TABLE 64 MUSHROOMS: BETA-GLUCAN MARKET, BY REGION, 2024–2029 (USD MILLION)
                       TABLE 65 MUSHROOMS: BETA-GLUCAN MARKET, BY REGION, 2019–2023 (TONS)
                       TABLE 66 MUSHROOMS: BETA-GLUCAN MARKET, BY REGION, 2024–2029 (TONS)
     11.4 YEAST 
             11.4.1 RISING PREVALENCE OF CHRONIC DISEASES, GROWING AWARENESS ABOUT HEALTH BENEFITS OF BETA-GLUCAN, AND SUPPORT OF GOVERNMENTS FOR RESEARCH AND DEVELOPMENT TO FOSTER MARKET
                       TABLE 67 YEAST: BETA-GLUCAN MARKET, BY REGION, 2019–2023 (USD MILLION)
                       TABLE 68 YEAST: BETA-GLUCAN MARKET, BY REGION, 2024–2029 (USD MILLION)
                       TABLE 69 YEAST: BETA-GLUCAN MARKET, BY REGION, 2019–2023 (TONS)
                       TABLE 70 YEAST: BETA-GLUCAN MARKET, BY REGION, 2024–2029 (TONS)
     11.5 SEAWEED 
             11.5.1 SEAWEED-BASED BETA-GLUCAN TO BE USED IN COSMETIC AND PERSONAL CARE PRODUCTS FOR ITS MOISTURIZING, ANTI-INFLAMMATORY, AND ANTIOXIDANT PROPERTIES
                       TABLE 71 SEAWEED: BETA-GLUCAN MARKET, BY REGION, 2019–2023 (USD MILLION)
                       TABLE 72 SEAWEED: BETA-GLUCAN MARKET, BY REGION, 2024–2029 (USD MILLION)
                       TABLE 73 SEAWEED: BETA-GLUCAN MARKET, 2019–2023 (TONS)
                       TABLE 74 SEAWEED: BETA-GLUCAN MARKET, 2024–2029 (TONS)
 
12 BETA-GLUCAN MARKET, BY TYPE (Page No. - 156)
     12.1 INTRODUCTION 
               FIGURE 50 BETA-GLUCAN MARKET, BY TYPE, 2024 VS. 2029 (USD MILLION)
               TABLE 75 BETA-GLUCAN MARKET, BY TYPE, 2019–2023 (USD MILLION)
               TABLE 76 BETA-GLUCAN MARKET, BY TYPE, 2024–2029 (USD MILLION)
     12.2 1,3 BETA-GLUCAN 
             12.2.1 1,3 BETA-GLUCAN TO ENHANCE IMMUNE FUNCTION BY ACTIVATING VARIOUS IMMUNE CELLS AND IMPROVE SKIN HEALTH
                       TABLE 77 1,3 BETA-GLUCAN: BETA-GLUCAN MARKET, BY REGION, 2019–2023 (USD MILLION)
                       TABLE 78 1,3 BETA-GLUCAN: BETA-GLUCAN MARKET, BY REGION, 2024–2029 (USD MILLION)
     12.3 1,4 BETA-GLUCAN 
             12.3.1 OAT AND BARLEY-DERIVED 1,4 BETA-GLUCAN TO LOWER CHOLESTEROL AND ENHANCE CARDIOVASCULAR HEALTH
                       TABLE 79 1,4 BETA-GLUCAN: BETA-GLUCAN MARKET, BY REGION, 2019–2023 (USD MILLION)
                       TABLE 80 1,4 BETA-GLUCAN: BETA-GLUCAN MARKET, BY REGION, 2024–2029 (USD MILLION)
     12.4 1,6 BETA-GLUCAN 
             12.4.1 DEMAND FOR 1,6 BETA-GLUCAN TO RISE DUE TO ITS IMMUNE-BOOSTING AND SKIN HEALTH BENEFITS
                       TABLE 81 1,6 BETA-GLUCAN: BETA-GLUCAN MARKET, BY REGION, 2019–2023 (USD MILLION)
                       TABLE 82 1,6 BETA-GLUCAN: BETA-GLUCAN MARKET, BY REGION, 2024–2029 (USD MILLION)
 
13 BETA-GLUCAN MARKET, BY REGION (Page No. - 162)
     13.1 INTRODUCTION 
               FIGURE 51 ASIA PACIFIC COUNTRIES TO WITNESS SIGNIFICANT GROWTH IN BETA-GLUCAN MARKET, 2024–2029
               TABLE 83 BETA-GLUCAN MARKET, BY REGION, 2019–2023 (USD MILLION)
               TABLE 84 BETA-GLUCAN MARKET, BY REGION, 2024–2029 (USD MILLION)
               TABLE 85 BETA-GLUCAN MARKET, BY REGION, 2019–2023 (TONS)
               TABLE 86 BETA-GLUCAN MARKET, BY REGION, 2024–2029 (TONS)
     13.2 NORTH AMERICA 
               FIGURE 52 NORTH AMERICA: BETA-GLUCAN MARKET SNAPSHOT
             13.2.1 NORTH AMERICA: RECESSION IMPACT ANALYSIS
                       FIGURE 53 NORTH AMERICA: COUNTRY-LEVEL DATA OF INFLATION, 2017–2022
                       FIGURE 54 NORTH AMERICAN BETA-GLUCAN MARKET: RECESSION IMPACT ANALYSIS
                       TABLE 87 NORTH AMERICA: BETA-GLUCAN MARKET, BY COUNTRY, 2019–2023 (USD MILLION)
                       TABLE 88 NORTH AMERICA: BETA-GLUCAN MARKET, BY COUNTRY, 2024–2029 (USD MILLION)
                       TABLE 89 NORTH AMERICA: BETA-GLUCAN MARKET, BY SOURCE, 2019–2023 (USD MILLION)
                       TABLE 90 NORTH AMERICA: BETA-GLUCAN MARKET, BY SOURCE, 2024–2029 (USD MILLION)
                       TABLE 91 NORTH AMERICA: BETA-GLUCAN MARKET, BY SOURCE, 2019–2023 (TONS)
                       TABLE 92 NORTH AMERICA: BETA-GLUCAN MARKET, BY SOURCE, 2024–2029 (TONS)
                       TABLE 93 NORTH AMERICA: BETA-GLUCAN MARKET, BY CATEGORY, 2019–2023 (USD MILLION)
                       TABLE 94 NORTH AMERICA: BETA-GLUCAN MARKET, BY CATEGORY, 2024–2029 (USD MILLION)
                       TABLE 95 NORTH AMERICA: BETA-GLUCAN MARKET, BY TYPE, 2019–2023 (USD MILLION)
                       TABLE 96 NORTH AMERICA: BETA-GLUCAN MARKET, BY TYPE, 2024–2029 (USD MILLION)
                       TABLE 97 NORTH AMERICA: BETA-GLUCAN MARKET, BY APPLICATION, 2019–2023 (USD MILLION)
                       TABLE 98 NORTH AMERICA: BETA-GLUCAN MARKET, BY APPLICATION, 2024–2029 (USD MILLION)
                       TABLE 99 NORTH AMERICA: BETA-GLUCAN PERSONAL CARE MARKET, BY FORM, 2019–2023 (USD MILLION)
                       TABLE 100 NORTH AMERICA: BETA-GLUCAN PERSONAL CARE MARKET, BY FORM, 2024–2029 (USD MILLION)
                       TABLE 101 NORTH AMERICA: BETA-GLUCAN PERSONAL CARE MARKET, BY FUNCTIONALITY, 2019–2023 (USD MILLION)
                       TABLE 102 NORTH AMERICA: BETA-GLUCAN PERSONAL CARE MARKET, BY FUNCTIONALITY, 2024–2029 (USD MILLION)
                       TABLE 103 NORTH AMERICA: BETA-GLUCAN COSMETICS MARKET, BY FORM, 2019–2023 (USD MILLION)
                       TABLE 104 NORTH AMERICA: BETA-GLUCAN COSMETICS MARKET, BY FORM, 2024–2029 (USD MILLION)
                       TABLE 105 NORTH AMERICA: BETA-GLUCAN COSMETICS MARKET, BY FUNCTIONALITY, 2019–2023 (USD MILLION)
                       TABLE 106 NORTH AMERICA: BETA-GLUCAN COSMETICS MARKET, BY FUNCTIONALITY, 2024–2029 (USD MILLION)
                       TABLE 107 NORTH AMERICA: BETA-GLUCAN ANIMAL FEED MARKET, BY SUB-APPLICATION, 2019–2023 (USD MILLION)
                       TABLE 108 NORTH AMERICA: BETA-GLUCAN ANIMAL FEED MARKET, BY SUB-APPLICATION, 2024–2029 (USD MILLION)
             13.2.2 US
                       13.2.2.1 Increasing number of product launches by food manufacturers to fuel demand for beta-glucan
                                   TABLE 109 US: BETA-GLUCAN MARKET, BY CATEGORY, 2019–2023 (USD MILLION)
                                   TABLE 110 US: BETA-GLUCAN MARKET, BY CATEGORY, 2024–2029 (USD MILLION)
                                   TABLE 111 US: BETA-GLUCAN MARKET, BY APPLICATION, 2019–2023 (USD MILLION)
                                   TABLE 112 US: BETA-GLUCAN MARKET, BY APPLICATION, 2024–2029 (USD MILLION)
             13.2.3 CANADA
                       13.2.3.1 Government approvals and rising efforts from market players to accelerate market growth
                                   TABLE 113 CANADA: BETA-GLUCAN MARKET, BY CATEGORY, 2019–2023 (USD MILLION)
                                   TABLE 114 CANADA: BETA-GLUCAN MARKET, BY CATEGORY, 2024–2029 (USD MILLION)
                                   TABLE 115 CANADA: BETA-GLUCAN MARKET, BY APPLICATION, 2019–2023 (USD MILLION)
                                   TABLE 116 CANADA: BETA-GLUCAN MARKET, BY APPLICATION, 2024–2029 (USD MILLION)
             13.2.4 MEXICO
                       13.2.4.1 Rise in chronic lifestyle diseases, demand for health-benefiting products, and government initiatives to promote healthy lifestyles to drive market
                                   TABLE 117 MEXICO: BETA-GLUCAN MARKET, BY CATEGORY, 2019–2023 (USD MILLION)
                                   TABLE 118 MEXICO: BETA-GLUCAN MARKET, BY CATEGORY, 2024–2029 (USD MILLION)
                                   TABLE 119 MEXICO: BETA-GLUCAN MARKET, BY APPLICATION, 2019–2023 (USD MILLION)
                                   TABLE 120 MEXICO: BETA-GLUCAN MARKET, BY APPLICATION, 2024–2029 (USD MILLION)
     13.3 EUROPE 
             13.3.1 EUROPE: RECESSION IMPACT ANALYSIS
                       FIGURE 55 EUROPE: COUNTRY-LEVEL DATA FOR INFLATION, 2017–2022
                       FIGURE 56 EUROPEAN BETA-GLUCAN MARKET: RECESSION IMPACT ANALYSIS
                       TABLE 121 EUROPE: BETA-GLUCAN MARKET, BY COUNTRY, 2019–2023 (USD MILLION)
                       TABLE 122 EUROPE: BETA-GLUCAN MARKET, BY COUNTRY, 2024–2029 (USD MILLION)
                       TABLE 123 EUROPE: BETA-GLUCAN MARKET, BY SOURCE, 2019–2023 (USD MILLION)
                       TABLE 124 EUROPE: BETA-GLUCAN MARKET, BY SOURCE, 2024–2029 (USD MILLION)
                       TABLE 125 EUROPE: BETA-GLUCAN MARKET, BY SOURCE, 2019–2023 (TONS)
                       TABLE 126 EUROPE: BETA-GLUCAN MARKET, BY SOURCE, 2024–2029 (TONS)
                       TABLE 127 EUROPE: BETA-GLUCAN MARKET, BY CATEGORY, 2019–2023 (USD MILLION)
                       TABLE 128 EUROPE: BETA-GLUCAN MARKET, BY CATEGORY, 2024–2029 (USD MILLION)
                       TABLE 129 EUROPE: BETA-GLUCAN MARKET, BY TYPE, 2019–2023 (USD MILLION)
                       TABLE 130 EUROPE: BETA-GLUCAN MARKET, BY TYPE, 2024–2029 (USD MILLION)
                       TABLE 131 EUROPE: BETA-GLUCAN MARKET, BY APPLICATION, 2019–2023 (USD MILLION)
                       TABLE 132 EUROPE: BETA-GLUCAN MARKET, BY APPLICATION, 2024–2029 (USD MILLION)
                       TABLE 133 EUROPE: BETA-GLUCAN PERSONAL CARE MARKET, BY FORM, 2019–2023 (USD MILLION)
                       TABLE 134 EUROPE: BETA-GLUCAN PERSONAL CARE MARKET, BY FORM, 2024–2029 (USD MILLION)
                       TABLE 135 EUROPE: BETA-GLUCAN PERSONAL CARE MARKET, BY FUNCTIONALITY, 2019–2023 (USD MILLION)
                       TABLE 136 EUROPE: BETA-GLUCAN PERSONAL CARE MARKET, BY FUNCTIONALITY, 2024–2029 (USD MILLION)
                       TABLE 137 EUROPE: BETA-GLUCAN COSMETICS MARKET, BY FORM, 2019–2023 (USD MILLION)
                       TABLE 138 EUROPE: BETA-GLUCAN COSMETICS MARKET, BY FORM, 2024–2029 (USD MILLION)
                       TABLE 139 EUROPE: BETA-GLUCAN COSMETICS MARKET, BY FUNCTIONALITY, 2019–2023 (USD MILLION)
                       TABLE 140 EUROPE: BETA-GLUCAN COSMETICS MARKET, BY FUNCTIONALITY, 2024–2029 (USD MILLION)
                       TABLE 141 EUROPE: BETA-GLUCAN ANIMAL FEED MARKET, BY SUB-APPLICATION, 2019–2023 (USD MILLION)
                       TABLE 142 EUROPE: BETA-GLUCAN ANIMAL FEED MARKET, BY SUB-APPLICATION, 2024–2029 (USD MILLION)
             13.3.2 GERMANY
                       13.3.2.1 Inclination toward natural and organic foods and rising prevalence of health-related problems to propel market
                                   TABLE 143 GERMANY: BETA-GLUCAN MARKET, BY CATEGORY, 2019–2023 (USD MILLION)
                                   TABLE 144 GERMANY: BETA-GLUCAN MARKET, BY CATEGORY, 2024–2029 (USD MILLION)
                                   TABLE 145 GERMANY: BETA-GLUCAN MARKET, BY APPLICATION, 2019–2023 (USD MILLION)
                                   TABLE 146 GERMANY: BETA-GLUCAN MARKET, BY APPLICATION, 2024–2029 (USD MILLION)
             13.3.3 FRANCE
                       13.3.3.1 Rising incidence of lifestyle diseases, growing demand for functional foods, and favorable government policies to drive market
                                   TABLE 147 FRANCE: BETA-GLUCAN MARKET, BY CATEGORY, 2019–2023 (USD MILLION)
                                   TABLE 148 FRANCE: BETA-GLUCAN MARKET, BY CATEGORY, 2024–2029 (USD MILLION)
                                   TABLE 149 FRANCE: BETA-GLUCAN MARKET, BY APPLICATION, 2019–2023 (USD MILLION)
                                   TABLE 150 FRANCE: BETA-GLUCAN MARKET, BY APPLICATION, 2024–2029 (USD MILLION)
             13.3.4 UK
                       13.3.4.1 Rising demand for healthier and more sustainable products and government’s focus on awareness programs to promote healthy diet to drive market
                                   TABLE 151 UK: BETA-GLUCAN MARKET, BY CATEGORY, 2019–2023 (USD MILLION)
                                   TABLE 152 UK: BETA-GLUCAN MARKET, BY CATEGORY, 2024–2029 (USD MILLION)
                                   TABLE 153 UK: BETA-GLUCAN MARKET, BY APPLICATION, 2019–2023 (USD MILLION)
                                   TABLE 154 UK: BETA-GLUCAN MARKET, BY APPLICATION, 2024–2029 (USD MILLION)
             13.3.5 ITALY
                       13.3.5.1 Rising demand for health-enriching ingredients to prevent risk of chronic diseases to foster market growth
                                   TABLE 155 ITALY: BETA-GLUCAN MARKET, BY CATEGORY, 2019–2023 (USD MILLION)
                                   TABLE 156 ITALY: BETA-GLUCAN MARKET, BY CATEGORY, 2024–2029 (USD MILLION)
                                   TABLE 157 ITALY: BETA-GLUCAN MARKET, BY APPLICATION, 2019–2023 (USD MILLION)
                                   TABLE 158 ITALY: BETA-GLUCAN MARKET, BY APPLICATION, 2024–2029 (USD MILLION)
             13.3.6 SPAIN
                       13.3.6.1 Rising export opportunities and need to optimize animal health to boost demand for beta-glucan
                                   TABLE 159 SPAIN: BETA-GLUCAN MARKET, BY CATEGORY, 2019–2023 (USD MILLION)
                                   TABLE 160 SPAIN: BETA-GLUCAN MARKET, BY CATEGORY, 2024–2029 (USD MILLION)
                                   TABLE 161 SPAIN: BETA-GLUCAN MARKET, BY APPLICATION, 2019–2023 (USD MILLION)
                                   TABLE 162 SPAIN: BETA-GLUCAN MARKET, BY APPLICATION, 2024–2029 (USD MILLION)
             13.3.7 REST OF EUROPE
                       TABLE 163 REST OF EUROPE: BETA-GLUCAN MARKET, BY CATEGORY, 2019–2023 (USD MILLION)
                       TABLE 164 REST OF EUROPE: BETA-GLUCAN MARKET, BY CATEGORY, 2024–2029 (USD MILLION)
                       TABLE 165 REST OF EUROPE: BETA-GLUCAN MARKET, BY APPLICATION, 2019–2023 (USD MILLION)
                       TABLE 166 REST OF EUROPE: BETA-GLUCAN MARKET, BY APPLICATION, 2024–2029 (USD MILLION)
     13.4 ASIA PACIFIC 
               FIGURE 57 ASIA PACIFIC: BETA-GLUCAN MARKET SNAPSHOT
             13.4.1 ASIA PACIFIC: RECESSION IMPACT ANALYSIS
                       FIGURE 58 ASIA PACIFIC: KEY COUNTRY-WISE INFLATION RATES, 2017–2022
                       FIGURE 59 ASIA PACIFIC: RECESSION IMPACT ANALYSIS, 2023
                       TABLE 167 ASIA PACIFIC: BETA-GLUCAN MARKET, BY COUNTRY, 2019–2023 (USD MILLION)
                       TABLE 168 ASIA PACIFIC: BETA-GLUCAN MARKET, BY COUNTRY, 2024–2029 (USD MILLION)
                       TABLE 169 ASIA PACIFIC: BETA-GLUCAN MARKET, BY SOURCE, 2019–2023 (USD MILLION)
                       TABLE 170 ASIA PACIFIC: BETA-GLUCAN MARKET, BY SOURCE, 2024–2029 (USD MILLION)
                       TABLE 171 ASIA PACIFIC: BETA-GLUCAN MARKET, BY SOURCE, 2019–2023 (TONS)
                       TABLE 172 ASIA PACIFIC: BETA-GLUCAN MARKET, BY SOURCE, 2024–2029 (TONS)
                       TABLE 173 ASIA PACIFIC: BETA-GLUCAN MARKET, BY CATEGORY, 2019–2023 (USD MILLION)
                       TABLE 174 ASIA PACIFIC: BETA-GLUCAN MARKET, BY CATEGORY, 2024–2029 (USD MILLION)
                       TABLE 175 ASIA PACIFIC: BETA-GLUCAN MARKET, BY TYPE, 2019–2023 (USD MILLION)
                       TABLE 176 ASIA PACIFIC: BETA-GLUCAN MARKET, BY TYPE, 2024–2029 (USD MILLION)
                       TABLE 177 ASIA PACIFIC: BETA-GLUCAN MARKET, BY APPLICATION, 2019–2023 (USD MILLION)
                       TABLE 178 ASIA PACIFIC: BETA-GLUCAN MARKET, BY APPLICATION, 2024–2029 (USD MILLION)
                       TABLE 179 ASIA PACIFIC: BETA-GLUCAN PERSONAL CARE MARKET, BY FORM, 2019–2023 (USD MILLION)
                       TABLE 180 ASIA PACIFIC: BETA-GLUCAN PERSONAL CARE MARKET, BY FORM, 2024–2029 (USD MILLION)
                       TABLE 181 ASIA PACIFIC: BETA-GLUCAN PERSONAL CARE MARKET, BY FUNCTIONALITY, 2019–2023 (USD MILLION)
                       TABLE 182 ASIA PACIFIC: BETA-GLUCAN PERSONAL CARE MARKET, BY FUNCTIONALITY, 2024–2029 (USD MILLION)
                       TABLE 183 ASIA PACIFIC: BETA-GLUCAN COSMETICS MARKET, BY FORM, 2019–2023 (USD MILLION)
                       TABLE 184 ASIA PACIFIC: BETA-GLUCAN COSMETICS MARKET, BY FORM, 2024–2029 (USD MILLION)
                       TABLE 185 ASIA PACIFIC: BETA-GLUCAN COSMETICS MARKET, BY FUNCTIONALITY, 2019–2023 (USD MILLION)
                       TABLE 186 ASIA PACIFIC: BETA-GLUCAN COSMETICS MARKET, BY FUNCTIONALITY, 2024–2029 (USD MILLION)
                       TABLE 187 ASIA PACIFIC: BETA-GLUCAN ANIMAL FEED MARKET, BY SUB-APPLICATION, 2019–2023 (USD MILLION)
                       TABLE 188 ASIA PACIFIC: BETA-GLUCAN ANIMAL FEED MARKET, BY SUB-APPLICATION, 2024–2029 (USD MILLION)
             13.4.2 CHINA
                       13.4.2.1 Higher demand for high-quality processed foods and presence of major vendors to foster market growth
                                   TABLE 189 CHINA: BETA-GLUCAN MARKET, BY CATEGORY, 2019–2023 (USD MILLION)
                                   TABLE 190 CHINA: BETA-GLUCAN MARKET, BY CATEGORY, 2024–2029 (USD MILLION)
                                   TABLE 191 CHINA: BETA-GLUCAN MARKET, BY APPLICATION, 2019–2023 (USD MILLION)
                                   TABLE 192 CHINA: BETA-GLUCAN MARKET, BY APPLICATION, 2024–2029 (USD MILLION)
             13.4.3 JAPAN
                       13.4.3.1 Rise in healthcare costs and higher life expectancy due to preventive healthcare measures to drive market
                                   TABLE 193 JAPAN: BETA-GLUCAN MARKET, BY CATEGORY, 2019–2023 (USD MILLION)
                                   TABLE 194 JAPAN: BETA-GLUCAN MARKET, BY CATEGORY, 2024–2029 (USD MILLION)
                                   TABLE 195 JAPAN: BETA-GLUCAN MARKET, BY APPLICATION, 2019–2023 (USD MILLION)
                                   TABLE 196 JAPAN: BETA-GLUCAN MARKET, BY APPLICATION, 2024–2029 (USD MILLION)
             13.4.4 INDIA
                       13.4.4.1 Promotion of innovation and product development in food industry to fuel demand for beta-glucan
                                   TABLE 197 INDIA: BETA-GLUCAN MARKET, BY CATEGORY, 2019–2023 (USD MILLION)
                                   TABLE 198 INDIA: BETA-GLUCAN MARKET, BY CATEGORY, 2024–2029 (USD MILLION)
                                   TABLE 199 INDIA: BETA-GLUCAN MARKET, BY APPLICATION, 2019–2023 (USD MILLION)
                                   TABLE 200 INDIA: BETA-GLUCAN MARKET, BY APPLICATION, 2024–2029 (USD MILLION)
             13.4.5 AUSTRALIA & NEW ZEALAND
                       13.4.5.1 Need to promote animal growth, boost immunity, and improve overall productivity to propel market
                                   TABLE 201 AUSTRALIA & NEW ZEALAND: BETA-GLUCAN MARKET, BY CATEGORY, 2019–2023 (USD MILLION)
                                   TABLE 202 AUSTRALIA & NEW ZEALAND: BETA-GLUCAN MARKET, BY CATEGORY, 2024–2029 (USD MILLION)
                                   TABLE 203 AUSTRALIA & NEW ZEALAND: BETA-GLUCAN MARKET, BY APPLICATION, 2019–2023 (USD MILLION)
                                   TABLE 204 AUSTRALIA & NEW ZEALAND: BETA-GLUCAN MARKET, BY APPLICATION, 2024–2029 (USD MILLION)
             13.4.6 REST OF ASIA PACIFIC
                       TABLE 205 REST OF ASIA PACIFIC: BETA-GLUCAN MARKET, BY CATEGORY, 2019–2023 (USD MILLION)
                       TABLE 206 REST OF ASIA PACIFIC: BETA-GLUCAN MARKET, BY CATEGORY, 2024–2029 (USD MILLION)
                       TABLE 207 REST OF ASIA PACIFIC: BETA-GLUCAN MARKET, BY APPLICATION, 2019–2023 (USD MILLION)
                       TABLE 208 REST OF ASIA PACIFIC: BETA-GLUCAN MARKET, BY APPLICATION, 2024–2029 (USD MILLION)
     13.5 SOUTH AMERICA 
             13.5.1 SOUTH AMERICA: RECESSION IMPACT ANALYSIS
                       FIGURE 60 SOUTH AMERICA: COUNTRY-LEVEL DATA FOR INFLATION, 2017–2022
                       FIGURE 61 SOUTH AMERICA BETA-GLUCAN MARKET: RECESSION IMPACT ANALYSIS
                       TABLE 209 SOUTH AMERICA: BETA-GLUCAN MARKET, BY COUNTRY, 2019–2023 (USD MILLION)
                       TABLE 210 SOUTH AMERICA: BETA-GLUCAN MARKET, BY COUNTRY, 2024–2029 (USD MILLION)
                       TABLE 211 SOUTH AMERICA: BETA-GLUCAN MARKET, BY SOURCE, 2019–2023 (USD MILLION)
                       TABLE 212 SOUTH AMERICA: BETA-GLUCAN MARKET, BY SOURCE, 2024–2029 (USD MILLION)
                       TABLE 213 SOUTH AMERICA: BETA-GLUCAN MARKET, BY SOURCE, 2019–2023 (TONS)
                       TABLE 214 SOUTH AMERICA: BETA-GLUCAN MARKET, BY SOURCE, 2024–2029 (TONS)
                       TABLE 215 SOUTH AMERICA: BETA-GLUCAN MARKET, BY CATEGORY, 2019–2023 (USD MILLION)
                       TABLE 216 SOUTH AMERICA: BETA-GLUCAN MARKET, BY CATEGORY, 2024–2029 (USD MILLION)
                       TABLE 217 SOUTH AMERICA: BETA-GLUCAN MARKET, BY TYPE, 2019–2023 (USD MILLION)
                       TABLE 218 SOUTH AMERICA: BETA-GLUCAN MARKET, BY TYPE, 2024–2029 (USD MILLION)
                       TABLE 219 SOUTH AMERICA: BETA-GLUCAN MARKET, BY APPLICATION, 2019–2023 (USD MILLION)
                       TABLE 220 SOUTH AMERICA: BETA-GLUCAN MARKET, BY APPLICATION, 2024–2029 (USD MILLION)
                       TABLE 221 SOUTH AMERICA: BETA-GLUCAN PERSONAL CARE MARKET, BY FORM, 2019–2023 (USD MILLION)
                       TABLE 222 SOUTH AMERICA: BETA-GLUCAN PERSONAL CARE MARKET, BY FORM, 2024–2029 (USD MILLION)
                       TABLE 223 SOUTH AMERICA: BETA-GLUCAN PERSONAL CARE MARKET, BY FUNCTIONALITY, 2019–2023 (USD MILLION)
                       TABLE 224 SOUTH AMERICA: BETA-GLUCAN PERSONAL CARE MARKET, BY FUNCTIONALITY, 2024–2029 (USD MILLION)
                       TABLE 225 SOUTH AMERICA: BETA-GLUCAN COSMETICS MARKET, BY FORM, 2019–2023 (USD MILLION)
                       TABLE 226 SOUTH AMERICA: BETA-GLUCAN COSMETICS MARKET, BY FORM, 2024–2029 (USD MILLION)
                       TABLE 227 SOUTH AMERICA: BETA-GLUCAN COSMETICS MARKET, BY FUNCTIONALITY, 2019–2023 (USD MILLION)
                       TABLE 228 SOUTH AMERICA: BETA-GLUCAN COSMETICS MARKET, BY FUNCTIONALITY, 2024–2029 (USD MILLION)
                       TABLE 229 SOUTH AMERICA: BETA-GLUCAN ANIMAL FEED MARKET, BY SUB-APPLICATION, 2019–2023 (USD MILLION)
                       TABLE 230 SOUTH AMERICA: BETA-GLUCAN ANIMAL FEED MARKET, BY SUB-APPLICATION, 2024–2029 (USD MILLION)
             13.5.2 BRAZIL
                       13.5.2.1 Rising geriatric population, surge in obesity levels, urbanization, and health consciousness to spur market growth
                                   TABLE 231 BRAZIL: BETA-GLUCAN MARKET, BY CATEGORY, 2019–2023 (USD MILLION)
                                   TABLE 232 BRAZIL: BETA-GLUCAN MARKET, BY CATEGORY, 2024–2029 (USD MILLION)
                                   TABLE 233 BRAZIL: BETA-GLUCAN MARKET, BY APPLICATION, 2019–2023 (USD MILLION)
                                   TABLE 234 BRAZIL: BETA-GLUCAN MARKET, BY APPLICATION, 2024–2029 (USD MILLION)
             13.5.3 ARGENTINA
                       13.5.3.1 Need for reducing cholesterol levels and promoting digestion to fuel demand for oats-derived beta-glucan
                                   TABLE 235 ARGENTINA: BETA-GLUCAN MARKET, BY CATEGORY, 2019–2023 (USD MILLION)
                                   TABLE 236 ARGENTINA: BETA-GLUCAN MARKET, BY CATEGORY, 2024–2029 (USD MILLION)
                                   TABLE 237 ARGENTINA: BETA-GLUCAN MARKET, BY APPLICATION, 2019–2023 (USD MILLION)
                                   TABLE 238 ARGENTINA: BETA-GLUCAN MARKET, BY APPLICATION, 2024–2029 (USD MILLION)
             13.5.4 REST OF SOUTH AMERICA
                       TABLE 239 REST OF SOUTH AMERICA: BETA-GLUCAN MARKET, BY CATEGORY, 2019–2023 (USD MILLION)
                       TABLE 240 REST OF SOUTH AMERICA: BETA-GLUCAN MARKET, BY CATEGORY, 2024–2029 (USD MILLION)
                       TABLE 241 REST OF SOUTH AMERICA: BETA-GLUCAN MARKET, BY APPLICATION, 2019–2023 (USD MILLION)
                       TABLE 242 REST OF SOUTH AMERICA: BETA-GLUCAN MARKET, BY APPLICATION, 2024–2029 (USD MILLION)
     13.6 REST OF THE WORLD (ROW) 
             13.6.1 ROW: RECESSION IMPACT ANALYSIS
                       FIGURE 62 ROW: KEY COUNTRY-WISE INFLATION RATES, 2017–2022
                       FIGURE 63 ROW: RECESSION IMPACT ANALYSIS, 2023
                       TABLE 243 ROW: BETA-GLUCAN MARKET, BY COUNTRY, 2019–2023 (USD MILLION)
                       TABLE 244 ROW: BETA-GLUCAN MARKET, BY COUNTRY, 2024–2029 (USD MILLION)
                       TABLE 245 ROW: BETA-GLUCAN MARKET, BY SOURCE, 2019–2023 (USD MILLION)
                       TABLE 246 ROW: BETA-GLUCAN MARKET, BY SOURCE, 2024–2029 (USD MILLION)
                       TABLE 247 ROW: BETA-GLUCAN MARKET, BY SOURCE, 2019–2023 (TONS)
                       TABLE 248 ROW: BETA-GLUCAN MARKET, BY SOURCE, 2024–2029 (TONS)
                       TABLE 249 ROW: BETA-GLUCAN MARKET, BY CATEGORY, 2019–2023 (USD MILLION)
                       TABLE 250 ROW: BETA-GLUCAN MARKET, BY CATEGORY, 2024–2029 (USD MILLION)
                       TABLE 251 ROW: BETA-GLUCAN MARKET, BY TYPE, 2019–2023 (USD MILLION)
                       TABLE 252 ROW: BETA-GLUCAN MARKET, BY TYPE, 2024–2029 (USD MILLION)
                       TABLE 253 ROW: BETA-GLUCAN MARKET, BY APPLICATION, 2019–2023 (USD MILLION)
                       TABLE 254 ROW: BETA-GLUCAN MARKET, BY APPLICATION, 2024–2029 (USD MILLION)
                       TABLE 255 ROW: BETA-GLUCAN PERSONAL CARE MARKET, BY FORM, 2019–2023 (USD MILLION)
                       TABLE 256 ROW: BETA-GLUCAN PERSONAL CARE MARKET, BY FORM, 2024–2029 (USD MILLION)
                       TABLE 257 ROW: BETA-GLUCAN PERSONAL CARE MARKET, BY FUNCTIONALITY, 2019–2023 (USD MILLION)
                       TABLE 258 ROW: BETA-GLUCAN PERSONAL CARE MARKET, BY FUNCTIONALITY, 2024–2029 (USD MILLION)
                       TABLE 259 ROW: BETA-GLUCAN COSMETICS MARKET, BY FORM, 2019–2023 (USD MILLION)
                       TABLE 260 ROW: BETA-GLUCAN COSMETICS MARKET, BY FORM, 2024–2029 (USD MILLION)
                       TABLE 261 ROW: BETA-GLUCAN COSMETICS MARKET, BY FUNCTIONALITY, 2019–2023 (USD MILLION)
                       TABLE 262 ROW: BETA-GLUCAN COSMETICS MARKET, BY FUNCTIONALITY, 2024–2029 (USD MILLION)
                       TABLE 263 ROW: BETA-GLUCAN ANIMAL FEED MARKET, BY SUB-APPLICATION, 2019–2023 (USD MILLION)
                       TABLE 264 ROW: BETA-GLUCAN ANIMAL FEED MARKET, BY SUB-APPLICATION, 2024–2029 (USD MILLION)
             13.6.2 MIDDLE EAST
                       13.6.2.1 Expanding middle-class population and industrial growth and increased health and wellness initiatives in Middle East to drive market
                                   TABLE 265 MIDDLE EAST: BETA-GLUCAN MARKET, BY CATEGORY, 2019–2023 (USD MILLION)
                                   TABLE 266 MIDDLE EAST: BETA-GLUCAN MARKET, BY CATEGORY, 2024–2029 (USD MILLION)
                                   TABLE 267 MIDDLE EAST: BETA-GLUCAN MARKET, BY APPLICATION, 2019–2023 (USD MILLION)
                                   TABLE 268 MIDDLE EAST: BETA-GLUCAN MARKET, BY APPLICATION, 2024–2029 (USD MILLION)
             13.6.3 AFRICA
                       13.6.3.1 Growing demand for natural and functional ingredients to boost demand for beta-glucan ingredients
                                   TABLE 269 AFRICA: BETA-GLUCAN MARKET, BY CATEGORY, 2019–2023 (USD MILLION)
                                   TABLE 270 AFRICA: BETA-GLUCAN MARKET, BY CATEGORY, 2024–2029 (USD MILLION)
                                   TABLE 271 AFRICA: BETA-GLUCAN MARKET, BY APPLICATION, 2019–2023 (USD MILLION)
                                   TABLE 272 AFRICA: BETA-GLUCAN MARKET, BY APPLICATION, 2024–2029 (USD MILLION)
 
14 COMPETITIVE LANDSCAPE (Page No. - 245)
     14.1 OVERVIEW 
     14.2 REVENUE ANALYSIS 
               FIGURE 64 SEGMENTAL REVENUE ANALYSIS OF KEY PLAYERS, 2019–2023 (USD BILLION)
     14.3 MARKET SHARE ANALYSIS 
               TABLE 273 BETA-GLUCAN MARKET: MARKET SHARE ANALYSIS, 2023
     14.4 KEY PLAYER STRATEGIES/RIGHT TO WIN 
               TABLE 274 OVERVIEW OF STRATEGIES ADOPTED BY KEY BETA-GLUCAN PLAYERS
     14.5 COMPANY VALUATION AND FINANCIAL METRICS 
               FIGURE 65 COMPANY VALUATION
               FIGURE 66 EV/EBITDA OF FEW MAJOR PLAYERS
     14.6 BRAND/PRODUCT COMPARISON ANALYSIS 
               FIGURE 67 BETA-GLUCAN MARKET: BRAND/PRODUCT COMPARISON ANALYSIS
     14.7 COMPANY EVALUATION MATRIX: KEY PLAYERS, 2023 
             14.7.1 STARS
             14.7.2 EMERGING LEADERS
             14.7.3 PERVASIVE PLAYERS
             14.7.4 PARTICIPANTS
                       FIGURE 68 BETA-GLUCAN MARKET: COMPANY EVALUATION MATRIX FOR KEY PLAYERS, 2023
             14.7.5 COMPANY FOOTPRINT: KEY PLAYERS, 2023
                       14.7.5.1 Company footprint
                                   FIGURE 69 OVERALL COMPANY FOOTPRINT
                       14.7.5.2 Regional footprint
                                   TABLE 275 REGIONAL FOOTPRINT
                       14.7.5.3 Source footprint
                                   TABLE 276 SOURCE FOOTPRINT
                       14.7.5.4 Application footprint
                                   TABLE 277 APPLICATION FOOTPRINT
                       14.7.5.5 Type footprint
                                   TABLE 278 TYPE FOOTPRINT
     14.8 COMPANY EVALUATION MATRIX: START-UPS/SMES, 2023 
             14.8.1 PROGRESSIVE COMPANIES
             14.8.2 RESPONSIVE COMPANIES
             14.8.3 DYNAMIC COMPANIES
             14.8.4 STARTING BLOCKS
                       FIGURE 70 BETA-GLUCAN MARKET: COMPANY EVALUATION MATRIX FOR START-UPS/SMES, 2023
             14.8.5 COMPETITIVE BENCHMARKING, START-UPS/SMES, 2023
                       14.8.5.1 Detailed list of key start-ups/SMEs
                                   TABLE 279 BETA-GLUCAN MARKET: LIST OF KEY START-UPS/SMES
                       14.8.5.2 Competitive benchmarking of key start-ups/SMEs
                                   TABLE 280 BETA-GLUCAN MARKET: COMPETITIVE BENCHMARKING OF START-UPS/SMES
     14.9 COMPETITIVE SCENARIO AND TRENDS 
             14.9.1 DEALS
                       TABLE 281 BETA-GLUCAN MARKET: DEALS, 2020–2022
             14.9.2 EXPANSIONS
                       TABLE 282 BETA-GLUCAN MARKET: EXPANSIONS, 2019–2022
 
15 COMPANY PROFILES (Page No. - 264)
(Business Overview, Products/Solutions Offered, Recent Developments, and MnM View (Key strengths/Right to Win, Strategic Choices Made, and Weaknesses and Competitive Threats))*
     15.1 KEY PLAYERS 
             15.1.1 TATE & LYLE PLC
                       TABLE 283 TATE & LYLE PLC: BUSINESS OVERVIEW
                       FIGURE 71 TATE & LYLE PLC: COMPANY SNAPSHOT
                       TABLE 284 TATE & LYLE PLC: INGREDIENTS OFFERED
                       TABLE 285 TATE & LYLE PLC: DEALS
                       TABLE 286 TATE & LYLE PLC: EXPANSIONS
                       TABLE 287 TATE & LYLE PLC: OTHER DEVELOPMENTS
             15.1.2 KERRY GROUP PLC
                       TABLE 288 KERRY GROUP PLC: BUSINESS OVERVIEW
                       FIGURE 72 KERRY GROUP PLC: COMPANY SNAPSHOT
                       TABLE 289 KERRY GROUP PLC: INGREDIENTS OFFERED
             15.1.3 DSM-FIRMENICH
                       TABLE 290 DSM-FIRMENICH: BUSINESS OVERVIEW
                       FIGURE 73 DSM-FIRMENICH: COMPANY SNAPSHOT
                       TABLE 291 DSM-FIRMENICH: INGREDIENTS OFFERED
                       TABLE 292 DSM-FIRMENICH: EXPANSIONS
             15.1.4 ANGEL YEAST CO., LTD.
                       TABLE 293 ANGEL YEAST CO., LTD.: BUSINESS OVERVIEW
                       FIGURE 74 ANGEL YEAST CO., LTD: COMPANY SNAPSHOT
                       TABLE 294 ANGEL YEAST CO., LTD.: INGREDIENTS OFFERED
                       TABLE 295 ANGEL YEAST CO., LTD.: PRODUCTS OFFERED
                       TABLE 296 ANGEL YEAST CO., LTD.: EXPANSIONS
             15.1.5 MERCK
                       TABLE 297 MERCK: BUSINESS OVERVIEW
                       FIGURE 75 MERCK: COMPANY SNAPSHOT
                       TABLE 298 MERCK: INGREDIENTS OFFERED
                       TABLE 299 MERCK: EXPANSIONS
             15.1.6 ASSOCIATED BRITISH FOODS PLC
                       TABLE 300 ASSOCIATED BRITISH FOODS PLC: BUSINESS OVERVIEW
                       FIGURE 76 ASSOCIATED BRITISH FOODS PLC: COMPANY SNAPSHOT
                       TABLE 301 ASSOCIATED BRITISH FOODS PLC: INGREDIENTS OFFERED
                       TABLE 302 ASSOCIATED BRITISH FOODS PLC: PRODUCTS OFFERED
             15.1.7 CEAPRO INC.
                       TABLE 303 CEAPRO INC.: BUSINESS OVERVIEW
                       FIGURE 77 CEAPRO INC.: COMPANY SNAPSHOT
                       TABLE 304 CEAPRO INC.: INGREDIENTS OFFERED
                       TABLE 305 CEAPRO INC.: DEALS
                       TABLE 306 CEAPRO INC.: OTHER DEVELOPMENTS
             15.1.8 LESAFFRE
                       TABLE 307 LESAFFRE: BUSINESS OVERVIEW
                       TABLE 308 LESAFFRE: INGREDIENTS OFFERED
                       TABLE 309 LESAFFRE: PRODUCTS OFFERED
                       TABLE 310 LESAFFRE: DEALS
             15.1.9 KEMIN INDUSTRIES, INC.
                       TABLE 311 KEMIN INDUSTRIES, INC.: BUSINESS OVERVIEW
                       TABLE 312 KEMIN INDUSTRIES, INC.: INGREDIENTS OFFERED
                       TABLE 313 KEMIN INDUSTRIES, INC.: EXPANSIONS
                       TABLE 314 KEMIN INDUSTRIES, INC.: OTHER DEVELOPMENTS
             15.1.10 FOODCHEM INTERNATIONAL CORPORATION
                                   TABLE 315 FOODCHEM INTERNATIONAL CORPORATION: BUSINESS OVERVIEW
                                   TABLE 316 FOODCHEM INTERNATIONAL CORPORATION: INGREDIENTS OFFERED
             15.1.11 LALLEMAND
                                   TABLE 317 LALLEMAND: BUSINESS OVERVIEW
                                   TABLE 318 LALLEMAND: INGREDIENTS OFFERED
                                   TABLE 319 LALLEMAND: PRODUCTS OFFERED
                                   TABLE 320 LALLEMAND: DEALS
             15.1.12 BIORIGIN
                                   TABLE 321 BIORIGIN: BUSINESS OVERVIEW
                                   TABLE 322 BIORIGIN: INGREDIENTS OFFERED
             15.1.13 NUTRISCIENCE INNOVATIONS, LLC
                                   TABLE 323 NUTRISCIENCE INNOVATIONS, LLC: BUSINESS OVERVIEW
                                   TABLE 324 NUTRISCIENCE INNOVATIONS, LLC: INGREDIENTS OFFERED
             15.1.14 LEIBER
                                   TABLE 325 LEIBER: BUSINESS OVERVIEW
                                   TABLE 326 LEIBER: INGREDIENTS OFFERED
                                   TABLE 327 LEIBER: PRODUCTS OFFERED
             15.1.15 GARUDA INTERNATIONAL INC.
                                   TABLE 328 GARUDA INTERNATIONAL INC.: BUSINESS OVERVIEW
                                   TABLE 329 GARUDA INTERNATIONAL INC.: INGREDIENTS OFFERED
     15.2 OTHER PLAYERS 
             15.2.1 VW-INGREDIENTS
                       TABLE 330 VW-INGREDIENTS: BUSINESS OVERVIEW
                       TABLE 331 VW-INGREDIENTS: INGREDIENTS OFFERED
             15.2.2 SUPER BETA GLUCAN
                       TABLE 332 SUPER BETA GLUCAN: BUSINESS OVERVIEW
                       TABLE 333 SUPER BETA GLUCAN: INGREDIENTS OFFERED
             15.2.3 GLYCANOVA AS
                       TABLE 334 GLYCANOVA AS: BUSINESS OVERVIEW
                       TABLE 335 GLYCANOVA AS: INGREDIENTS OFFERED
                       TABLE 336 GLYCANOVA AS: PRODUCTS OFFERED
             15.2.4 SPECIALTY BIOTECH CO., LTD.
                       TABLE 337 SPECIALTY BIOTECH CO., LTD.: BUSINESS OVERVIEW
                       TABLE 338 SPECIALTY BIOTECH CO., LTD.: INGREDIENTS OFFERED
             15.2.5 ALGALÍF ICELAND HF.
                       TABLE 339 ALGALÍF ICELAND HF.: BUSINESS OVERVIEW
                       TABLE 340 ALGALÍF ICELAND HF.: INGREDIENTS OFFERED
             15.2.6 NATURAL BIOLOGICS
                       TABLE 341 NATURAL BIOLOGICS: BUSINESS OVERVIEW
             15.2.7 ABAC R&D AG
                       TABLE 342 ABAC R&D AG: BUSINESS OVERVIEW
             15.2.8 BENEO
                       TABLE 343 BENEO: BUSINESS OVERVIEW
             15.2.9 L&P FOOD INGREDIENT CO., LTD
                       TABLE 344 L&P FOOD INGREDIENT CO., LTD: BUSINESS OVERVIEW
             15.2.10 BETA BIO TECHNOLOGY SP. Z O. O.
                                   TABLE 345 BETA BIO TECHNOLOGY SP. Z O. O. : BUSINESS OVERVIEW
     15.3 PRODUCT-BASED COMPANIES 
             15.3.1 CARGILL, INCORPORATED
                       TABLE 346 CARGILL, INCORPORATED: BUSINESS OVERVIEW
             15.3.2 INTERNATIONAL FLAVORS & FRAGRANCES, INC.
                       TABLE 347 INTERNATIONAL FLAVORS & FRAGRANCES, INC.: BUSINESS OVERVIEW
             15.3.3 VIVESA HOLDING S.R.O
                       TABLE 348 VIVESA HOLDING S.R.O: BUSINESS OVERVIEW
             15.3.4 ALERIS
                       TABLE 349 ALERIS: BUSINESS OVERVIEW
             15.3.5 ICC
                       TABLE 350 ICC: BUSINESS OVERVIEW
             15.3.6 PROSOL S.P.A.
                       TABLE 351 PROSOL S.P.A.: BUSINESS OVERVIEW
             15.3.7 ABN APLICACIONES BIOLÓGICAS A LA NUTRICIÓN
                       TABLE 352 ABN APLICACIONES BIOLÓGICAS A LA NUTRICIÓN: BUSINESS OVERVIEW
             15.3.8 EW NUTRITION
                       TABLE 353 EW NUTRITION: BUSINESS OVERVIEW
             15.3.9 BIOCHEM ZUSATZSTOFFE HANDELS- UND PRODUKTIONSGESELLSCHAFT MBH
                       TABLE 354 BIOCHEM ZUSATZSTOFFE HANDELS- UND PRODUKTIONSGESELLSCHAFT MBH: BUSINESS OVERVIEW
             15.3.10 MIBELLE BIOCHEMISTRY
                                   TABLE 355 MIBELLE BIOCHEMISTRY: BUSINESS OVERVIEW
*Details on Business Overview, Products/Solutions Offered, Recent Developments, and MnM View (Key strengths/Right to Win, Strategic Choices Made, and Weaknesses and Competitive Threats) might not be captured in case of unlisted companies.
 
16 ADJACENT & RELATED MARKETS (Page No. - 324)
     16.1 INTRODUCTION 
               TABLE 356 ADJACENT MARKETS
     16.2 STUDY LIMITATIONS 
     16.3 YEAST MARKET 
             16.3.1 MARKET DEFINITION
             16.3.2 MARKET OVERVIEW
                       TABLE 357 YEAST MARKET, BY TYPE, 2019–2023 (USD MILLION)
                       TABLE 358 YEAST MARKET, BY TYPE, 2024–2029 (USD MILLION)
     16.4 STARTER CULTURE MARKET 
             16.4.1 MARKET DEFINITION
             16.4.2 MARKET OVERVIEW
                       TABLE 359 STARTER CULTURE MARKET, BY APPLICATION, 2017–2021 (USD MILLION)
                       TABLE 360 STARTER CULTURE MARKET, BY APPLICATION, 2022–2027 (USD MILLION)
 
17 APPENDIX (Page No. - 328)
     17.1 DISCUSSION GUIDE 
     17.2 KNOWLEDGESTORE: MARKETSANDMARKETS’ SUBSCRIPTION PORTAL 
     17.3 CUSTOMIZATION OPTIONS 
     17.4 RELATED REPORTS 
     17.5 AUTHOR DETAILS 


The study involved two major approaches in estimating the current size of the beta-glucan market. Exhaustive secondary research was done to collect information on the market, peer, and parent markets. The next step was to validate these findings, assumptions, and sizing with industry experts across the value chain through primary research. Both top-down and bottom-up approaches were employed to estimate the complete market size. After that, market breakdown and data triangulation were used to estimate the market size of segments and subsegments.

Secondary Research

This research study involved the extensive use of secondary sources—directories and databases such as Bloomberg Businessweek and Factiva—to identify and collect information useful for a technical, market-oriented, and commercial study of the market.

In the secondary research process, various sources such as annual reports, press releases & investor presentations of companies, white papers, food journals, certified publications, articles from recognized authors, directories, and databases were referred to identify and collect information.

Secondary research was mainly used to obtain key information about the industry’s supply chain, the total pool of key players, and market classification and segmentation as per the industry trends to the bottom-most level, regional markets, and key developments from both market- and technology-oriented perspectives.

Primary Research

Extensive primary research was conducted after obtaining information regarding the beta-glucan market scenario through secondary research. Several primary interviews were conducted with market experts from both the demand and supply sides across major countries of North America, Europe, Asia Pacific, South America, and the Rest of the World. Primary data was collected through questionnaires, emails, and telephonic interviews. The primary sources from the supply side included various industry experts, such as Chief X Officers (CXOs), Vice Presidents (VPs), Directors from business development, marketing, research, and development teams, and related key executives from distributors and key opinion leaders. Primary interviews were conducted to gather insights such as market statistics, data on revenue collected from the products and services, market breakdowns, market size estimations, market forecasting, and data triangulation. Primary research also helped in understanding the various trends related to beta-glucan sources, categories, application, type, extraction method, and region. Stakeholders from the demand side, such as processed food and functional food products manufacturers, were interviewed to understand the buyer’s perspective on the suppliers, products, and their current usage of beta-glucan and the outlook of their business, which will affect the overall market.
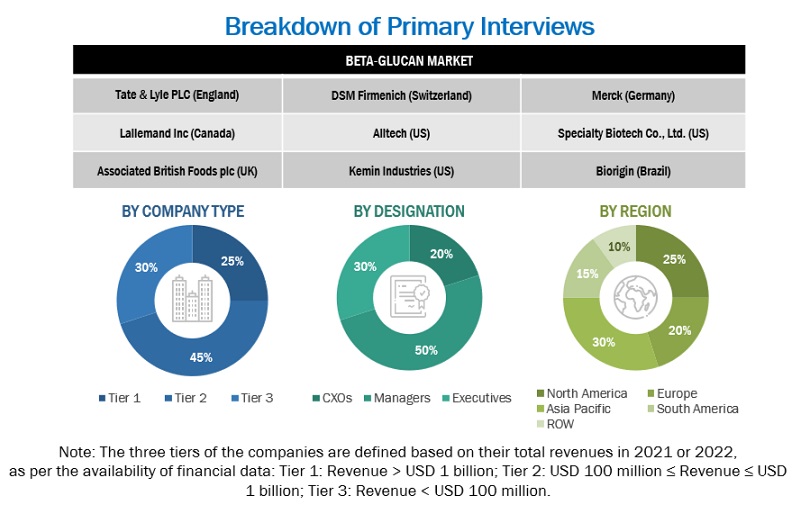
Beta-Glucan  Market Size, and Share

To know about the assumptions considered for the study, download the pdf brochure

COMPANY NAME

designation

Tate & lyle (England)

General Manager

Associated British Foods plc (UK)

Sales Manager

Alltech (US)

Manager

AngelYeast Co., Ltd (China)

Head of processing department

Lallemand Inc. (Canada)

Marketing Manager

Leiber (Germany)

Sales Executive

Market Size Estimation

Both the top-down and bottom-up approaches were used to estimate and validate the total size of the beta-glucan market. These approaches were also used extensively to determine the size of various subsegments in the market. The research methodology used to estimate the market size includes the following details:

  • The key players in the industry and the overall markets were identified through extensive secondary research.
  • All shares, splits, and breakdowns were determined using secondary sources and verified through primary sources.
  • All possible parameters that affect the market covered in this research study were accounted for, viewed in extensive detail, verified through primary research, and analyzed to obtain final quantitative and qualitative data.
  • The research included the study of reports, reviews, and newsletters of top market players, along with extensive interviews for opinions from leaders, such as CEOs, directors, and marketing executives.

Global Beta-glucan market: Supply-side analysis.
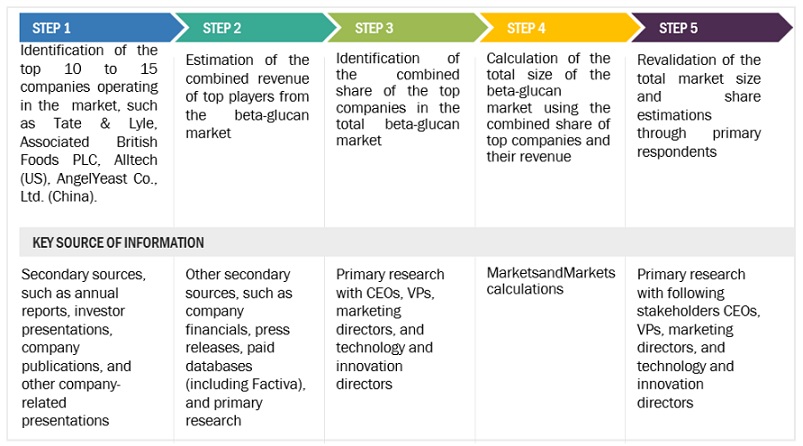
Beta-Glucan Market Supply Side

To know about the assumptions considered for the study, Request for Free Sample Report

Global Beta-glucan market: Top-Down Approach.
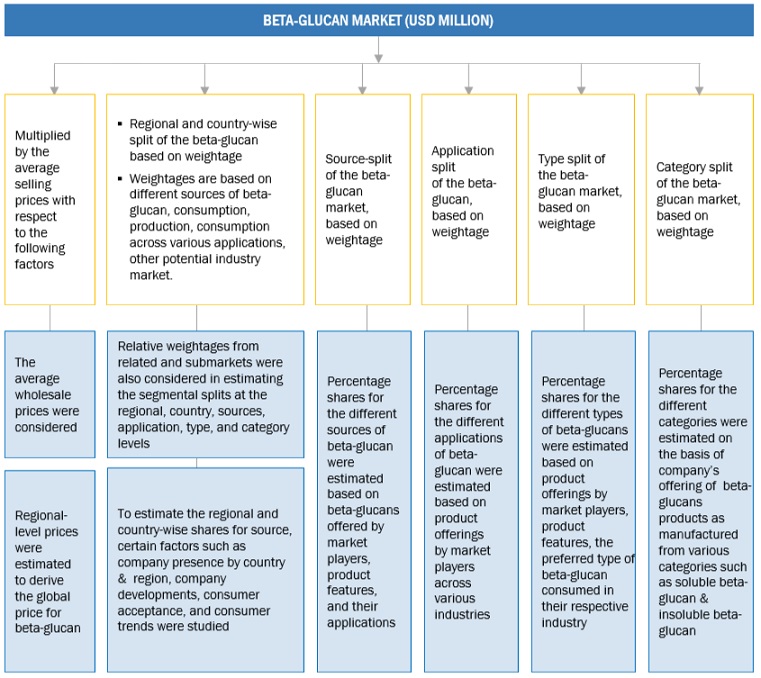
Beta-Glucan  Market Top Down Approach

Data Triangulation

After arriving at the overall market size from the estimation process explained above, the total market was split into several segments and subsegments. The data triangulation and market breakdown procedures were employed, wherever applicable, to estimate the overall beta-glucan market and arrive at the exact statistics for all segments and subsegments. The data was triangulated by studying various factors and trends from the demand and supply sides. The market size was also validated using both the top-down and bottom-up approaches.

Market Definition

Beta-glucans are naturally occurring polysaccharides that function as immunomodulatory agents. That is, they help and regulate the immune system and as dietary fibers that contribute to reducing the total plasma cholesterol and lowering the glycemic index of food. Beta-glucans are predominantly found and extracted from cell walls in yeast, fungi, and seaweed. Primary sources of beta-glucan include yeast, mushrooms, seaweed, and cereals, such as oats, rye, barley, and wheat.

Key Stakeholders

  • Raw material suppliers
  • Regulatory bodies that include the following:
  • Food safety agencies, such as the Food and Drug Administration (FDA), European Food Safety Authority (EFSA), (US Department of Agriculture (USDA), and Food Standards Australia New Zealand (FSANZ)
  • Government agencies and NGOs
  • End users that include the following:
  • Food & beverage manufacturers/suppliers
  • Health & personal care product manufacturers/suppliers
  • Retailers/wholesalers
  • Commercial Research & Development (R&D) institutions and financial institutions
  • Importers and exporters of beta-glucan
  • Traders, distributors, and suppliers
  • Research organizations, trade associations, and industry bodies

Report Objectives

Market Intelligence

  • To determine and project the size of the beta-glucan market with respect to the sources, applications, type, category, and regions in terms of value and volume over five years, ranging from 2024 to 2029.
  • To identify the attractive opportunities in the market by determining the largest and fastest-growing segments across regions
  • To provide detailed information about the key factors influencing market growth (drivers, restraints, opportunities, and challenges)
  • To analyze the opportunities in the market for stakeholders and provide details of the competitive landscape for market leaders.
  • To analyze the micro-markets with respect to individual growth trends, prospects, and their contribution to the total market.
  • To identify and profile the key players in the beta-glucan market.
  • To understand the competitive landscape and identify the major growth strategies adopted by players across the key regions.

Available Customizations:

With the given market data, MarketsandMarkets offers customizations according to company-specific scientific needs.

The following customization options are available for the report:

Product Analysis

  • Product Matrix, which gives a detailed comparison of the product portfolio of each company.

Geographic Analysis

With the given market data, MarketsandMarkets offers customizations according to company-specific scientific needs.

  • Further breakdown of the European beta-glucan market into key countries.
  • Further breakdown of the Rest of Asia Pacific beta-glucan market into key countries.

Company Information

  • Detailed analyses and profiling of additional market players (up to five)
Custom Market Research Services

We will customize the research for you, in case the report listed above does not meet with your exact requirements. Our custom research will comprehensively cover the business information you require to help you arrive at strategic and profitable business decisions.

Request Customization

Instant Answers with GPT - Ask Now!

Ask real questions. Get complete answers !
Report Code
FB 5113
Published ON
Apr, 2024
Choose License Type
BUY NOW
  • SHARE
X
Request Customization
Speak to Analyst
Speak to Analyst
OR FACE-TO-FACE MEETING
PERSONALIZE THIS RESEARCH
  • Triangulate with your Own Data
  • Get Data as per your Format and Definition
  • Gain a Deeper Dive on a Specific Application, Geography, Customer or Competitor
  • Any level of Personalization
REQUEST A FREE CUSTOMIZATION
LET US HELP YOU!
  • What are the Known and Unknown Adjacencies Impacting the Beta-Glucan Market
  • What will your New Revenue Sources be?
  • Who will be your Top Customer; what will make them switch?
  • Defend your Market Share or Win Competitors
  • Get a Scorecard for Target Partners
CUSTOMIZED WORKSHOP REQUEST
+1-888-600-6441
  • Call Us
  • +1-888-600-6441 (Corporate office hours)
  • +1-888-600-6441 (US/Can toll free)
  • +44-800-368-9399 (UK office hours)
CONNECT WITH US
ABOUT TRUST ONLINE
©2024 MarketsandMarkets Research Private Ltd. All rights reserved
DMCA.com Protection Status Website Feedback