Battery Cyclers Market

Battery Cyclers Market by Battery (Lithium-ion, Lead Acid, Nickel-based, Solid-State), Application (End-of-Line, Research), Function (Cell, Module, Pack Testing), Industry (Automotive, Consumer Electronics, Energy) and Region - Global Forecast to 2029

Report Code: SE 9003 Apr, 2024, by marketsandmarkets.com

[218 Pages Report] The battery cyclers market size is predicted to grow from USD 794 million in 2024 to USD 1,609 million by 2029, at a CAGR of 15.2%. Battery cyclers play a fundamental role in the field of battery technology by serving as essential equipment for testing and characterizing batteries. These sophisticated instruments are designed to simulate real-world conditions and assess battery performance, reliability, and durability across various applications. Battery cycles work by subjecting batteries to controlled charge and discharge cycles while monitoring key parameters such as voltage, current, and temperature. This comprehensive testing process enables researchers, manufacturers, and engineers to gain valuable insights into battery behavior, including capacity, power output, cycle life, and degradation mechanisms. The importance of battery cyclers in testing batteries cannot be overstated, as they provide critical data essential for optimizing battery design, enhancing performance, and ensuring safety in diverse industries such as automotives, renewable energy, consumer electronics, and other power storage applications.
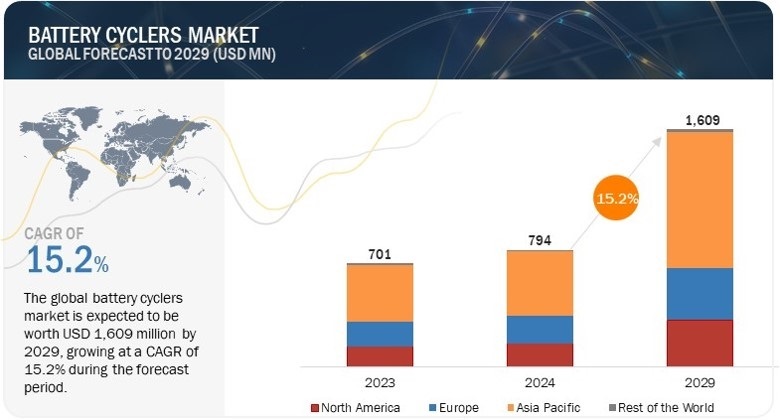
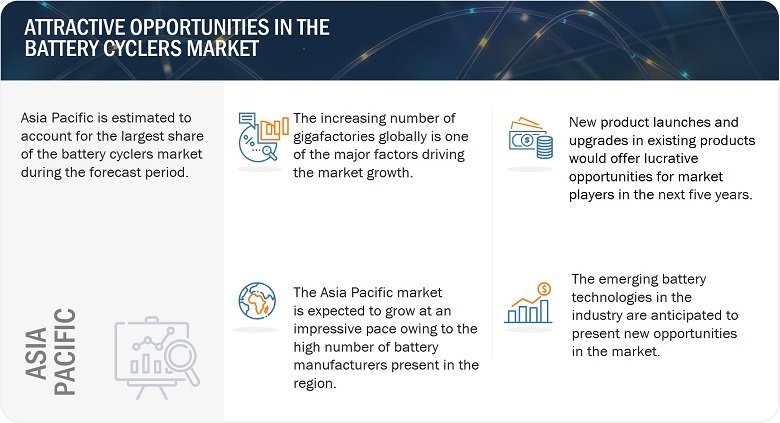
Battery Cyclers Market

Battery Cyclers Market

Battery Cyclers Market Forecast to 2029

To know about the assumptions considered for the study, Request for Free Sample Report

Market Dynamics

DRIVERS: Increased demand for renewable energy

There is a continuously rising demand for renewable energy, resulting in a need for energy storage systems to support its integration into the grid. Efficient battery cyclers are essential tools for researchers, manufacturers, and operators to develop and optimize energy storage solutions that are reliable, cost-effective, and environmentally sustainable. By enabling faster testing and more accurate characterization of batteries, battery cyclers contribute to the advancement and widespread adoption of renewable energy technologies. For instance, according to the IEA Renewables 2023, report published in January 2024, in 2023, these additions soared by almost 50% to nearly 510 gigawatts (GW), marking the fastest growth rate witnessed in the past two decades. This surge in renewable energy production has, in turn, fueled an increased demand for energy storage solutions, including batteries. Consequently, the expanding renewable energy sector has heightened the demand for battery cyclers, essential tools for testing and optimizing the performance of energy storage systems, thus propelling growth in the battery cyclers market.

RESTRAINTS: High initial investment and setup costs

The battery cycler market encounters a notable restraint due to battery cycler equipment's time-consuming and costly nature. Primarily, battery cycling tests, crucial for comprehensively assessing battery parameters and estimating battery life, are notoriously time-intensive. Conducting a complete test cycle can take considerable hours, slowing down research and development processes. Moreover, the need for multiple cycles to obtain comprehensive data further elongates testing durations, impeding the efficiency of battery cycler operations. In addition to time constraints, the high costs associated with battery cycler equipment present a significant barrier. The procurement and maintenance of battery cyclers entail substantial financial investments for research facilities and manufacturing plants. Furthermore, ongoing operational expenses, such as electricity and maintenance, contribute to the overall cost burden. These expenses pose restraints for stakeholders, limiting their ability to invest in cutting-edge equipment and hindering market growth.

OPPORTUNITIES: Emerging EV industry

The flourishing electric vehicles (EVs) market presents significant opportunities for the battery cycler market. EVs heavily rely on Lithium-ion batteries for propulsion and energy storage, emphasizing the critical importance of efficient, reliable, and long-lasting battery systems to ensure optimal vehicle performance and range. Battery cycles play a pivotal role in ensuring the quality and performance of EV batteries through various essential functions. These include performance evaluation, where manufacturers assess battery capacity, power output, and degradation over time under simulated real-world driving conditions. Such evaluations help identify potential weaknesses and optimize battery design for enhanced range and performance. Moreover, battery cyclers facilitate durability testing by subjecting EV batteries to extreme temperature variations, rapid charging/discharging cycles, and other rigorous scenarios. This process helps assess battery safety and durability across diverse operating conditions, ensuring reliability in the demanding EV environment.

CHALLENGES: Availability of alternative testing methods and equipment

A significant challenge for the battery cycler market lies in the availability and utilization of alternative battery test equipment, which may serve as substitutes in specific scenarios. While battery cyclers offer comprehensive testing capabilities, factors such as particular testing goals and equipment limitations may prompt users to opt for alternative solutions. These alternatives may include combined equipment, specialized testers, and others.

The Battery Cyclers Market Ecosystem

Prominent companies in this market include well-established, financially stable manufacturers such as AMETEK.Inc. (US), BioLogic (France), Chroma ATE, Inc. (Taiwan), Arbin Instruments (US), DIGATRON (US). These companies have been operating in the market for several years and possess a diversified product portfolio and strong global sales and marketing networks.
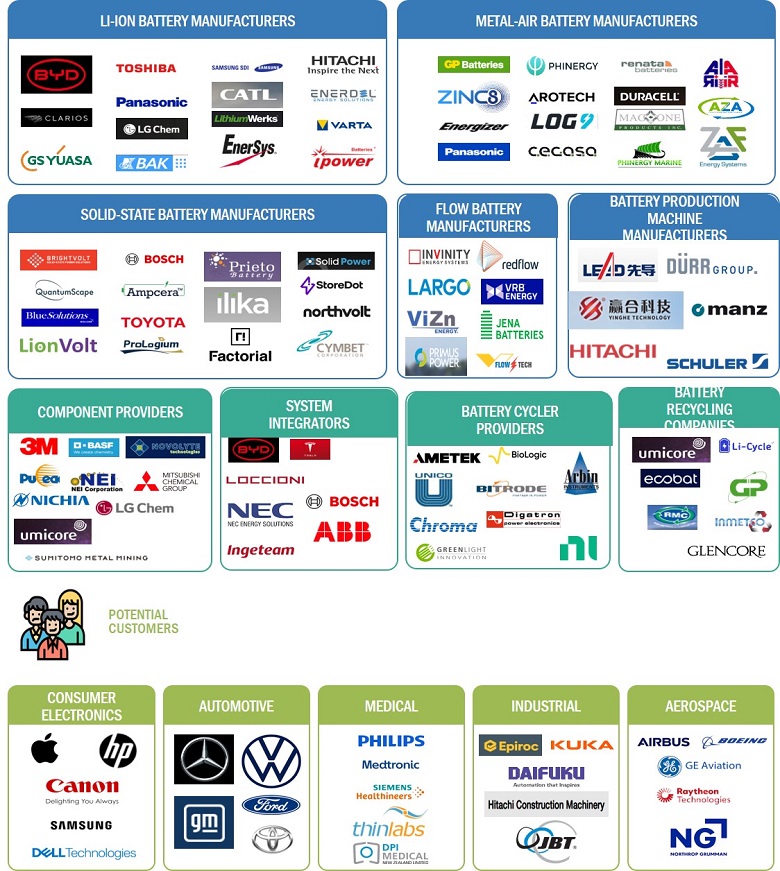
Battery Cyclers Market by Ecosystem

The End-of-Line application segment to grow with the highest CAGR during the forecast period.

The end-of-line applications of battery cyclers are integral to the battery production process, ensuring battery quality, reliability, and safety before reaching consumers. As the final stage of assessment in battery manufacturing, End-of-Line (EOL) testing with battery cyclers encompasses several vital aspects. Firstly, battery cyclers facilitate meticulous quality assurance by scrutinizing the electrical characteristics of batteries and assessing their functionality under various operational conditions, thereby ensuring compliance with predefined standards. Furthermore, EOL testing involves performance validation, where battery cyclers evaluate if batteries meet promised performance metrics such as energy density and cycle life, guaranteeing that they meet required standards.

The market for cell testing is expected to gain substantial market share during forecast period.

Cell testing is crucial for battery development, especially for new technologies, because it allows researchers and engineers to assess and validate battery cells' performance, safety, and reliability under various conditions. Testing provides valuable insights into the behavior of battery cells, helping to identify potential issues, optimize design parameters, and ensure that the cells meet the required specifications and standards. For new technologies, such as advanced lithium-ion batteries or solid-state batteries, cell testing is essential for understanding how these batteries perform in real-world applications, predicting their lifespan, and improving their overall efficiency and safety. By conducting thorough cell testing, developers can fine-tune battery designs, address potential challenges early in the development process, and ultimately accelerate the commercialization of new battery technologies.

The market in Asia Pacific is projected to grow at the highest CAGR from 2024 to 2029.
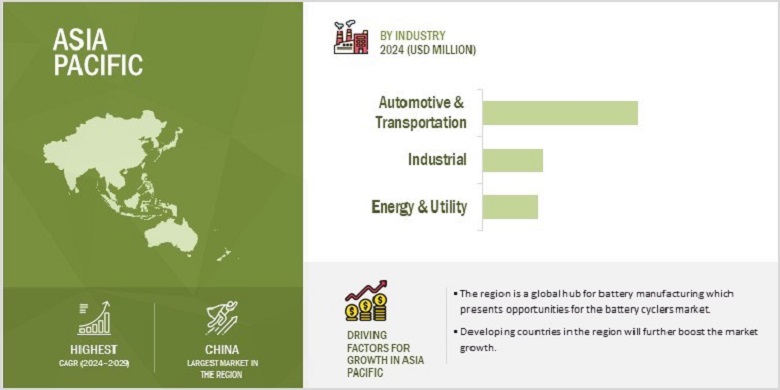
Battery Cyclers Market by Region

Battery Cyclers Market by Region

To know about the assumptions considered for the study, download the pdf brochure

The Asia Pacific market has been segmented into China, Japan, South Korea, and Rest of Asia Pacific (India, Australia, Thailand, Singapore, and Indonesia). The Asia Pacific region emerges as a thriving center for battery production, fueled by abundant raw materials and a robust presence of industry players. With China leading the charge in manufacturing capacity, the lithium-ion battery sector is witnessing remarkable growth in production and consumption. This expanding market is also seeing a parallel surge in demand for battery cyclers, driven by escalating research and development efforts to advance battery technologies across the region. Further, the demand for effective testing equipment intensifies as the battery market flourishes, highlighting the Asia Pacific region's fundamental role in the increasing battery cyclers market.

Key Market Players

AMETEK.Inc. (US), BioLogic (France), Chroma ATE, Inc. (Taiwan), Arbin Instruments (US), DIGATRON (US) are among a few top players in the battery cyclers companies.

Get online access to the report on the World's First Market Intelligence Cloud

  • Easy to Download Historical Data & Forecast Numbers
  • Company Analysis Dashboard for high growth potential opportunities
  • Research Analyst Access for customization & queries
  • Competitor Analysis with Interactive dashboard
  • Latest News, Updates & Trend analysis
Request Sample

Scope of the Report

Report Metric

Details

Market Size Available for Years

2020–2029

Base Year

2023

Forecast Period

2024–2029

Units

Value (USD Million/Billion)

Segments Covered

Battery Type, Application, Function and Industry

Geographic Regions Covered

North America, Asia Pacific, Europe, and RoW

Companies Covered

Major Players: AMETEK.Inc. (US), BioLogic (France), Chroma ATE, Inc. (Taiwan), Arbin Instruments (US), DIGATRON (US),  Unico, LLC (US), Bitrode Corp. (US), Greenlight Innovation Corp. (Canada), AVL (Austria), NATIONAL INSTRUMENTS CORP. (US) and Others- (Total 25 players have been covered)

Battery Cyclers Market Highlights

This research report categorizes the battery cyclers market by battery type, application, function, industry and region.

Segment

Subsegment

By Battery Type:

  • Lithium-ion
  • Lead-acid
  • Nickel-based batteries
  • Other Batteries

By Application:

  • Research 
  • End-of-Line

By Service:

  • Cell Testing
  •  Module Testing
  •  Pack Testing

By Industry:

  • Automotive & Transportation
  • Consumer Electronics
  • Energy & Utility
  • Industrial
  • Education & Research
  • Other industries

By Region:

  • North America
    • US
    • Canada
    • Mexico
  • Europe
    • Germany
    • UK
    • France
    • Rest of Europe
  • Asia Pacific
    • China
    • Japan
    • South Korea
    • Rest of Asia Pacific
  • Rest of the World
    • GCC Countries
    • Africa
    • South America
    • Rest of Middle East

Recent Developments

  • In December 2023, DIGATRON announced the successful completion of a turnkey project in partnership with Voltavision, delivering a customized cell contact system for their client Orion S.A. The project included supplying an MCT-ME cell tester and two temperature chambers, showcasing the seamless integration of Voltavision's cell contact system into Digatron's cabinet, and highlighting the cooperation between innovative technologies and engineering.
  • In September 2023, NATIONAL INSTRUMENTS CORP., unveiled its latest addition to its lineup of high-power test systems for battery testing and simulation: the NHR 4800 high-density battery cycler and emulator. Engineered for modularity, versatility, and safety, the NHR 4800 offers industry-leading power within a remarkably compact design, catering to the diverse demands of battery testing across research, validation, production, and second-life applications in automotive, aerospace, and energy sectors.
  • In June 2023, AMETEK.Inc. launched a new battery cycler, SI-6200, which provides a broader range of capabilities and features. The new battery cycler is Ideal for early-stage testing of battery materials, coin cells, supercapacitors, and micro fuel cells; it provides comprehensive solutions to meet diverse research and development needs at a competitive cost.

Frequently Asked Questions (FAQs)

To speak to our analyst for a discussion on the above findings, click Speak to Analyst

TABLE OF CONTENTS
 
1 INTRODUCTION (Page No. - 29)
    1.1 STUDY OBJECTIVES 
    1.2 MARKET DEFINITION 
    1.3 STUDY SCOPE 
           1.3.1 MARKETS COVERED
                    FIGURE 1 BATTERY CYCLERS MARKET SEGMENTATION
           1.3.2 REGIONAL SCOPE
           1.3.3 YEARS CONSIDERED
           1.3.4 INCLUSIONS AND EXCLUSIONS
    1.4 CURRENCY CONSIDERED 
    1.5 LIMITATIONS 
    1.6 UNITS CONSIDERED 
    1.7 STAKEHOLDERS 
    1.8 IMPACT OF RECESSION 
 
2 RESEARCH METHODOLOGY (Page No. - 34)
    2.1 RESEARCH APPROACH 
           FIGURE 2 BATTERY CYCLERS MARKET: RESEARCH DESIGN
           2.1.1 PRIMARY AND SECONDARY RESEARCH
                    FIGURE 3 BATTERY CYCLERS MARKET: RESEARCH APPROACH
           2.1.2 SECONDARY DATA
                    2.1.2.1 List of major secondary sources
                    2.1.2.2 Key data from secondary sources
           2.1.3 PRIMARY DATA
                    2.1.3.1 Intended participants and opinion leaders in primary interviews
                    2.1.3.2 List of key participants in primary interviews
                    2.1.3.3 Key data from primary sources
                    2.1.3.4 Key industry insights
                    2.1.3.5 Breakdown of primaries
    2.2 MARKET SIZE ESTIMATION 
           2.2.1 BOTTOM-UP APPROACH
                    2.2.1.1 Approach to estimate market size using bottom-up analysis (demand side)
                               FIGURE 4 BATTERY CYCLERS MARKET: BOTTOM-UP APPROACH
           2.2.2 TOP-DOWN APPROACH
                    2.2.2.1 Approach to estimate market size using top-down analysis (supply side)
                               FIGURE 5 BATTERY CYCLERS MARKET: TOP-DOWN APPROACH
                               FIGURE 6 MARKET SIZE ESTIMATION METHODOLOGY: SUPPLY-SIDE ANALYSIS
    2.3 DATA TRIANGULATION 
           FIGURE 7 MARKET BREAKDOWN AND DATA TRIANGULATION
    2.4 RESEARCH ASSUMPTIONS 
           FIGURE 8 RESEARCH ASSUMPTIONS
    2.5 RESEARCH LIMITATIONS 
    2.6 PARAMETERS CONSIDERED TO ANALYZE RECESSION IMPACT ON BATTERY CYCLERS MARKET 
    2.7 RISK ASSESSMENT 
 
3 EXECUTIVE SUMMARY (Page No. - 46)
    FIGURE 9 BATTERY CYCLERS MARKET, 2020–2029 (USD MILLION)
    FIGURE 10 LITHIUM-ION BATTERIES TO LEAD BATTERY CYCLERS MARKET FROM 2024 TO 2029
    FIGURE 11 END-OF-LINE SEGMENT TO DOMINATE BATTERY CYCLERS MARKET, BY APPLICATION, DURING FORECAST PERIOD
    FIGURE 12 AUTOMOTIVE & TRANSPORTATION VERTICAL TO RECORD HIGHEST CAGR IN BATTERY CYCLERS MARKET DURING FORECAST PERIOD
    FIGURE 13 ASIA PACIFIC TO REGISTER HIGHEST CAGR DURING FORECAST PERIOD
 
4 PREMIUM INSIGHTS (Page No. - 50)
    4.1 ATTRACTIVE OPPORTUNITIES FOR PLAYERS IN BATTERY CYCLERS MARKET 
           FIGURE 14 INCREASING NUMBER OF BATTERY GIGAFACTORIES TO DRIVE MARKET GROWTH
    4.2 BATTERY CYCLERS MARKET, BY FUNCTION 
           FIGURE 15 PACK TESTING FUNCTION TO ACCOUNT FOR LARGEST MARKET SHARE IN 2029
    4.3 BATTERY CYCLERS MARKET, BY BATTERY TYPE 
           FIGURE 16 LITHIUM-ION BATTERIES TO HOLD LARGEST MARKET SHARE IN 2029
    4.4 BATTERY CYCLERS MARKET, BY VERTICAL 
           FIGURE 17 AUTOMOTIVE & TRANSPORTATION VERTICAL TO CAPTURE LARGEST MARKET SHARE IN 2029
    4.5 BATTERY CYCLERS MARKET IN NORTH AMERICA, BY VERTICAL AND COUNTRY 
           FIGURE 18 AUTOMOTIVE & TRANSPORTATION SEGMENT AND US TO ACCOUNT FOR MAJORITY OF MARKET SHARE IN 2029
    4.6 BATTERY CYCLERS MARKET, BY COUNTRY 
           FIGURE 19 CHINA TO REGISTER HIGHEST CAGR IN GLOBAL BATTERY CYCLERS MARKET FROM 2024 TO 2029
 
5 MARKET OVERVIEW (Page No. - 53)
    5.1 INTRODUCTION 
    5.2 MARKET DYNAMICS 
           FIGURE 20 BATTERY CYCLERS MARKET: DRIVERS, RESTRAINTS, OPPORTUNITIES, AND CHALLENGES
           5.2.1 DRIVERS
                    5.2.1.1 Rising demand for renewable energy
                    5.2.1.2 Integration of EIS into battery cyclers
                    5.2.1.3 Increasing number of gigafactories worldwide
                               TABLE 1 UPCOMING BATTERY PRODUCTION FACTORIES, BY COMPANY AND COUNTRY
                               FIGURE 21 BATTERY CYCLERS MARKET: IMPACT ANALYSIS OF DRIVERS
           5.2.2 RESTRAINTS
                    5.2.2.1 High initial investment and setup costs
                               FIGURE 22 BATTERY CYCLERS MARKET: IMPACT ANALYSIS OF RESTRAINTS
           5.2.3 OPPORTUNITIES
                    5.2.3.1 Booming electric vehicle industry
                               FIGURE 23 GLOBAL EV CAR STOCK, 2018–2023 (MILLION UNITS)
                    5.2.3.2 Emergence of newer battery technologies
                               FIGURE 24 BATTERY CYCLERS MARKET: IMPACT ANALYSIS OF OPPORTUNITIES
           5.2.4 CHALLENGES
                    5.2.4.1 Availability of alternative testing methods and equipment
                               FIGURE 25 BATTERY CYCLERS MARKET: IMPACT ANALYSIS OF CHALLENGES
    5.3 TRENDS/DISRUPTIONS IMPACTING CUSTOMER BUSINESS 
           FIGURE 26 TRENDS/DISRUPTIONS INFLUENCING CUSTOMER BUSINESS
    5.4 SUPPLY CHAIN ANALYSIS 
           FIGURE 27 BATTERY CYCLERS MARKET: SUPPLY CHAIN ANALYSIS
    5.5 ECOSYSTEM ANALYSIS 
           FIGURE 28 BATTERY CYCLERS MARKET: ECOSYSTEM ANALYSIS
           FIGURE 29 BATTERY CYCLERS MARKET: ECOSYSTEM ANALYSIS
           TABLE 2 PARTICIPANTS IN BATTERY CYCLERS ECOSYSTEM
    5.6 INVESTMENT AND FUNDING SCENARIO 
           FIGURE 30 INVESTMENT AND FUNDING SCENARIO
    5.7 TECHNOLOGY ANALYSIS 
           5.7.1 KEY TECHNOLOGIES
                    5.7.1.1 Electrochemical impedance spectroscopy
           5.7.2 COMPLEMENTARY TECHNOLOGIES
                    5.7.2.1 Data analytics
           5.7.3 ADJACENT TECHNOLOGIES
                    5.7.3.1 Wi-Fi and Bluetooth connectivity
           5.7.4 EMERGING BATTERY TECHNOLOGIES
                    5.7.4.1 Lithium-sulfur batteries
                    5.7.4.2 Lithium-silicon batteries
                    5.7.4.3 Zinc-manganese batteries
                    5.7.4.4 Sodium-sulfur batteries
                    5.7.4.5 Solid-state batteries
                    5.7.4.6 Metal-air batteries
    5.8 PATENT ANALYSIS 
           FIGURE 31 BATTERY CYCLERS MARKET, PATENT ANALYSIS
           TABLE 3 BATTERY CYCLERS MARKET: LIST OF PATENTS, 2022–2023
    5.9 TRADE ANALYSIS 
           5.9.1 IMPORT SCENARIO (HS CODE 850650)
                    FIGURE 32 IMPORT DATA FOR HS CODE 850650-COMPLIANT PRODUCTS, BY COUNTRY, 2018–2022 (USD MILLION)
           5.9.2 EXPORT SCENARIO (HS CODE 850650)
                    FIGURE 33 EXPORT DATA FOR HS CODE 850650-COMPLIANT PRODUCTS, BY COUNTRY, 2018–2022 (USD MILLION)
    5.10 KEY CONFERENCES AND EVENTS, 2024–2025 
           TABLE 4 BATTERY CYCLERS MARKET: LIST OF CONFERENCES AND EVENTS, 2024–2025
    5.11 CASE STUDY ANALYSIS 
           5.11.1 CHROMA ADDRESSED BMW’S EV BATTERY TESTING CHALLENGES USING ITS REGENERATIVE BATTERY PACK TEST SYSTEM
           5.11.2 UNICO TESTED POWERTRAIN AND ENERGY STORAGE SYSTEMS DESIGNED FOR MOTORSPORT APPLICATIONS USING BATTERY CYCLERS
           5.11.3 AMBRI ADOPTED ARBIN’S BATTERY CYCLERS TO TEST ITS LIQUID METAL BATTERIES DESIGNED FOR ELECTRIC GRID AND DATA CENTER APPLICATIONS
    5.12 REGULATORY LANDSCAPE 
           5.12.1 REGULATORY BODIES, GOVERNMENT AGENCIES, AND OTHER ORGANIZATIONS
                    TABLE 5 NORTH AMERICA: LIST OF REGULATORY BODIES, GOVERNMENT AGENCIES, AND OTHER ORGANIZATIONS
                    TABLE 6 EUROPE: LIST OF REGULATORY BODIES, GOVERNMENT AGENCIES, AND OTHER ORGANIZATIONS
                    TABLE 7 ASIA PACIFIC: LIST OF REGULATORY BODIES, GOVERNMENT AGENCIES, AND OTHER ORGANIZATIONS
                    TABLE 8 ROW: LIST OF REGULATORY BODIES, GOVERNMENT AGENCIES, AND OTHER ORGANIZATIONS
           5.12.2 STANDARDS
                    TABLE 9 STATUTORY REGULATIONS AND STANDARDS RELATED TO BATTERY CYCLERS
    5.13 PORTER’S FIVE FORCES ANALYSIS 
           FIGURE 34 BATTERY CYCLERS MARKET: PORTER’S FIVE FORCES ANALYSIS
           TABLE 10 BATTERY CYCLERS MARKET: PORTER’S FIVE FORCES ANALYSIS
           5.13.1 BARGAINING POWER OF SUPPLIERS
           5.13.2 BARGAINING POWER OF BUYERS
           5.13.3 THREAT OF NEW ENTRANTS
           5.13.4 THREAT OF SUBSTITUTES
           5.13.5 INTENSITY OF COMPETITIVE RIVALRY
    5.14 KEY STAKEHOLDERS AND BUYING CRITERIA 
           5.14.1 KEY STAKEHOLDERS IN BUYING PROCESS
                    FIGURE 35 INFLUENCE OF STAKEHOLDERS ON BUYING PROCESS FOR TOP 3 VERTICALS
                    TABLE 11 INFLUENCE OF STAKEHOLDERS ON BUYING PROCESS FOR TOP 3 VERTICALS (%)
           5.14.2 BUYING CRITERIA
                    FIGURE 36 KEY BUYING CRITERIA FOR TOP 3 VERTICALS
                    TABLE 12 KEY BUYING CRITERIA FOR TOP 3 VERTICALS
    5.15 PRICING ANALYSIS 
           5.15.1 INDICATIVE PRICING TREND, BY FUNCTION
                    TABLE 13 INDICATIVE PRICING TREND, BY FUNCTION
                    FIGURE 37 INDICATIVE PRICING TREND OF BATTERY CYCLERS, 2020–2023 (USD)
                    TABLE 14 INDICATIVE PRICING TREND OF KEY PLAYERS,BY FUNCTION
                    FIGURE 38 INDICATIVE PRICING TREND OF BATTERY CYCLERS PROVIDED BY KEY PLAYERS FOR PACK TESTING (USD)
           5.15.2 INDICATIVE PRICING TREND, BY REGION
                    TABLE 15 INDICATIVE PRICING TREND OF PACK BATTERY CYCLERS, BY REGION
                    FIGURE 39 AVERAGE SELLING PRICE TREND OF BATTERY CYCLERS, BY REGION, 2020–2023, (USD)
 
6 COMPONENTS OF BATTERY CYCLERS (Page No. - 87)
    6.1 INTRODUCTION 
           FIGURE 40 COMPONENTS OF BATTERY CYCLERS
    6.2 HARDWARE 
    6.3 SOFTWARE 
 
7 BATTERY CYCLERS MARKET, BY FUNCTION (Page No. - 89)
    7.1 INTRODUCTION 
           FIGURE 41 BATTERY CYCLERS MARKET, BY FUNCTION
           FIGURE 42 PACK TESTING TO ACCOUNT FOR LARGEST SHARE OF BATTERY CYCLERS MARKET DURING FORECAST PERIOD
           TABLE 16 BATTERY CYCLERS MARKET, BY FUNCTION, 2020–2023 (USD MILLION)
           TABLE 17 BATTERY CYCLERS MARKET, BY FUNCTION, 2024–2029 (USD MILLION)
           TABLE 18 BATTERY CYCLERS MARKET, 2020–2023 (THOUSAND UNITS)
           TABLE 19 BATTERY CYCLERS MARKET, 2024–2029 (THOUSAND UNITS)
    7.2 CELL TESTING 
           7.2.1 GROWING DEMAND FROM RESEARCH AND LABORATORIES TO STIMULATE SEGMENTAL GROWTH
    7.3 MODULE TESTING 
           7.3.1 NEED TO ASSESS INTERACTION OF BATTERY CELLS WITHIN MODULE STRUCTURE FOR SAFETY TO DRIVE MARKET
    7.4 PACK TESTING 
           7.4.1 STRINGENT QUALITY AND SAFETY STANDARDS TO BOOST DEMAND FOR BATTERY CYCLERS IN PACK TESTING
 
8 BATTERY CYCLERS MARKET, BY BATTERY TYPE (Page No. - 94)
    8.1 INTRODUCTION 
           FIGURE 43 BATTERY CYCLERS MARKET, BY BATTERY TYPE
           FIGURE 44 LITHIUM-ION SEGMENT TO DOMINATE MARKET THROUGHOUT FORECAST PERIOD
           TABLE 20 BATTERY CYCLERS MARKET, BY BATTERY TYPE, 2020–2023 (USD MILLION)
           TABLE 21 BATTERY CYCLERS MARKET, BY BATTERY TYPE, 2024–2029 (USD MILLION)
    8.2 LITHIUM-ION 
           8.2.1 PRECISE VOLTAGE CONTROL AND ADVANCED CURRENT PROFILING FEATURES OF BATTERY CYCLERS TO INCREASE DEMAND FOR TESTING LI-ION BATTERIES
                    TABLE 22 LITHIUM-ION: BATTERY CYCLERS MARKET, BY VERTICAL, 2020–2023 (USD MILLION)
                    TABLE 23 LITHIUM-ION: BATTERY CYCLERS MARKET, BY VERTICAL, 2024–2029 (USD MILLION)
                    TABLE 24 LITHIUM-ION: BATTERY CYCLERS MARKET, BY REGION, 2020–2023 (USD MILLION)
                    TABLE 25 LITHIUM-ION: BATTERY CYCLERS MARKET, BY REGION, 2024–2029 (USD MILLION)
    8.3 LEAD-ACID 
           8.3.1 SIGNIFICANT DEPLOYMENT OF LEAD-ACID BATTERIES IN MODERN AUTOMOBILES TO PROPEL BATTERY CYCLER DEMAND FOR QUALITY INSPECTION
                    TABLE 26 LEAD-ACID: BATTERY CYCLERS MARKET, BY VERTICAL, 2020–2023 (USD MILLION)
                    TABLE 27 LEAD-ACID: BATTERY CYCLERS MARKET, BY VERTICAL, 2024–2029 (USD MILLION)
                    TABLE 28 LEAD-ACID: BATTERY CYCLERS MARKET, BY REGION, 2020–2023 (USD MILLION)
                    TABLE 29 LEAD-ACID: BATTERY CYCLERS MARKET, BY REGION, 2024–2029 (USD MILLION)
    8.4 NICKEL-BASED 
           8.4.1 STRONG FOCUS ON ENHANCING SAFETY AND PERFORMANCE OF NICKEL-BASED BATTERIES TO BOOST DEMAND FOR BATTERY CYCLERS
                    TABLE 30 NICKEL-BASED: BATTERY CYCLERS MARKET, BY VERTICAL, 2020–2023 (USD MILLION)
                    TABLE 31 NICKEL-BASED: BATTERY CYCLERS MARKET, BY VERTICAL, 2024–2029 (USD MILLION)
                    TABLE 32 NICKEL-BASED: BATTERY CYCLERS MARKET, BY REGION, 2020–2023 (USD MILLION)
                    TABLE 33 NICKEL-BASED BATTERIES: BATTERY CYCLERS MARKET, BY REGION, 2024–2029 (USD MILLION)
    8.5 OTHER BATTERY TYPES 
           TABLE 34 OTHER BATTERY TYPES: BATTERY CYCLERS MARKET, BY VERTICAL, 2020–2023 (USD MILLION)
           TABLE 35 OTHER BATTERY TYPES: BATTERY CYCLERS MARKET, BY VERTICAL, 2024–2029 (USD MILLION)
           TABLE 36 OTHER BATTERY TYPES: BATTERY CYCLERS MARKET, BY REGION, 2020–2023 (USD MILLION)
           TABLE 37 OTHER BATTERY TYPES: BATTERY CYCLERS MARKET, BY REGION, 2024–2029 (USD MILLION)
 
9 BATTERY CYCLERS MARKET, BY APPLICATION (Page No. - 105)
    9.1 INTRODUCTION 
           FIGURE 45 BATTERY CYCLERS, BY APPLICATION
           FIGURE 46 END-OF-LINE SEGMENT TO LEAD BATTERY CYCLERS MARKET THROUGHOUT FORECAST PERIOD
           TABLE 38 BATTERY CYCLERS MARKET, BY APPLICATION, 2020–2023 (USD MILLION)
           TABLE 39 BATTERY CYCLERS MARKET, BY APPLICATION, 2024–2029 (USD MILLION)
    9.2 RESEARCH 
           9.2.1 USE OF BATTERY CYCLERS TO EVALUATE NEW BATTERY TECHNOLOGIES TO BOOST SEGMENTAL GROWTH
    9.3 END-OF-LINE 
           9.3.1 ADOPTION OF BATTERY CYCLERS TO ENSURE FINAL QUALITY CHECK DURING PRODUCTION PROCESSES TO FUEL SEGMENTAL GROWTH
 
10 BATTERY CYCLERS MARKET, BY VERTICAL (Page No. - 109)
     10.1 INTRODUCTION 
             FIGURE 47 BATTERY CYCLERS MARKET, BY VERTICAL
             FIGURE 48 AUTOMOTIVE & TRANSPORTATION SEGMENT TO EXHIBIT HIGHEST CAGR IN BATTERY CYCLERS MARKET DURING FORECAST PERIOD
             TABLE 40 BATTERY CYCLERS MARKET, BY VERTICAL, 2020–2023 (USD MILLION)
             TABLE 41 BATTERY CYCLERS MARKET, BY VERTICAL, 2024–2029 (USD MILLION)
     10.2 AUTOMOTIVE & TRANSPORTATION 
             10.2.1 RISING DEMAND FOR ELECTRIC AND HYBRID ELECTRIC VEHICLES TO DRIVE MARKET
                        TABLE 42 AUTOMOTIVE & TRANSPORTATION: BATTERY CYCLERS MARKET, BY BATTERY TYPE, 2020–2023 (USD MILLION)
                        TABLE 43 AUTOMOTIVE & TRANSPORTATION: BATTERY CYCLERS MARKET, BY BATTERY TYPE, 2024–2029 (USD MILLION)
                        TABLE 44 AUTOMOTIVE & TRANSPORTATION: BATTERY CYCLERS MARKET, BY REGION, 2020–2023 (USD MILLION)
                        TABLE 45 AUTOMOTIVE & TRANSPORTATION: BATTERY CYCLERS MARKET, BY REGION, 2024–2029 (USD MILLION)
     10.3 CONSUMER ELECTRONICS 
             10.3.1 SURGING NEED FOR RELIABLE AND DURABLE BATTERIES FOR LAPTOPS AND SMARTPHONES TO FUEL MARKET GROWTH
                        TABLE 46 CONSUMER ELECTRONICS: BATTERY CYCLERS MARKET, BY BATTERY TYPE, 2020–2023 (USD MILLION)
                        TABLE 47 CONSUMER ELECTRONICS: BATTERY CYCLERS MARKET, BY BATTERY TYPE, 2024–2029 (USD MILLION)
                        TABLE 48 CONSUMER ELECTRONICS: BATTERY CYCLERS MARKET, BY REGION, 2020–2023 (USD MILLION)
                        TABLE 49 CONSUMER ELECTRONICS: BATTERY CYCLERS MARKET, BY REGION, 2024–2029 (USD MILLION)
     10.4 ENERGY & UTILITIES 
             10.4.1 NEED TO EVALUATE BATTERY LIFESPAN FOR LARGE-SCALE GRID APPLICATIONS TO ACCELERATE DEMAND FOR BATTERY CYCLERS
                        TABLE 50 ENERGY & UTILITIES: BATTERY CYCLERS MARKET, BY BATTERY TYPE, 2020–2023 (USD MILLION)
                        TABLE 51 ENERGY & UTILITIES: BATTERY CYCLERS MARKET, BY BATTERY TYPE, 2024–2029 (USD MILLION)
                        TABLE 52 ENERGY & UTILITIES: BATTERY CYCLERS MARKET, BY REGION, 2020–2023 (USD MILLION)
                        TABLE 53 ENERGY & UTILITIES: BATTERY CYCLERS MARKET, BY REGION, 2024–2029 (USD MILLION)
     10.5 INDUSTRIAL 
             10.5.1 GROWING DEMAND FOR BATTERIES MEETING REQUIRED INDUSTRIAL SPECIFICATIONS AND STANDARDS TO DRIVE MARKET
                        TABLE 54 INDUSTRIAL: BATTERY CYCLERS MARKET, BY BATTERY TYPE, 2020–2023 (USD MILLION)
                        TABLE 55 INDUSTRIAL: BATTERY CYCLERS MARKET, BY BATTERY TYPE, 2024–2029 (USD MILLION)
                        TABLE 56 INDUSTRIAL: BATTERY CYCLERS MARKET, BY REGION, 2020–2023 (USD MILLION)
                        TABLE 57 INDUSTRIAL: BATTERY CYCLERS MARKET, BY REGION, 2024–2029 (USD MILLION)
     10.6 EDUCATION & RESEARCH 
             10.6.1 ABILITY OF BATTERY CYCLERS TO ANALYZE BATTERY CHEMISTRIES AND CHARACTERISTICS TO BOOST DEMAND
                        TABLE 58 EDUCATION & RESEARCH: BATTERY CYCLERS MARKET, BY BATTERY TYPE, 2020–2023 (USD MILLION)
                        TABLE 59 EDUCATION & RESEARCH: BATTERY CYCLERS MARKET, BY BATTERY TYPE, 2024–2029 (USD MILLION)
                        TABLE 60 EDUCATION & RESEARCH: BATTERY CYCLERS MARKET, BY REGION, 2020–2023 (USD MILLION)
                        TABLE 61 EDUCATION & RESEARCH: BATTERY CYCLERS MARKET, BY REGION, 2024–2029 (USD MILLION)
     10.7 OTHER VERTICALS 
             TABLE 62 OTHER VERTICALS: BATTERY CYCLERS MARKET, BY BATTERY TYPE, 2020–2023 (USD MILLION)
             TABLE 63 OTHER VERTICALS: BATTERY CYCLERS MARKET, BY BATTERY TYPE, 2024–2029 (USD MILLION)
             TABLE 64 OTHER VERTICALS: BATTERY CYCLERS MARKET, BY REGION, 2020–2023 (USD MILLION)
             TABLE 65 OTHER VERTICALS: BATTERY CYCLERS MARKET, BY REGION, 2024–2029 (USD MILLION)
 
11 BATTERY CYCLERS MARKET, BY REGION (Page No. - 122)
     11.1 INTRODUCTION 
             FIGURE 49 BATTERY CYCLERS MARKET, BY REGION
             FIGURE 50 CHINA TO EXHIBIT HIGHEST CAGR IN GLOBAL BATTERY CYCLERS MARKET DURING FORECAST PERIOD
             TABLE 66 BATTERY CYCLERS MARKET, BY REGION, 2020–2023 (USD MILLION)
             TABLE 67 BATTERY CYCLERS MARKET, BY REGION, 2024–2029 (USD MILLION)
     11.2 NORTH AMERICA 
             11.2.1 NORTH AMERICA: RECESSION IMPACT
                        FIGURE 51 NORTH AMERICA: SNAPSHOT OF BATTERY CYCLERS MARKET
                        FIGURE 52 US TO ACCOUNT FOR LARGEST SHARE OF NORTH AMERICAN BATTERY CYCLERS MARKET DURING FORECAST PERIOD
                        TABLE 68 NORTH AMERICA: BATTERY CYCLERS MARKET, BY COUNTRY, 2020–2023 (USD MILLION)
                        TABLE 69 NORTH AMERICA: BATTERY CYCLERS MARKET, BY COUNTRY, 2024–2029 (USD MILLION)
                        TABLE 70 NORTH AMERICA: BATTERY CYCLERS MARKET, BY APPLICATION, 2020–2023 (USD MILLION)
                        TABLE 71 NORTH AMERICA: BATTERY CYCLERS MARKET, BY APPLICATION, 2024–2029 (USD MILLION)
                        TABLE 72 NORTH AMERICA: BATTERY CYCLERS MARKET, BY BATTERY TYPE, 2020–2023 (USD MILLION)
                        TABLE 73 NORTH AMERICA: BATTERY CYCLERS MARKET, BY BATTERY TYPE, 2024–2029 (USD MILLION)
                        TABLE 74 NORTH AMERICA: BATTERY CYCLERS MARKET, BY VERTICAL, 2020–2023 (USD MILLION)
                        TABLE 75 NORTH AMERICA: BATTERY CYCLERS MARKET, BY VERTICAL, 2024–2029 (USD MILLION)
             11.2.2 US
                        11.2.2.1 Increasing demand for Li-ion batteries with growing EV adoption to drive market
             11.2.3 CANADA
                        11.2.3.1 Easy access to raw materials required to manufacture batteries to fuel market growth
             11.2.4 MEXICO
                        11.2.4.1 Increasing investment in Li-ion battery manufacturing to drive market
     11.3 EUROPE 
             11.3.1 EUROPE: RECESSION IMPACT
                        FIGURE 53 EUROPE: SNAPSHOT OF BATTERY CYCLERS MARKET
                        FIGURE 54 GERMANY TO REGISTER HIGHEST CAGR IN EUROPEAN BATTERY CYCLERS MARKET DURING FORECAST PERIOD
                        TABLE 76 EUROPE: BATTERY CYCLERS MARKET, BY COUNTRY, 2020–2023 (USD MILLION)
                        TABLE 77 EUROPE: BATTERY CYCLERS MARKET, BY COUNTRY, 2024–2029 (USD MILLION)
                        TABLE 78 EUROPE: BATTERY CYCLERS MARKET, BY APPLICATION, 2020–2023 (USD MILLION)
                        TABLE 79 EUROPE: BATTERY CYCLERS MARKET, BY APPLICATION, 2024–2029 (USD MILLION)
                        TABLE 80 EUROPE: BATTERY CYCLERS MARKET, BY BATTERY TYPE, 2020–2023 (USD MILLION)
                        TABLE 81 EUROPE: BATTERY CYCLERS MARKET, BY BATTERY TYPE, 2024–2029 (USD MILLION)
                        TABLE 82 EUROPE: BATTERY CYCLERS MARKET, BY VERTICAL, 2020–2023 (USD MILLION)
                        TABLE 83 EUROPE: BATTERY CYCLERS MARKET, BY VERTICAL, 2024–2029 (USD MILLION)
             11.3.2 GERMANY
                        11.3.2.1 Prominent presence of key automakers to boost demand
             11.3.3 UK
                        11.3.3.1 Rising investment in developing advanced battery solutions to create opportunities
             11.3.4 FRANCE
                        11.3.4.1 Strategic focus on developing lithium industry to meet rising demand for EV batteries to foster market growth
             11.3.5 REST OF EUROPE
     11.4 ASIA PACIFIC 
             11.4.1 ASIA PACIFIC: RECESSION IMPACT
                        FIGURE 55 ASIA PACIFIC: SNAPSHOT OF BATTERY CYCLERS MARKET
                        FIGURE 56 CHINA TO DOMINATE BATTERY CYCLERS MARKET IN ASIA PACIFIC DURING FORECAST PERIOD
                        TABLE 84 ASIA PACIFIC: BATTERY CYCLERS MARKET, BY COUNTRY, 2020–2023 (USD MILLION)
                        TABLE 85 ASIA PACIFIC: BATTERY CYCLERS MARKET, BY COUNTRY, 2024–2029 (USD MILLION)
                        TABLE 86 ASIA PACIFIC: BATTERY CYCLERS MARKET, BY APPLICATION, 2020–2023 (USD MILLION)
                        TABLE 87 ASIA PACIFIC: BATTERY CYCLERS MARKET, BY APPLICATION, 2024–2029 (USD MILLION)
                        TABLE 88 ASIA PACIFIC: BATTERY CYCLERS MARKET, BY BATTERY TYPE, 2020–2023 (USD MILLION)
                        TABLE 89 ASIA PACIFIC: BATTERY CYCLERS MARKET, BY BATTERY TYPE, 2024–2029 (USD MILLION)
                        TABLE 90 ASIA PACIFIC: BATTERY CYCLERS MARKET, BY VERTICAL, 2020–2023 (USD MILLION)
                        TABLE 91 ASIA PACIFIC: BATTERY CYCLERS MARKET, BY VERTICAL, 2024–2029 (USD MILLION)
             11.4.2 CHINA
                        11.4.2.1 Increasing number of battery gigafactories to accelerate market growth
             11.4.3 JAPAN
                        11.4.3.1 Rising investment in EV manufacturing to fuel market growth
             11.4.4 SOUTH KOREA
                        11.4.4.1 Government-led subsidies for EV battery manufacturers and users to stimulate market growth
             11.4.5 INDIA
                        11.4.5.1 Government initiatives to expand battery manufacturing capacity to drive market
             11.4.6 REST OF ASIA PACIFIC
     11.5 ROW 
             11.5.1 ROW: RECESSION IMPACT
                        FIGURE 57 SOUTH AMERICA TO REGISTER HIGHEST CAGR IN BATTERY CYCLERS MARKET IN ROW DURING FORECAST PERIOD
                        TABLE 92 ROW: BATTERY CYCLERS MARKET, BY GEOGRAPHY, 2020–2023 (USD MILLION)
                        TABLE 93 ROW: BATTERY CYCLERS MARKET, BY GEOGRAPHY, 2024–2029 (USD MILLION)
                        TABLE 94 ROW: BATTERY CYCLERS MARKET, BY APPLICATION, 2020–2023 (USD MILLION)
                        TABLE 95 ROW: BATTERY CYCLERS MARKET, BY APPLICATION, 2024–2029 (USD MILLION)
                        TABLE 96 ROW: BATTERY CYCLERS MARKET, BY BATTERY TYPE, 2020–2023 (USD MILLION)
                        TABLE 97 ROW: BATTERY CYCLERS MARKET, BY BATTERY TYPE, 2024–2029 (USD MILLION)
                        TABLE 98 ROW: BATTERY CYCLERS MARKET, BY VERTICAL, 2020–2023 (USD MILLION)
                        TABLE 99 ROW: BATTERY CYCLERS MARKET, BY VERTICAL, 2024–2029 (USD MILLION)
             11.5.2 GCC COUNTRIES
                        11.5.2.1 Increased demand for EVs to boost market growth
             11.5.3 AFRICA
                        11.5.3.1 Abundance of lithium reserves to stimulate market growth
             11.5.4 SOUTH AMERICA
                        11.5.4.1 Growing focus on Li-ion battery production to bolster demand
             11.5.5 REST OF MIDDLE EAST
 
12 COMPETITIVE LANDSCAPE (Page No. - 149)
     12.1 INTRODUCTION 
     12.2 KEY PLAYER STRATEGIES/RIGHT TO WIN, 2020–2023 
             TABLE 100 BATTERY CYCLERS MARKET: OVERVIEW OF STRATEGIES ADOPTED BY KEY PLAYERS, 2020–2023
     12.3 REVENUE ANALYSIS, 2018–2022 
             FIGURE 58 BATTERY CYCLERS MARKET, REVENUE ANALYSIS OF TOP PLAYERS, 2018–2022
     12.4 MARKET SHARE ANALYSIS, 2023 
             FIGURE 59 BATTERY CYCLERS MARKET SHARE ANALYSIS, 2023
             TABLE 101 BATTERY CYCLERS MARKET SHARE ANALYSIS, 2023
     12.5 COMPANY VALUATION AND FINANCIAL METRICS 
             FIGURE 60 COMPANY VALUATION (USD BILLION), 2023
             FIGURE 61 FINANCIAL METRICS (EV/EBITDA), 2023
     12.6 BRAND/PRODUCT COMPARISON 
             FIGURE 62 BATTERY CYCLERS MARKET: BRAND/PRODUCT COMPARISON
     12.7 COMPANY EVALUATION MATRIX: KEY PLAYERS, 2023 
             12.7.1 STARS
             12.7.2 EMERGING LEADERS
             12.7.3 PERVASIVE PLAYERS
             12.7.4 PARTICIPANTS
                        FIGURE 63 BATTERY CYCLERS MARKET: COMPANY EVALUATION MATRIX (KEY PLAYERS), 2023
             12.7.5 COMPANY FOOTPRINT: KEY PLAYERS, 2023
                        12.7.5.1 Company footprint
                                     FIGURE 64 BATTERY CYCLERS MARKET: COMPANY FOOTPRINT
                        12.7.5.2 Function footprint
                                     TABLE 102 BATTERY CYCLERS MARKET: FUNCTION FOOTPRINT
                        12.7.5.3 Application footprint
                                     TABLE 103 BATTERY CYCLERS MARKET: APPLICATION FOOTPRINT
                        12.7.5.4 Battery type footprint
                                     TABLE 104 BATTERY CYCLERS MARKET: BATTERY TYPE FOOTPRINT
                        12.7.5.5 Vertical footprint
                                     TABLE 105 BATTERY CYCLERS MARKET: VERTICAL FOOTPRINT
                        12.7.5.6 Region footprint
                                     TABLE 106 BATTERY CYCLERS MARKET: REGION FOOTPRINT
     12.8 COMPANY EVALUATION MATRIX: STARTUPS/SMES, 2023 
             12.8.1 PROGRESSIVE COMPANIES
             12.8.2 RESPONSIVE COMPANIES
             12.8.3 DYNAMIC COMPANIES
             12.8.4 STARTING BLOCKS
                        FIGURE 65 BATTERY CYCLERS MARKET: COMPANY EVALUATION MATRIX (STARTUPS/SMES), 2023
             12.8.5 COMPETITIVE BENCHMARKING, STARTUPS/SMES, 2023
                        12.8.5.1 Detailed list of key startups/SMEs
                                     TABLE 107 BATTERY CYCLERS MARKET: LIST OF KEY STARTUPS/SMES
                        12.8.5.2 Competitive benchmarking of key startups/SMEs
                                     TABLE 108 BATTERY CYCLERS MARKET: COMPETITIVE BENCHMARKING OF KEY STARTUPS/SMES
     12.9 COMPETITIVE SCENARIO AND TRENDS 
             12.9.1 PRODUCT LAUNCHES
                        TABLE 109 BATTERY CYCLERS MARKET: PRODUCT LAUNCHES, JANUARY 2020−DECEMBER 2023
             12.9.2 DEALS
                        TABLE 110 BATTERY CYCLERS MARKET: DEALS, JANUARY 2020−DECEMBER 2023
             12.9.3 OTHERS
                        TABLE 111 BATTERY CYCLERS MARKET: OTHERS, JANUARY 2020−DECEMBER 2023
 
13 COMPANY PROFILES (Page No. - 172)
(Business Overview, Products/Solutions/Services Offered, Recent Developments, and MnM View (Key strengths/Right to Win, Strategic Choices Made, and Weaknesses and Competitive Threats))*  
     13.1 KEY PLAYERS 
             13.1.1 AMETEK, INC.
                        TABLE 112 AMETEK, INC.: COMPANY OVERVIEW
                        FIGURE 66 AMETEK, INC.: COMPANY SNAPSHOT
                        TABLE 113 AMETEK, INC.: PRODUCTS/SOLUTIONS/SERVICES OFFERED
                        TABLE 114 AMETEK, INC.: PRODUCT LAUNCHES, 2020–2023
             13.1.2 BIOLOGIC
                        TABLE 115 BIOLOGIC: COMPANY OVERVIEW
                        TABLE 116 BIOLOGIC: PRODUCTS/SOLUTIONS/SERVICES OFFERED
             13.1.3 CHROMA ATE INC.
                        TABLE 117 CHROMA ATE INC.: COMPANY OVERVIEW
                        FIGURE 67 CHROMA ATE INC.: COMPANY SNAPSHOT
                        TABLE 118 CHROMA ATE INC.: PRODUCTS/SOLUTIONS/SERVICES OFFERED
             13.1.4 ARBIN INSTRUMENTS
                        TABLE 119 ARBIN INSTRUMENTS: COMPANY OVERVIEW
                        TABLE 120 ARBIN INSTRUMENTS: PRODUCTS/SOLUTIONS/SERVICES OFFERED
                        TABLE 121 ARBIN INSTRUMENTS: DEALS, 2020–2023
             13.1.5 DIGATRON
                        TABLE 122 DIGATRON: COMPANY OVERVIEW
                        TABLE 123 DIGATRON: PRODUCTS/SOLUTIONS/SERVICES OFFERED
                        TABLE 124 DIGATRON: DEALS, 2020–2023
             13.1.6 AVL
                        TABLE 125 AVL: COMPANY OVERVIEW
                        TABLE 126 AVL: PRODUCTS/SOLUTIONS/SERVICES OFFERED
                        TABLE 127 AVL: OTHERS, 2020–2023
             13.1.7 BITRODE CORP.
                        TABLE 128 BITRODE CORP.: COMPANY OVERVIEW
                        TABLE 129 BITRODE CORP.: PRODUCTS/SOLUTIONS/SERVICES OFFERED
                        TABLE 130 BITRODE CORP.: PRODUCT LAUNCHES, 2020–2023
                        TABLE 131 BITRODE CORP.: DEALS, 2020–2023
             13.1.8 GREENLIGHT INNOVATION CORP.
                        TABLE 132 GREENLIGHT INNOVATION CORP.: COMPANY OVERVIEW
                        TABLE 133 GREENLIGHT INNOVATION CORP.: PRODUCTS/SOLUTIONS/SERVICES OFFERED
                        TABLE 134 GREENLIGHT INNOVATION CORP.: OTHERS, 2020–2023
             13.1.9 NATIONAL INSTRUMENTS CORP.
                        TABLE 135 NATIONAL INSTRUMENTS CORP.: COMPANY OVERVIEW
                        TABLE 136 NATIONAL INSTRUMENTS CORP.: PRODUCTS/SOLUTIONS/SERVICES OFFERED
                        TABLE 137 NATIONAL INSTRUMENTS CORP.: PRODUCT LAUNCHES, 2020–2023
                        TABLE 138 NATIONAL INSTRUMENTS CORP.: DEALS, 2020–2023
             13.1.10 MACCOR, INC.
                        TABLE 139 MACCOR, INC.: COMPANY OVERVIEW
                        TABLE 140 MACCOR, INC.: PRODUCTS/SOLUTIONS/SERVICES OFFERED
             13.1.11 NEWARE
                        TABLE 141 NEWARE: COMPANY OVERVIEW
                        TABLE 142 NEWARE: PRODUCTS/SOLUTIONS/SERVICES OFFERED
             13.1.12 UNICO, LLC.
                        TABLE 143 UNICO, LLC.: COMPANY OVERVIEW
                        TABLE 144 UNICO, LLC.: PRODUCTS/SOLUTIONS/SERVICES OFFERED
     13.2 OTHER PLAYERS 
             13.2.1 ADMIRAL INSTRUMENTS
             13.2.2 BATTERY ASSOCIATES
             13.2.3 GUANGDONG HYNN TECHNOLOGY CO., LTD.
             13.2.4 IVIUM TECHNOLOGIES B.V.
             13.2.5 MAK
             13.2.6 MATSUSADA PRECISION INC.
             13.2.7 NEBULA
             13.2.8 PEC
             13.2.9 REXGEAR
             13.2.10 XIAMEN AOT ELECTRONICS TECHNOLOGY CO., LTD.
             13.2.11 XIAMEN ACEY NEW ENERGY TECHNOLOGY CO., LTD.
             13.2.12 XIAMEN LITH MACHINE LIMITED
             13.2.13 XIAMEN WINACK BATTERY TECHNOLOGY CO., LTD.
*Details on Business Overview, Products/Solutions/Services Offered, Recent Developments, and MnM View (Key strengths/Right to Win, Strategic Choices Made, and Weaknesses and Competitive Threats) might not be captured in case of unlisted companies.  
 
14 ADJACENT AND RELEVANT MARKETS (Page No. - 208)
     14.1 INTRODUCTION 
     14.2 NORTH AMERICA 
             TABLE 145 NORTH AMERICA: SOLID-STATE BATTERY MARKET, BY COUNTRY, 2019–2022 (USD MILLION)
             TABLE 146 NORTH AMERICA: SOLID-STATE BATTERY MARKET, BY COUNTRY, 2023–2030 (USD MILLION)
             TABLE 147 NORTH AMERICA: SOLID-STATE BATTERY MARKET, BY BATTERY TYPE, 2019–2022 (USD MILLION)
             TABLE 148 NORTH AMERICA: SOLID-STATE BATTERY MARKET, BY BATTERY TYPE, 2023–2030 (USD MILLION)
             14.2.1 US
                        14.2.1.1 Adoption of nanotechnology-based medical devices and electric vehicles to contribute to market growth
             14.2.2 CANADA
                        14.2.2.1 Government-led initiatives to increase use of low-emission vehicles to drive market
             14.2.3 MEXICO
                        14.2.3.1 Rising focus on increasing battery and EV production to drive market
 
15 APPENDIX (Page No. - 211)
     15.1 INSIGHTS FROM INDUSTRY EXPERTS 
     15.2 DISCUSSION GUIDE 
     15.3 KNOWLEDGESTORE: MARKETSANDMARKETS’ SUBSCRIPTION PORTAL 
     15.4 CUSTOMIZATION OPTIONS 
     15.5 RELATED REPORTS 
     15.6 AUTHOR DETAILS 


The study involved four major activities in estimating the current size of the battery cyclers market. Exhaustive secondary research has been done to collect information on the market, peer, and parent markets. The next step has been to validate these findings and assumptions and size them with industry experts across the value chain through primary research. Both top-down and bottom-up approaches have been employed to estimate the total market size. After that, market breakdown and data triangulation methods were used to estimate the market size of segments and subsegments. Two sources of information—secondary and primary—have been used to identify and collect information for an extensive technical and commercial study of the battery cyclers market.

Secondary Research

Secondary sources include company websites, magazines, industry news, associations, and databases (Factiva and Bloomberg). These secondary sources include annual reports, press releases, and investor presentations of companies, white papers, certified publications, articles by recognized authors, regulatory bodies, trade directories, and databases.

Primary Research

Primary sources mainly consist of several experts from the core and related industries, along with preferred battery cyclers providers, distributors, alliances, standards, and certification organizations related to various segments of this industry’s value chain.

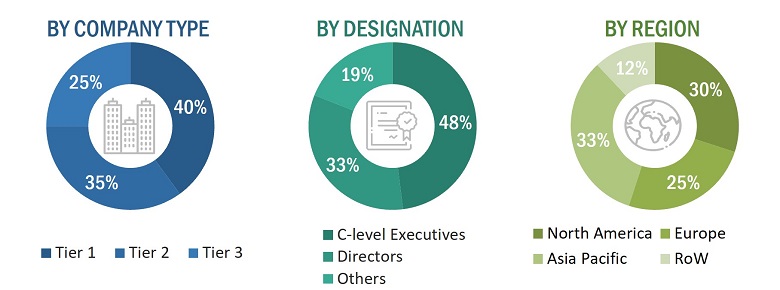
In the primary research process, various primary sources from both supply and demand sides were interviewed to obtain qualitative and quantitative information on the market. The primary sources from the supply side included various industry experts such as Chief Experience Officers (CXOs), Vice Presidents (VPs), and Directors from business development, marketing, product development/innovation teams, and related key executives from battery cyclers providers, such as AMETEK.Inc. (US), BioLogic (France), Chroma ATE, Inc. (Taiwan), Arbin Instruments (US), DIGATRON (US); research organizations, distributors, industry associations, and key opinion leaders. Following is the breakdown of primary respondents.

The breakdown of primary respondents is provided below.
Battery Cyclers Market
 Size, and Share

To know about the assumptions considered for the study, download the pdf brochure

Market Size Estimation

Both top-down and bottom-up approaches have been used to estimate and validate the total size of the battery cyclers market. These methods have also been used extensively to estimate the size of various subsegments in the market. The following research methodology has been used to estimate the market size:

  • Major players in the industry and markets have been identified through extensive secondary research.
  • The industry’s value chain and market size (in terms of value) have been determined through primary and secondary research processes.
  • All percentage shares, splits, and breakdowns have been determined using secondary sources and verified through primary sources.

Top-Down Approach

In the top-down approach, the overall market size has been used to estimate the size of the individual market segments (mentioned in market segmentation) through percentage splits from secondary and primary research. For specific market segments, the size of the most appropriate immediate parent market has been used to implement the top-down approach. The bottom-up approach has also been implemented for data obtained from secondary research to validate the market size of various segments.

Battery Cyclers Market: Top-down Approach

Battery Cyclers Market
 Size, and Top-Down Approach

Bottom-Up Approach

The bottom-up approach has been used to arrive at the overall size of the battery cyclers market from the revenues of the key players and their market shares. Calculations based on revenues of key companies identified in the market led to the estimation of their overall market size.

Battery Cyclers Market: Bottom-up Approach

Battery Cyclers Market
 Size, and Bottom-Up Approach

Data Triangulation

After arriving at the overall market size from the estimation process explained above, the overall market has been split into several segments and subsegments. The market breakdown and data triangulation procedures have been employed, wherever applicable, to complete the overall market engineering process and arrive at the exact statistics for all segments and subsegments. The data has been triangulated by studying various factors and trends from both the demand and supply sides. The market has also been validated using both top-down and bottom-up approaches.

Market Definition

Battery cyclers are devices used to test and characterize rechargeable batteries. It is used to assess a rechargeable battery's health by measuring various parameters such as capacity, efficiency, self-discharge, and degradation processes. They are essential tools in battery research, development, and quality control processes. Battery cyclers can charge and discharge batteries according to predefined profiles, allowing for the analysis of various battery parameters. These devices help researchers and engineers understand the performance and behavior of batteries under different conditions, which is crucial for optimizing battery designs and assessing their suitability for specific applications.

Key Stakeholders

  • Battery Manufacturers
  • Government Bodies and Policymakers
  • Standards Organizations, Forums, Alliances, and Associations
  • Market Research and Consulting Firms
  • Raw Material Suppliers and Distributors
  • Research Institutes and Organizations
  • Material and Technology Providers
  • Battery Cell and Battery Pack Manufacturers
  • Consumer Electronics Manufacturers
  • Automotive Manufacturers
  • Testing, Inspection, and Certification Providers
  • Distributors and Resellers

Report Objectives

  • To define and forecast the battery cyclers market regarding application, function, battery type, and industry.
  • To describe and forecast the battery cyclers market and its value segments for four regions—North America, Europe, Asia Pacific, and the Rest of the World (RoW), along with their respective countries.
  • To provide detailed information regarding the drivers, restraints, opportunities, and challenges influencing the market growth
  • To strategically analyze micro-markets with respect to individual growth trends, prospects, and contributions to the overall market size
  • To study the complete value chain of the battery cyclers market
  • To analyze opportunities for stakeholders by identifying high-growth segments of the market
  • To strategically profile the key players and comprehensively analyze their market positions in terms of their ranking and core competencies along with a detailed market competitive landscape
  • To analyze competitive developments, such as product launches, acquisitions, collaborations, agreements, and partnerships, in the market
  • To provide an analysis of the recession impact on the growth of the market and its segments

Available Customizations:

Based on the given market data, MarketsandMarkets offers customizations in the reports according to the client’s specific requirements. The available customization options are as follows:

Company Information

  • Detailed analysis and profiling of additional market players (up to 5)
Custom Market Research Services

We will customize the research for you, in case the report listed above does not meet with your exact requirements. Our custom research will comprehensively cover the business information you require to help you arrive at strategic and profitable business decisions.

Request Customization
Report Code
SE 9003
Published ON
Apr, 2024
Choose License Type
BUY NOW
  • SHARE
X
Request Customization
Speak to Analyst
Speak to Analyst
OR FACE-TO-FACE MEETING
PERSONALIZE THIS RESEARCH
  • Triangulate with your Own Data
  • Get Data as per your Format and Definition
  • Gain a Deeper Dive on a Specific Application, Geography, Customer or Competitor
  • Any level of Personalization
REQUEST A FREE CUSTOMIZATION
LET US HELP YOU!
  • What are the Known and Unknown Adjacencies Impacting the Battery Cyclers Market
  • What will your New Revenue Sources be?
  • Who will be your Top Customer; what will make them switch?
  • Defend your Market Share or Win Competitors
  • Get a Scorecard for Target Partners
CUSTOMIZED WORKSHOP REQUEST
+1-888-600-6441
  • Call Us
  • +1-888-600-6441 (Corporate office hours)
  • +1-888-600-6441 (US/Can toll free)
  • +44-800-368-9399 (UK office hours)
CONNECT WITH US
ABOUT TRUST ONLINE
©2024 MarketsandMarkets Research Private Ltd. All rights reserved
DMCA.com Protection Status Website Feedback