Metal Recycling Market by Metal (ferrous and non-ferrous), Scrap Type (Old Scrap and New Scrap), End-use Sector (Construction, Automotive, Shipbuilding, Equipment manufacturing, Consumer appliances), Equipment, and Regions - Global Forecast to 2025


Metal Recycling Market
Metal Recycling Market was valued at USD 52.1 billion in 2019 and is projected to reach USD 76.1 billion by 2025, growing at 7.8% cagr during the forecast period. The growth of this market is attributed to the increasing demand for steel and the urbanization & industrialization in developing countries. Also, growing concerns towards the depletion of natural resources at a fast rate have led governments of several countries to make favorable regulations regarding the metal recycling industry, which is further propelling the market.

To know about the assumptions considered for the study, download the pdf brochure
In terms of value and volume, the ferrous segment is projected to lead the metal recycling market from 2020 to 2025.
Based on type, the ferrous segment is projected to be a faster-growing market during the forecast period. Iron and steel scraps are some of the most widely recycled ferrous metals in the world. This scrap comes from end-of-life products and scrap generated through manufacturing processes. The use of scrap in steel production has formed an integral part of the steelmaking industry. According to the Bureau of International Recycling, 40% of the steel production is made from scraps.
In terms of value and volume, the building & construction segment of the metal recycling market is projected to grow at a highest CAGR during the forecast period.
The building & construction segment is the fastest-growing segment in the metal recycling market. The need to reduce the environmental impact of mining metals has encouraged the use of recycled metals in the building & construction sector. Most recycled metals used in this sector are obtained from demolition waste, which is one of the largest sources of metal waste, especially in the US.
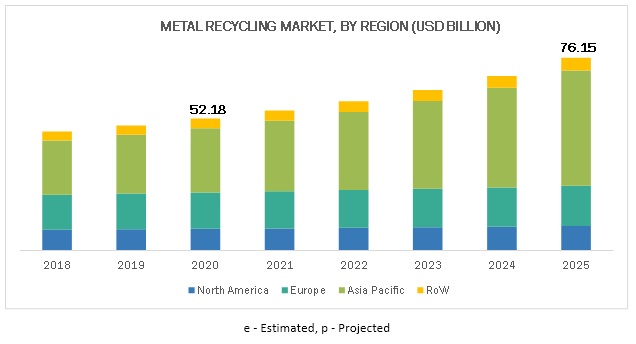
In terms of both value as well as volume, the Asia Pacific region is expected to account for the largest share in the global metal recycling market during the forecast period.
Asia Pacific is the fastest-growing market for metal recycling due to its increasing economic growth. It accounted for over a third of the world’s GDP, according to a paper published by World Economics in February 2017. According to the Population Reference Bureau, the fastest-growing consumer markets of China, India, and other Asia Pacific countries had a combined population exceeding four billion people (as of 2018). This is projected to an be important driver for global consumption of consumer durables and the building & construction sector over the next two decades; this, in turn, is expected to lead to the growth of the metal recycling market. Other drivers that will have a positive impact on this market are increasing household incomes and the growing middle-class population.
Metal Recycling Market Players
Arcelormittal (Luxembourg) is a leading company in Europe and one of the world’s leading steel manufacturers. ArcelorMittal is considered to be the largest steel producer in America, Africa, and Europe In 2018, ArcelorMittal recycled 31 million tons of scrap steel, which included primary steel arising from the company’s own operations and scrap that was purchased for use in the company’s furnaces. The use of scrap steel avoided 40 million tons of CO2 emissions. Their global R&D division is currently working with Worldsteel Association on a number of recycling projects. Also they have been collaborating with the automotive industry to analyze how much more value can be achieved by disassembling vehicles before they are shredded to recover scrap.
Metal Recycling Market Report Scope
|
Report Metric |
Details |
|
Market Size Value in 2019 |
USD 52.1 billion |
|
Revenue Forecast in 2025 |
USD 76.1 billion |
|
CAGR |
7.8% |
|
Market size available for years |
2018-2025 |
|
Base year considered |
2019 |
|
Forecast period |
2020-2025 |
|
Forecast units |
Value (USD Billion) and Volume (Million Tons) |
|
Segments covered |
Type, scrap type, end-use sector, and region |
|
Geographies covered |
North America, Asia Pacific, Europe, and Rest of the World |
|
Companies covered |
ArcelorMittal (Luxembourg), Nucor Corporation (US), Commercial Metals Company (US), Sims Metal Management Limited (US), and Aurubis AG (Germany) are the key players operating in the metal recycling market. Fifteen manufacturers are covered in the metal recycling market. |
This research report categorizes the metal recycling market based on scrap type, type, equipment, end-use sector, and region.
By Scrap Type:
- Old Scrap
- New Scrap
By Type:
- Ferrous
- Non-Ferrous
By Equipment:
- Shredders
- Shears
- Granulating Machines
- Briquetting Machines
By End-use Sector:
- Building & Construction
- Automotive
- Equipment Manufacturing
- Shipbuilding
- Packaging
- Consumer Appliances
- Others (Home & Industrial Furniture, Aerospace, and Residential & Commercial Utensils & Containers)
By Region:
- North America
- Europe
- Asia Pacific
- Rest of the World
Recent Developments
- In November 2019, ArcelorMittal invested in new sustainability program in Europe with the aim to secure Responsible Steel site certification for all its ArcelorMittal Europe - Flat Products sites.
- In May 2019, Nucor Corporation announced a capital investment that will add its vacuum degassing to its engineered bar capabilities at its bar mill in Darlington, South Carolina. Adding this capability will enable the mill to produce engineered bar products meeting some of the most stringent quality specifications in the industry. The vacuum degassing system is expected to begin operations in late 2020.
- In May 2019, Aurubis AG acquired Belgian-Spanish Metallo Group to continue actively pursuing its multi-metal and recycling strategy. The acquisition, with its attractive growth potential, strengthens company’s multi-metal portfolio, especially in the key metals copper, nickel, tin, zinc, and lead.
Key Questions addressed by the Report
- What are the global trends in the metal recycling market? Would the market witness an increase or decline in the demand in the coming years?
- What is the estimated demand for different types of metals in metal recycling?
- Where will the strategic developments take the industry in the mid to long-term?
- What are the upcoming industry applications and trends for metal recycling?
- Who are the major players in the metal recycling market globally?
Frequently Asked Questions (FAQ):
What are the factors influencing the growth of metal recycling?
Key factor influencing the growth of metal recycling are stringent laws and regulations enforced by governments, the increase in awareness programs for sustainable waste management practices and the fact that recycling of metals leads to energy saving as compared to mining for new materials.
What are the types of metal recycling?
The two main types of metal recycling is ferrous and non-ferrous recycling. Ferrous metals possess iron and magnetic properties. This scrap comes from end-of-life products and scrap generated through manufacturing processes. Non-ferrous metals do not contain iron; they include aluminum, copper, brass, tin, nickel, lead, and zinc. Precious metals, such as gold and silver, are also non-ferrous metals. These metals are more malleable than ferrous metals; they are lighter and have a higher resistance to corrosion. These metals are recycled into products such as sewage pipes, water pipes, packaging, furniture, roofing, and road signs.
Who are the major players in the market?
The major players are ArcelorMittal (Luxembourg), Nucor Corporation (US), Commercial Metals Company (US), SIMS Metal Management Limited (US) and Aurubis AG (Germany).
Which are the most recycled metals?
Iron and steel scraps are some of the most widely recycled ferrous metals in the world whereas aluminum is one of the most recycled non-ferrous metals in the world.
What are the different stages of metal recycling?
The process of making the final product from scrap metal ideally involves various stages, such as collection & transportation, sorting, shredding, processing, and melting & purification.
Which are the end-use sectors that recycled metal finds its application in?
Recycled metals find major applications in various end-use sectors, including building & construction, automotive, shipbuilding, packaging, equipment manufacturing, consumer appliances, and aerospace & defense, industrial & commercial furniture & utensils.
What are the major challenges faced by the metal recycling market?
The major challenges faced are the increasing complexity of products makes recycling difficult and difficulty in the management of the supply chain. The different parties involved in the supply chain of metal recycling, such as municipalities and private companies are under constant pressure to bring down costs incurred in this process. Reducing these costs, simplifying the supply chain mechanism, and increasing efficiency are now major challenges for companies.
What is the biggest Restraint for metal recycling?
The biggest restraint faced is the unorganized metal waste collection observed in the developing countries. Waste collection and segregation is the basic foundation required for recycling of metal and metal products or any other items such as paper, plastics, and wood products. Inappropriate disposal of waste poses a big threat to the municipalities and other concerned bodies involved in waste management.
How does metal recycling help the environment?
Metal recycling helps company save energy which will reduce their carbon footprint. A ton of recycled steel saves 1,131 kg of iron ore, 633kg of coal, and 54 kg of limestone which will save the energy required to mine these materials. One pound of steel recycling enables 70% of energy savings, whereas 95% of energy-saving is witnessed by using recycled aluminum.
What are the opportunities for the metal recycling market?
Metal recovery from slag residue is one of the opportunities for the metal recycling market. Slag is a valuable resource for steelmakers. Most ferrous metal and stainless steel plants lose a considerable amount of metal in their slag and metal–slag mix. Depending on the smelting process and age of the slag dump, metal contents may vary between 3% and 15%.
To speak to our analyst for a discussion on the above findings, click Speak to Analyst
TABLE OF CONTENTS
1 INTRODUCTION (Page No. - 16)
1.1 OBJECTIVES OF THE STUDY
1.2 MARKET DEFINITION
1.3 MARKET SCOPE
1.4 YEARS CONSIDERED FOR THE STUDY
1.5 CURRENCY CONSIDERED
1.6 UNITS CONSIDERED
1.7 STAKEHOLDERS
2 RESEARCH METHODOLOGY (Page No. - 20)
2.1 RESEARCH DATA
2.2 MARKET SIZE ESTIMATION
2.3 DATA TRIANGULATION
2.4 RESEARCH ASSUMPTIONS & LIMITATIONS
2.4.1 ASSUMPTIONS
2.4.2 LIMITATIONS
3 EXECUTIVE SUMMARY (Page No. - 25)
4 PREMIUM INSIGHTS (Page No. - 29)
4.1 ATTRACTIVE OPPORTUNITIES IN THE METAL RECYCLING MARKET
4.2 ASIA PACIFIC METAL RECYCLING: MARKET,BY TYPE AND COUNTRY,2019
4.3 METAL RECYCLING :MARKET,BY TYPE
4.4 METAL RECYCLING MARKET,BY SCRAP TYPE
4.5 METAL RECYCLING: MARKET,BY END-USE SECTOR
4.6 METAL RECYCLING MARKET,BY COUNTRY
5 MARKET OVERVIEW (Page No. - 32)
5.1 INTRODUCTION
5.2 MARKET DYNAMICS
5.2.1 DRIVERS
5.2.1.1 Laws and regulations enforced by governments
5.2.1.2 Awareness programs for sustainable waste management practices
5.2.1.3 Increasing urbanization and industrialization
5.2.1.4 Recycling of metals leads to energy saving as compared to mining for new materials
5.2.1.5 Increasing awareness about the effective use of natural resources
5.2.2 RESTRAINTS
5.2.2.1 Unorganized metal waste collection in developing countries
5.2.2.2 Regulations hampering free and fair trade of scrap metal
5.2.3 OPPORTUNITIES
5.2.3.1 Emerging economies
5.2.3.2 Metal recovery from slag residue
5.2.3.3 Public & private sector partnership helps establish a win-win situation
5.2.4 CHALLENGES
5.2.4.1 Increasing complexity of products makes recycling difficult
5.2.4.2 Difficulty in management of supply chain
6 METAL RECYCLING MARKET,BY TYPE (Page No. - 40)
6.1 INTRODUCTION
6.2 FERROUS METALS
6.2.1 FERROUS METALS GENERATE THE HIGHEST REVENUE OWING TO HIGH SCRAP CONSUMPTION AND RECYCLING RATE
6.3 NON-FERROUS
6.3.1 RECYCLING OF NON-FERROUS SCRAP ENABLES EFFICIENT USE OF EARTH’S RESOURCES
7 METAL RECYCLING MARKET,BY SCRAP TYPE (Page No. - 43)
7.1 INTRODUCTION
7.2 OLD SCRAP
7.2.1 THE OLD SCRAP SEGMENT TO LEAD THE METAL RECYCLING MARKET
7.3 NEW SCRAP
7.3.1 RISING DEMAND FOR RECYCLING AND PROCESSING OF INDUSTRIAL SCRAP WILL DRIVE THE MARKET FOR NEW SCRAP SEGMENT
8 METAL RECYCLING MARKET,BY EQUIPMENT (Page No. - 46)
8.1 INTRODUCTION
8.2 SHREDDER
8.3 SHEARING
8.4 GRANULATION
8.5 BRIQUETTING MACHINES
9 METAL RECYCLING MARKET,BY END-USE SECTOR (Page No. - 48)
9.1 INTRODUCTION
9.2 BUILDING & CONSTRUCTION
9.2.1 THE BUILDING & CONSTRUCTION SEGMENT DOMINATED THE METAL RECYCLING MARKET IN 2019
9.3 AUTOMOTIVE
9.3.1 AUTOMOTIVE IS PROJECTED TO BE THE SECOND FASTEST-GROWING SEGMENT
9.4 EQUIPMENT MANUFACTURING
9.4.1 RECYCLED METALS ARE WIDELY USED IN EQUIPMENT MANUFACTURING
9.5 SHIPBUILDING
9.5.1 AGING SHIP OFFERS PLENTY OF VALUABLE PARTS TO METAL RECYCLING INDUSTRY
9.6 PACKAGING
9.6.1 INCREASING DEMAND FOR RECYCLING OF METAL,STEEL,AND ALUMINUM CANS IS DRIVING THE PACKAGING END-USE INDUSTRY IN METAL RECYCLING MARKET
9.7 CONSUMER APPLIANCES
9.7.1 CONSUMER APPLIANCES SEGMENT TO GROW AT THE LOWEST RATE IN THE METAL RECYCLING MARKET
9.8 OTHERS
10 METAL RECYCLING MARKET,BY REGION (Page No. - 53)
10.1 INTRODUCTION
10.2 NORTH AMERICA
10.2.1 US
10.2.2 CANADA
10.2.3 MEXICO
10.3 EUROPE
10.3.1 UK
10.3.2 GERMANY
10.3.3 ITALY
10.3.4 FRANCE
10.3.5 RUSSIA
10.3.6 SPAIN
10.3.7 REST OF EUROPE
10.4 ASIA PACIFIC
10.4.1 CHINA
10.4.2 INDIA
10.4.3 JAPAN
10.4.4 SOUTH KOREA
10.4.5 AUSTRALIA
10.4.6 REST OF ASIA PACIFIC
10.5 ROW
10.5.1 BRAZIL
10.5.2 TURKEY
10.5.3 REST OF ROW
11 COMPETITIVE LANDSCAPE (Page No. - 98)
11.1 OVERVIEW
11.2 COMPETITIVE SCENARIO
11.2.1 ACQUISITIONS
11.2.2 EXPANSIONS AND INVESTMENTS
11.3 MICROQUADRANT FOR METAL RECYCLING MARKET
11.3.1 VISIONARY LEADERS
11.3.2 INNOVATORS
11.3.3 DYNAMIC DIFFERENTIATORS
11.3.4 EMERGING COMPANIES
11.4 METAL RECYCLING MARKET (GLOBAL) COMPETITIVE LEADERSHIP MAPPING,2019
12 COMPANY PROFILES (Page No. - 104)
(Business Overview,Financial assessment,Operational assessment,Products & services offered,Recent developments,SWOT Analysis,MNM view)
12.1 ARCELORMITTAL
12.2 NUCOR CORPORATION
12.3 COMMERCIAL METALS COMPANY
12.4 SIMS METAL MANAGEMENT LIMITED
12.5 AURUBIS AG
12.6 DOWA HOLDINGS CO.,LTD.
12.7 TATA STEEL LIMITED
12.8 BAOSTEEL GROUP CORPORATION
12.9 EUROPEAN METAL RECYCLING LIMITED
12.10 OTHER KEY PLAYERS
12.10.1 TOTALL METAL RECYCLING,INC.
12.10.2 AMERICAN IRON & METAL (AIM)
12.10.3 TOM MARTIN & COMPANY LTD
12.10.4 KUUSAKOSKI RECYCLING
12.10.5 NORTON ALUMINIUM
12.10.6 REMONDIS SE & CO. KG
*Details on Business Overview,Financial assessment,Operational assessment,Products & services offered,Recent developments,SWOT Analysis,MNM view might not be captured in case of unlisted companies.
13 APPENDIX (Page No. - 132)
13.1 DISCUSSION GUIDE
13.2 KNOWLEDGE STORE: MARKETSANDMARKETS SUBSCRIPTION PORTAL
13.3 AVAILABLE CUSTOMIZATIONS
13.4 RELATED REPORTS
13.5 AUTHOR DETAILS
LIST OF TABLES (134 Tables)
TABLE 1 USD CONVERSION RATES,2016–2018
TABLE 2 WORLD URBANIZATION PROSPECTS
TABLE 3 IMPACT OF KEY DRIVERS ON THE METAL RECYCLING MARKET
TABLE 4 REGULATIONS IMPLEMENTED ON EXPORTS MAY RESTRAIN MARKET GROWTH
TABLE 5 EMERGING ECONOMIES AND RECOVERY OF METAL FROM SLAG ARE KEY OPPORTUNITIES FOR THE METAL RECYCLING MARKET
TABLE 6 INCREASING COMPLEXITY OF PRODUCTS IS A KEY CHALLENGE FOR THE METAL RECYCLING MARKET
TABLE 7 METAL RECYCLING MARKET SIZE,BY TYPE,2018–2025 (USD MILLION)
TABLE 8 MARKET SIZE,BY TYPE,2018–2025 (MILLION TON)
TABLE 9 METAL RECYCLING MARKET SIZE,BY SCRAP TYPE,2018–2025 (USD MILLION)
TABLE 10 MARKET SIZE,BY SCRAP TYPE,2018–2025 (MILLION TON)
TABLE 11 METAL RECYCLING MARKET SIZE,BY END-USE SECTOR,2018–2025 (USD MILLION)
TABLE 12 MARKET SIZE,BY END-USE SECTOR,2018–2025 (MILLION TON)
TABLE 13 METAL RECYCLING MARKET SIZE,BY REGION,2018–2025 (USD MILLION)
TABLE 14 MARKET SIZE,BY REGION,2018–2025 (MILLION TON)
TABLE 15 NORTH AMERICA: METAL RECYCLING MARKET SIZE,BY COUNTRY,2018–2025 (USD MILLION)
TABLE 16 NORTH AMERICA: MARKET SIZE,BY COUNTRY,2018–2025 (MILLION TON)
TABLE 17 NORTH AMERICA: MARKET SIZE,BY TYPE,2018–2025 (USD MILLION)
TABLE 18 NORTH AMERICA: MARKET SIZE,BY TYPE,2018–2025 (MILLION TON)
TABLE 19 NORTH AMERICA: MARKET SIZE,BY SCRAP TYPE,2018–2025 (USD MILLION)
TABLE 20 NORTH AMERICA: MARKET SIZE,BY SCRAP TYPE,2018–2025 (MILLION TON)
TABLE 21 NORTH AMERICA: MARKET SIZE,BY END-USE SECTOR,2018–2025 (USD MILLION)
TABLE 22 NORTH AMERICA: MARKET SIZE,BY END-USE SECTOR,2018–2025 (MILLION TON)
TABLE 23 US: LAWS AND REGULATIONS
TABLE 24 US: METAL RECYCLING MARKET SIZE,BY TYPE,2018–2025 (USD MILLION)
TABLE 25 US: MARKET SIZE,BY TYPE,2018–2025 (MILLION TON)
TABLE 26 US: MARKET SIZE,BY SCRAP TYPE,2018–2025 (USD MILLION)
TABLE 27 US: MARKET SIZE,BY SCRAP TYPE,2018–2025 (MILLION TON)
TABLE 28 CANADA: LAWS AND REGULATIONS
TABLE 29 CANADA: METAL RECYCLING MARKET SIZE,BY TYPE,2018–2025 (USD MILLION)
TABLE 30 CANADA: MARKET SIZE,BY TYPE,2018–2025 (MILLION TON)
TABLE 31 CANADA: MARKET SIZE,BY SCRAP TYPE,2018–2025 (USD MILLION)
TABLE 32 CANADA: MARKET SIZE,BY SCRAP TYPE,2018–2025 (MILLION TON)
TABLE 33 MEXICO: LAWS AND REGULATIONS
TABLE 34 MEXICO: METAL RECYCLING MARKET SIZE,BY TYPE,2018–2025 (USD MILLION)
TABLE 35 MEXICO: MARKET SIZE,BY TYPE,2018–2025 (MILLION TON)
TABLE 36 MEXICO: MARKET SIZE,BY SCRAP TYPE,2018–2025 (USD MILLION)
TABLE 37 MEXICO: MARKET SIZE,BY SCRAP TYPE,2018–2025 (MILLION TON)
TABLE 38 EUROPE: METAL RECYCLING MARKET SIZE,BY COUNTRY,2018–2025 (USD MILLION)
TABLE 39 EUROPE: MARKET SIZE,BY COUNTRY,2018–2025 (MILLION TON)
TABLE 40 EUROPE: MARKET SIZE,BY TYPE,2018–2025 (USD MILLION)
TABLE 41 EUROPE: MARKET SIZE,BY TYPE,2018–2025 (MILLION TON)
TABLE 42 EUROPE: MARKET SIZE,BY SCRAP TYPE,2018–2025 (USD MILLION)
TABLE 43 EUROPE: MARKET SIZE,BY SCRAP TYPE,2018–2025 (MILLION TON)
TABLE 44 EUROPE: MARKET SIZE,BY END-USE SECTOR,2018–2025 (USD MILLION)
TABLE 45 EUROPE: MARKET SIZE,BY END-USE SECTOR,2018–2025 (MILLION TON)
TABLE 46 UK: LAWS AND REGULATIONS
TABLE 47 UK: METAL RECYCLING MARKET SIZE,BY TYPE,2018–2025 (USD MILLION)
TABLE 48 UK: MARKET SIZE,BY TYPE,2018–2025 (MILLION TON)
TABLE 49 UK: MARKET SIZE,BY SCRAP TYPE,2018–2025 (USD MILLION)
TABLE 50 UK: MARKET SIZE,BY SCRAP TYPE,2018–2025 (MILLION TON)
TABLE 51 GERMANY: LAWS AND REGULATIONS
TABLE 52 GERMANY: METAL RECYCLING MARKET SIZE,BY TYPE,2018–2025 (USD MILLION)
TABLE 53 GERMANY: MARKET SIZE,BY TYPE,2018–2025 (MILLION TON)
TABLE 54 GERMANY: MARKET SIZE,BY SCRAP TYPE,2018–2025 (USD MILLION)
TABLE 55 GERMANY: MARKET SIZE,BY SCRAP TYPE,2018–2025 (MILLION TONS)
TABLE 56 ITALY: METAL RECYCLING MARKET SIZE,BY TYPE,2018–2025 (USD MILLION)
TABLE 57 ITALY: MARKET SIZE,BY TYPE,2018–2025 (MILLION TON)
TABLE 58 ITALY: MARKET SIZE,BY SCRAP TYPE,2018–2025 (USD MILLION)
TABLE 59 ITALY: MARKET SIZE,BY SCRAP TYPE,2018–2025 (MILLION TON)
TABLE 60 FRANCE: METAL RECYCLING MARKET SIZE,BY TYPE,2018–2025 (USD MILLION)
TABLE 61 FRANCE: MARKET SIZE,BY TYPE,2018–2025 (MILLION TON)
TABLE 62 FRANCE: MARKET SIZE,BY SCRAP TYPE,2018–2025 (USD MILLION)
TABLE 63 FRANCE: MARKET SIZE,BY SCRAP TYPE,2018–2025 (MILLION TON)
TABLE 64 RUSSIA: LAWS AND REGULATIONS
TABLE 65 RUSSIA: METAL RECYCLING MARKET SIZE,BY TYPE,2018–2025 (USD MILLION)
TABLE 66 RUSSIA: MARKET SIZE,BY TYPE,2018–2025 (MILLION TON)
TABLE 67 RUSSIA: MARKET SIZE,BY SCRAP TYPE,2018–2025 (USD MILLION)
TABLE 68 RUSSIA: MARKET SIZE,BY SCRAP TYPE,2018–2025 (MILLION TON)
TABLE 69 SPAIN: METAL RECYCLING MARKET SIZE,BY TYPE,2018–2025 (USD MILLION)
TABLE 70 SPAIN: MARKET SIZE,BY TYPE,2018–2025 (MILLION TON)
TABLE 71 SPAIN: MARKET SIZE,BY SCRAP TYPE,2018–2025 (USD MILLION)
TABLE 72 SPAIN: MARKET SIZE,BY SCRAP TYPE,2018–2025 (MILLION TON)
TABLE 73 REST OF EUROPE: METAL RECYCLING MARKET SIZE,BY TYPE,2018–2025 (USD MILLION)
TABLE 74 REST OF EUROPE: MARKET SIZE,BY TYPE,2018–2025 (MILLION TON)
TABLE 75 REST OF EUROPE: MARKET SIZE,BY SCRAP TYPE,2018–2025 (USD MILLION)
TABLE 76 REST OF EUROPE: MARKET SIZE,BY SCRAP TYPE,2018–2025 (MILLION TON)
TABLE 77 ASIA PACIFIC: METAL RECYCLING MARKET SIZE,BY COUNTRY,2018–2025 (USD MILLION)
TABLE 78 ASIA PACIFIC: MARKET SIZE,BY COUNTRY,2018–2025 (MILLION TON)
TABLE 79 ASIA PACIFIC: MARKET SIZE,BY TYPE,2018–2025 (USD MILLION)
TABLE 80 ASIA PACIFIC: MARKET SIZE,BY TYPE,2018–2025 (MILLION TON)
TABLE 81 ASIA PACIFIC: MARKET SIZE,BY SCRAP TYPE,2018–2025 (USD MILLION)
TABLE 82 ASIA PACIFIC: MARKET SIZE,BY SCRAP TYPE,2018–2025 (MILLION TON)
TABLE 83 ASIA PACIFIC: MARKET SIZE,BY END-USE SECTOR,2018–2025 (USD MILLION)
TABLE 84 ASIA PACIFIC: MARKET SIZE,BY END-USE SECTOR,2018–2025 (MILLION TON)
TABLE 85 CHINA: METAL RECYCLING MARKET SIZE,BY TYPE,2018–2025 (USD MILLION)
TABLE 86 CHINA: MARKET SIZE,BY TYPE,2018–2025 (MILLION TON)
TABLE 87 CHINA: MARKET SIZE,BY SCRAP TYPE,2018–2025 (USD MILLION)
TABLE 88 CHINA: MARKET SIZE,BY SCRAP TYPE,2018–2025 (MILLION TON)
TABLE 89 INDIA: LAWS AND REGULATIONS
TABLE 90 INDIA: METAL RECYCLING MARKET SIZE,BY TYPE,2018–2025 (USD MILLION)
TABLE 91 INDIA: MARKET SIZE,BY TYPE,2018–2025 (MILLION TON)
TABLE 92 INDIA: MARKET SIZE,BY SCRAP TYPE,2018–2025 (USD MILLION)
TABLE 93 INDIA: MARKET SIZE,BY SCRAP TYPE,2018–2025 (MILLION TON)
TABLE 94 JAPAN: LAWS AND REGULATIONS
TABLE 95 JAPAN: METAL RECYCLING MARKET SIZE,BY TYPE,2018–2025 (USD MILLION)
TABLE 96 JAPAN: MARKET SIZE,BY TYPE,2018–2025 (MILLION TON)
TABLE 97 JAPAN: MARKET SIZE,BY SCRAP TYPE,2018–2025 (USD MILLION)
TABLE 98 JAPAN: MARKET SIZE,BY SCRAP TYPE,2018–2025 (MILLION TON)
TABLE 99 SOUTH KOREA: METAL RECYCLING MARKET SIZE,BY TYPE,2018–2025 (USD MILLION)
TABLE 100 SOUTH KOREA: MARKET SIZE,BY TYPE,2018–2025 (MILLION TON)
TABLE 101 SOUTH KOREA: MARKET SIZE,BY SCRAP TYPE,2018–2025 (USD MILLION)
TABLE 102 SOUTH KOREA: MARKET SIZE,BY SCRAP TYPE,2018–2025 (MILLION TON)
TABLE 103 AUSTRALIA: METAL RECYCLING MARKET SIZE,BY TYPE,2018–2025 (USD MILLION)
TABLE 104 AUSTRALIA: MARKET SIZE,BY TYPE,2018–2025 (MILLION TON)
TABLE 105 AUSTRALIA: MARKET SIZE,BY SCRAP TYPE,2018–2025 (USD MILLION)
TABLE 106 AUSTRALIA: MARKET SIZE,BY SCRAP TYPE,2018–2025 (MILLION TON)
TABLE 107 REST OF ASIA PACIFIC: METAL RECYCLING MARKET SIZE,BY TYPE,2018–2025 (USD MILLION)
TABLE 108 REST OF ASIA PACIFIC: MARKET SIZE,BY TYPE,2018–2025 (MILLION TON)
TABLE 109 REST OF ASIA PACIFIC: MARKET SIZE,BY SCRAP TYPE,2018–2025 (USD MILLION)
TABLE 110 REST OF ASIA PACIFIC: MARKET SIZE,BY SCRAP TYPE,2018–2025 (MILLION TON)
TABLE 111 ROW: METAL RECYCLING MARKET SIZE,BY COUNTRY,2018–2025 (USD MILLION)
TABLE 112 ROW: MARKET SIZE,BY COUNTRY,2018–2025 (MILLION TON)
TABLE 113 ROW: MARKET SIZE,BY TYPE,2018–2025 (USD MILLION)
TABLE 114 ROW: MARKET SIZE,BY TYPE,2018–2025 (MILLION TON)
TABLE 115 ROW: MARKET SIZE,BY SCRAP TYPE,2018–2025 (USD MILLION)
TABLE 116 ROW: MARKET SIZE,BY SCRAP TYPE,2018 TO 2025 (MILLION TON)
TABLE 117 ROW: MARKET SIZE,BY END-USE SECTOR,2018–2025 (USD MILLION)
TABLE 118 ROW: MARKET SIZE,BY END-USE SECTOR,2018–2025 (MILLION TON)
TABLE 119 BRAZIL: LAWS AND REGULATIONS
TABLE 120 BRAZIL: METAL RECYCLING MARKET SIZE,BY TYPE,2018–2025 (USD MILLION)
TABLE 121 BRAZIL: MARKET SIZE,BY TYPE,2018–2025 (MILLION TON)
TABLE 122 BRAZIL: MARKET SIZE,BY SCRAP TYPE,2018–2025 (USD MILLION)
TABLE 123 BRAZIL: MARKET SIZE,BY SCRAP TYPE,2018–2025 (MILLION TONS)
TABLE 124 TURKEY: LAWS AND REGULATIONS
TABLE 125 TURKEY: METAL RECYCLING MARKET SIZE,BY TYPE,2018–2025 (USD MILLION)
TABLE 126 TURKEY: MARKET SIZE,BY TYPE,2018 TO 2025 (MILLION TON)
TABLE 127 TURKEY: MARKET SIZE,BY SCRAP TYPE,2018–2025 (USD MILLION)
TABLE 128 TURKEY: MARKET SIZE,BY SCRAP TYPE,2018–2025 (MILLION TON)
TABLE 129 REST OF ROW: METAL RECYCLING MARKET SIZE,BY TYPE,2018–2025 (USD MILLION)
TABLE 130 REST OF ROW: MARKET SIZE,BY TYPE,2018 T–O 2025 (MILLION TON)
TABLE 131 REST OF ROW: MARKET SIZE,BY SCRAP TYPE,2018–2025 (USD MILLION)
TABLE 132 REST OF ROW: MARKET SIZE,BY SCRAP TYPE,2018–2025 (MILLION TON)
TABLE 133 ACQUISITION
TABLE 134 EXPANSIONS AND INVESTMENTS
LIST OF FIGURES (36 Figures)
FIGURE 1 METAL RECYCLING MARKET SEGMENTATION
FIGURE 2 APPROACH 1 (BASED ON TYPE,BY COUNTRY)
FIGURE 3 APPROACH 2 (BASED ON SCRAP TYPE)
FIGURE 4 METAL RECYCLING MARKET: DATA TRIANGULATION
FIGURE 5 KEY MARKET INSIGHTS
FIGURE 6 LIST OF STAKEHOLDERS INVOLVED AND BREAKDOWN OF PRIMARY INTERVIEWS
FIGURE 7 FERROUS METAL TO GROW AT THE HIGHER RATE
FIGURE 8 OLD SCRAP SEGMENT TO WITNESS THE FASTER GROWTH RATE
FIGURE 9 BUILDING & CONSTRUCTION TO RECORD THE HIGHEST CAGR
FIGURE 10 ASIA PACIFIC LED THE METAL RECYCLING MARKET IN 2019
FIGURE 11 EMERGING ECONOMIES OFFER ATTRACTIVE OPPORTUNITIES IN THE METAL RECYCLING MARKET
FIGURE 12 CHINA WAS THE LARGEST MARKET FOR METAL RECYCLING
FIGURE 13 FERROUS SEGMENT IS PROJECTED TO LEAD THE MARKET DURING THE FORECAST PERIOD
FIGURE 14 OLD SCRAP IS PROJECTED TO BE THE FASTER-GROWING SEGMENT
FIGURE 15 BUILDING & CONSTRUCTION TO LEAD THE METAL RECYCLING MARKET
FIGURE 16 CHINA IS PROJECTED TO GROW AT THE HIGHEST CAGR FROM 2020 TO 2025
FIGURE 17 DRIVERS,RESTRAINTS,OPPORTUNITIES,AND CHALLENGES IN THE METAL RECYCLING MARKET
FIGURE 18 FERROUS SEGMENT TO DOMINATE THE METAL RECYCLING MARKET
FIGURE 19 OLD SCRAP TO REMAIN THE LARGER METAL RECYCLING MARKET
FIGURE 20 AUTOMOTIVE TO BE THE SECOND-LARGEST SEGMENT IN THE MARKET
FIGURE 21 GEOGRAPHIC SNAPSHOT (2020–2025): THE MARKET IN CHINA IS PROJECTED TO GROW AT THE HIGHEST RATE
FIGURE 22 APAC METAL RECYCLING COATINGS MARKET SNAPSHOT
FIGURE 23 COMPANIES ADOPTED ACQUISITIONS AS THE KEY GROWTH STRATEGY BETWEEN 2015 AND 2019
FIGURE 24 ARCELORMITTAL: COMPANY SNAPSHOT
FIGURE 25 ARCELORMITTAL: SWOT ANALYSIS
FIGURE 26 NUCOR CORPORATION: COMPANY SNAPSHOT
FIGURE 27 NUCOR CORPORATION: SWOT ANALYSIS
FIGURE 28 COMMERCIAL METALS COMPANY: COMPANY SNAPSHOT
FIGURE 29 COMMERCIAL METALS COMPANY: SWOT ANALYSIS
FIGURE 30 SIMS METAL MANAGEMENT LIMITED: COMPANY SNAPSHOT
FIGURE 31 SIMS METAL MANAGEMENT LIMITED: SWOT ANALYSIS
FIGURE 32 AURUBIS AG: COMPANY SNAPSHOT
FIGURE 33 AURUBIS AG: SWOT ANALYSIS
FIGURE 34 DOWA HOLDINGS CO.,LTD.: COMPANY SNAPSHOT
FIGURE 35 TATA STEEL LIMITED: COMPANY SNAPSHOT
FIGURE 36 BAOSTEEL GROUP CORPORATION: COMPANY SNAPSHOT
The study involved four major activities for estimating the current global size of the metal recycling market. The exhaustive secondary research was carried out to collect information on the market, the peer market, and the parent market. The next step was to validate these findings, assumptions and sizes with the industry experts across the value chain of metal recycling through primary research. Both the top-down and bottom-up approaches were employed to estimate the overall size of the metal recycling market. After that, market breakdown and data triangulation procedures were used to determine the size of different segments and sub-segments of the market.
Metal Recycling Market Secondary Research
In the secondary research process, various secondary sources such as Hoovers, Factiva, Bloomberg BusinessWeek, and Dun & Bradstreet were referred to, to identify and collect information for this study on the metal recycling market. These secondary sources included annual reports, press releases & investor presentations of companies, white papers, certified publications, articles by recognized authors, regulatory bodies, trade directories, and databases.
Metal Recycling Market Primary Research
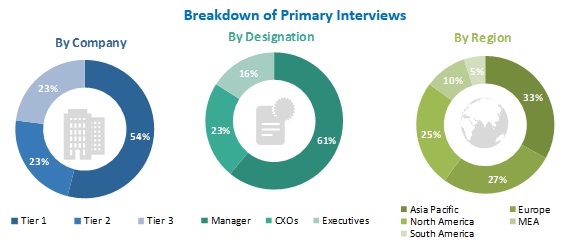
Various primary sources from both the supply and demand sides of the metal recycling market were interviewed to obtain qualitative and quantitative information. The primary sources from the supply-side included industry experts, such as Chief Executive Officers (CEOs), vice presidents, marketing directors, sales professionals, and related key executives from various leading companies and organizations operating in the metal recycling industry. The primary sources from the demand-side included key executives from banks, government organizations, and educational institutions.
To know about the assumptions considered for the study, download the pdf brochure
Metal Recycling Market Size Estimation
Both the top-down and bottom-up approaches were used to estimate and validate the global size of the metal recycling market. These approaches were also used extensively to estimate the size of various dependent segments of the market. The research methodology used to estimate the market size included the following details:
- The key players were identified through extensive secondary research.
- The industry’s supply chain and market size, in terms of value, were determined through primary and secondary research processes.
- All percentage shares, splits, and breakdowns were determined using secondary sources and verified through primary sources.
Metal Recycling Market Data Triangulation
After arriving at the overall market size from the estimation process explained above, the total market was split into several segments and sub-segments. The data triangulation and market breakdown procedures were employed, wherever applicable, to complete the overall market engineering process and arrive at the exact statistics for all segments and sub-segments of the metal recycling market. The data was triangulated by studying various factors and trends from both the demand- and supply-side.
Metal Recycling Market Report Objectives
- To define, analyze, and project the size of the metal recycling market in terms of value and volume based on type, scrap type, end-use sector, and region.
- To project the size of the market and its segments in terms of value and volume, with respect to the four main regions, namely, North America, Europe, Asia Pacific, and Rest of the World.
- To provide detailed information about the key factors, such as drivers, restraints, opportunities, and challenges, influencing the growth of the market
- To strategically analyze the micro-markets with respect to individual growth trends, prospects, and their contribution to the total market
- To analyze the opportunities in the market for stakeholders and provide a detailed competitive landscape of the market leaders
- To analyze the competitive developments, such as expansions and acquisitions in the metal recycling market
- To strategically profile the key players operating in the market and comprehensively analyze their market shares and core competencies
Metal Recycling Market Report Available Customizations
With the given market data, MarketsandMarkets offers customizations according to client-specific needs.
The following customization options are available for the metal recycling report:
Metal Recycling Market Product Analysis
- Product matrix, which offers a detailed comparison of the product portfolio of companies
Metal Recycling Market Regional Analysis
- Further analysis of the metal recycling market for additional countries
Metal Recycling Market Company Information
- Detailed analysis and profiling of other market players (up to five)


Growth opportunities and latent adjacency in Metal Recycling Market